The curves (a),(b),(c) and (d) show the variation between the applied potential difference (V) and the photoelectric current (i) , at two different intensities of light (I1>I2). In which figure is the correct variation shown ?


The correct Answer is:B
To determine the correct variation between the applied potential difference (V) and the photoelectric current (i) for two different intensities of light (I1 > I2), we can follow these steps:
1. Understanding the Photoelectric Effect: The photoelectric effect states that when light of sufficient frequency (or energy) shines on a metal surface, it can eject electrons from that surface. The energy of the incident photons is given by E=hν, where h is Planck's constant and ν is the frequency of the light.
2. Energy Equation: The energy of the incident photon can be expressed as:
E=Work Function+Kinetic Energy of ejected electrons
This can be rewritten as:
hν=ϕ+12mv2
where ϕ is the work function of the metal.
3. Stopping Potential: The stopping potential V can be derived from the energy conservation equation:
eV=12mv2
This implies that the stopping potential is related to the maximum kinetic energy of the emitted electrons.
4. Cut-off Voltage: The cut-off voltage V0 can be expressed as:
V0=heν−heν0
where ν0 is the threshold frequency. This shows that V0 depends on the frequency of the incident light, not on its intensity.
5. Effect of Intensity: The intensity of light affects the number of photons incident on the surface. A higher intensity (I1 > I2) means more photons are hitting the surface, which results in more emitted electrons and thus a higher photoelectric current i.
6. Current vs. Potential Difference: Since the stopping potential V is independent of intensity, both intensities will have the same cut-off voltage. However, the photoelectric current will be higher for the higher intensity (I1) than for the lower intensity (I2).
7. Analyzing the Graphs: Given the above understanding, we can analyze the provided curves:
- The correct graph should show that both intensities (I1 and I2) have the same cut-off voltage (V) but different currents (i), with the current for I1 being greater than that for I2.
8. Conclusion: Based on the analysis, the correct variation is shown in figure (b), where both curves intersect at the same potential difference but have different photoelectric currents.
E=Work Function+Kinetic Energy of ejected electrons
This can be rewritten as:
hν=ϕ+12mv2
where ϕ is the work function of the metal.
eV=12mv2
This implies that the stopping potential is related to the maximum kinetic energy of the emitted electrons.
V0=heν−heν0
where ν0 is the threshold frequency. This shows that V0 depends on the frequency of the incident light, not on its intensity.
- The correct graph should show that both intensities (I1 and I2) have the same cut-off voltage (V) but different currents (i), with the current for I1 being greater than that for I2.
Topper's Solved these Questions
- BOOK - CENGAGE PHYSICS ENGLISHCHAPTER - ELECTRON,PHONTS,PHOTOELECTRIC EFFECT & X-RAYSEXERCISE - dpp 3.315videos
ELECTRON,PHONTS,PHOTOELECTRIC EFFECT & X-RAYS
- BOOK - CENGAGE PHYSICS ENGLISHCHAPTER - ELECTRON,PHONTS,PHOTOELECTRIC EFFECT & X-RAYSEXERCISE - multiple correct1videos
ELECTRON,PHONTS,PHOTOELECTRIC EFFECT & X-RAYS
- BOOK - CENGAGE PHYSICS ENGLISHCHAPTER - ELECTROMAGNETIC INDUCTIONEXERCISE - compression type7videos
ELECTROMAGNETIC INDUCTION
- BOOK - CENGAGE PHYSICS ENGLISHCHAPTER - GEOMETRICAL OPTICSEXERCISE - Integer Type4videos
GEOMETRICAL OPTICS
Similar Questions
(i) Find the potential difference between A and B.
 View Solution
For a metallic wire, the ratio Vi ( V= applied potential difference and i= current flowing ) is
View SolutionDraw a graph of potential difference (V) versus current (I) for an ohmic resistor.
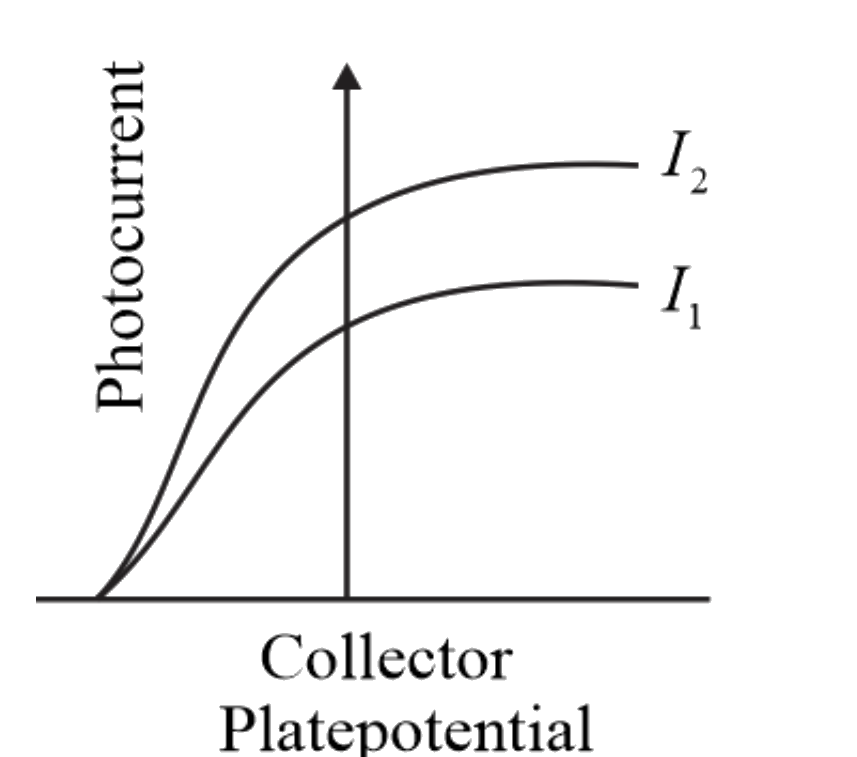
View SolutionFrom the following graph of photocurrent against collector plate potential for two different intensities of light I1andI2 one can , conclude
 View Solution
How are the potential difference (V), current (I) and resistance (R) related ?
View SolutionDraw a graph of Potential difference (V) versus Current (I) for an ohmic resistor.
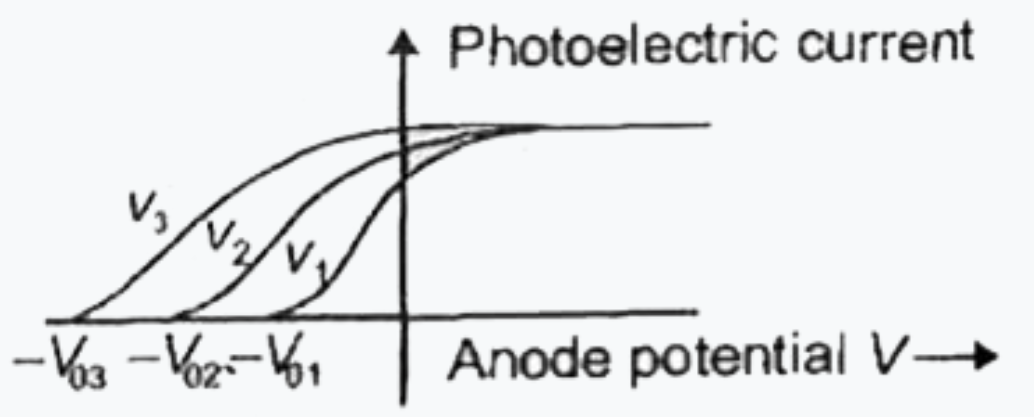
View SolutionIn photoelectric effect , the curve between photoelectric current and anode potential V (for different frequencies ) is shown in figure , then
 View Solution
The variation between V-I has shown by graph for heating filament
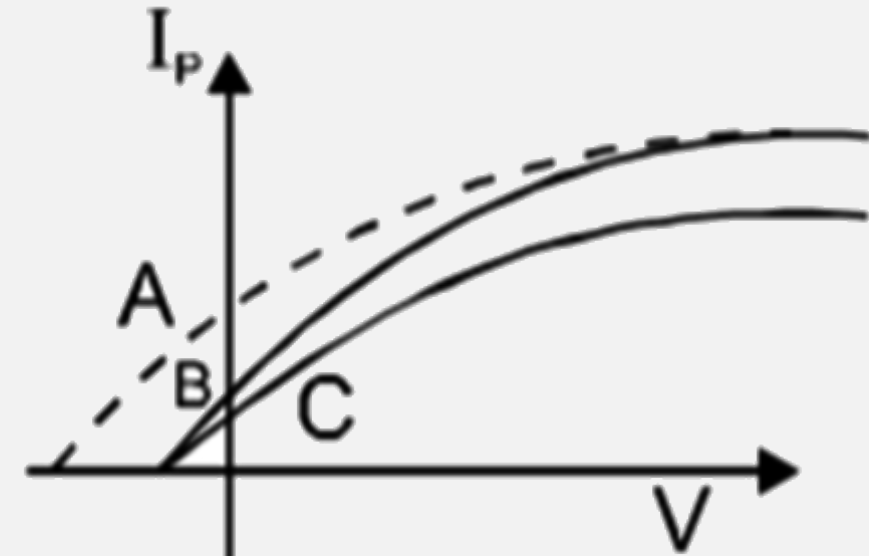
View SolutionThe graph shows the variation of photocurrent with the applied voltage in a photoelectric effect experiment for three different beams of light falling on identical metal surfaces, then which among the following is correct ?
 View Solution
Give, potential difference V = (8 + 0.5) V and current I = (2 + 0.2) A. The value of resistance R is
View Solution

