The given (p - U) graph shows the variation of internal energy of an ideal gas with increase in pressure. Which of the following pressure - volume graph is equivalent to this graph ?
 .
.
(a)
(##DCP_V03_C20_E01_106_Q01##).
(b)
(##DCP_V03_C20_E01_106_Q01##).
( c)
(##DCP_V03_C20_E01_106_Q01##).
(d)
(##DCP_V03_C20_E01_106_Q01##).
The correct Answer is:B
U∝T
According to given graph,
p∝V
∴p∝T
Hence, V= constant.
Topper's Solved these Questions
- THERMOMETRY,THERMAL EXPANSION & KINETIC THEORY OF GASESBOOK - DC PANDEY ENGLISHCHAPTER - THERMOMETRY,THERMAL EXPANSION & KINETIC THEORY OF GASESEXERCISE - Level 2 More Than One Correct
7 Videos
- THERMOMETRY,THERMAL EXPANSION & KINETIC THEORY OF GASESBOOK - DC PANDEY ENGLISHCHAPTER - THERMOMETRY,THERMAL EXPANSION & KINETIC THEORY OF GASESEXERCISE - Level 2 Subjective
9 Videos
- THERMOMETRY,THERMAL EXPANSION & KINETIC THEORY OF GASESBOOK - DC PANDEY ENGLISHCHAPTER - THERMOMETRY,THERMAL EXPANSION & KINETIC THEORY OF GASESEXERCISE - Level 1 Subjective
48 Videos
- THERMOMETRY THERMAL EXPANSION AND KINETIC THEORY OF GASESBOOK - DC PANDEY ENGLISHCHAPTER - THERMOMETRY THERMAL EXPANSION AND KINETIC THEORY OF GASESEXERCISE - Medical entrance gallary
30 Videos
- UNIT AND DIMENSIONSBOOK - DC PANDEY ENGLISHCHAPTER - UNIT AND DIMENSIONSEXERCISE - Assertion And Reason
2 Videos
Similar Questions
Knowledge Check
Which of the following graphs represent the behaviour of an ideal gas ?
A1.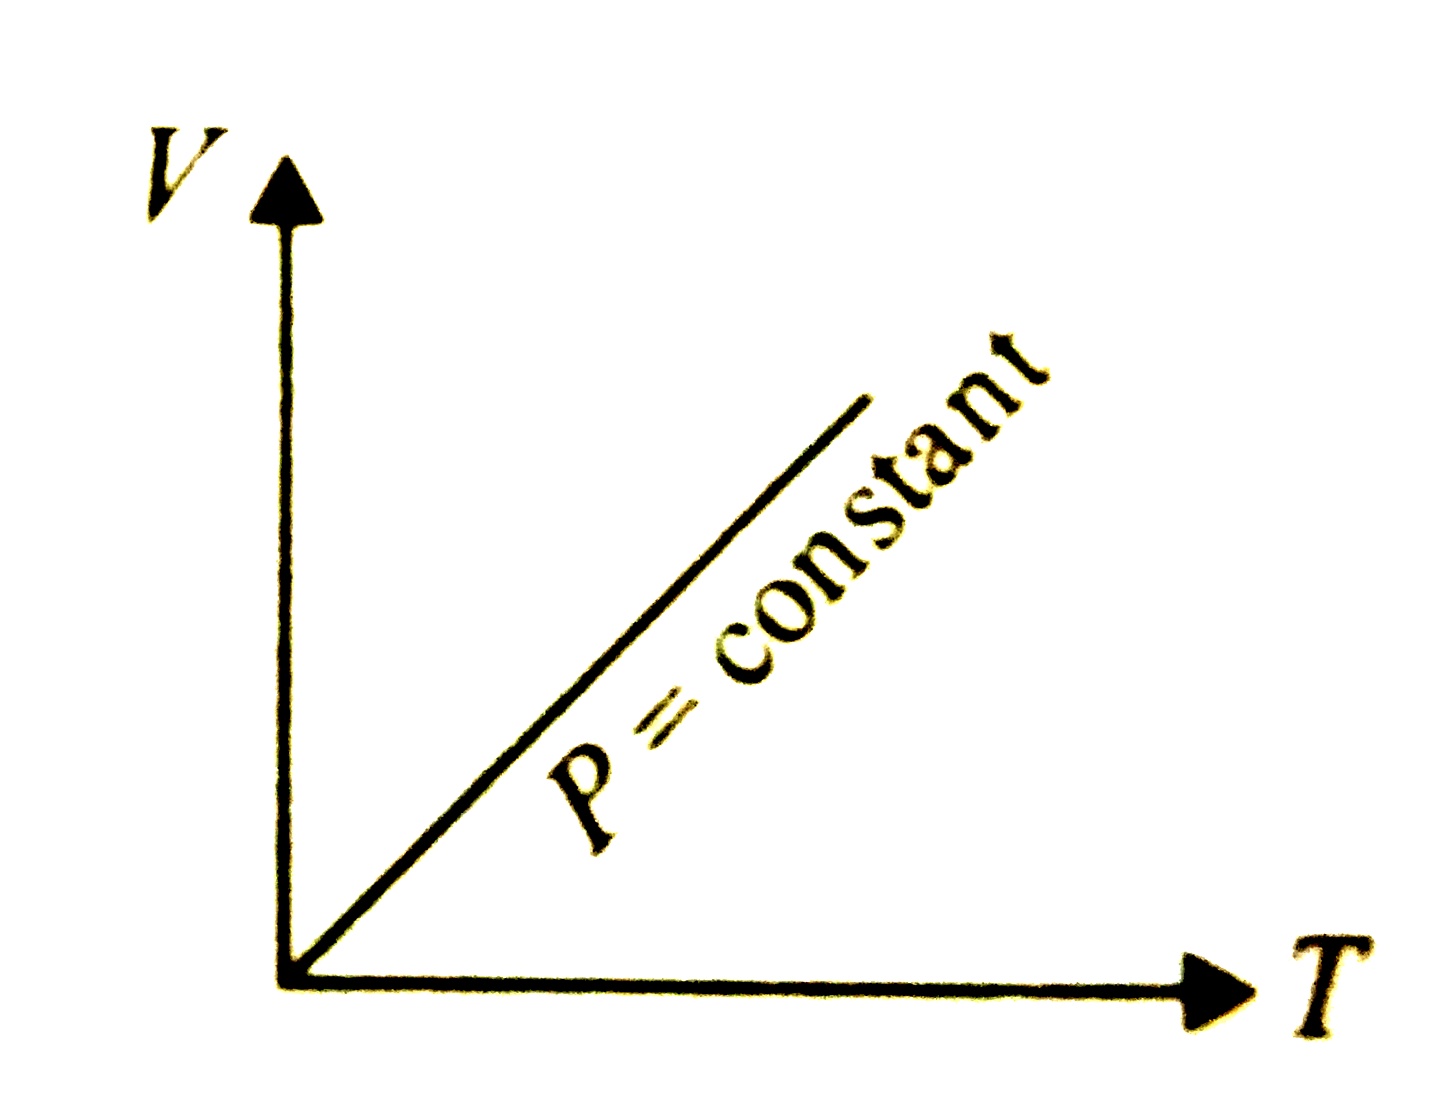 B2.
B2.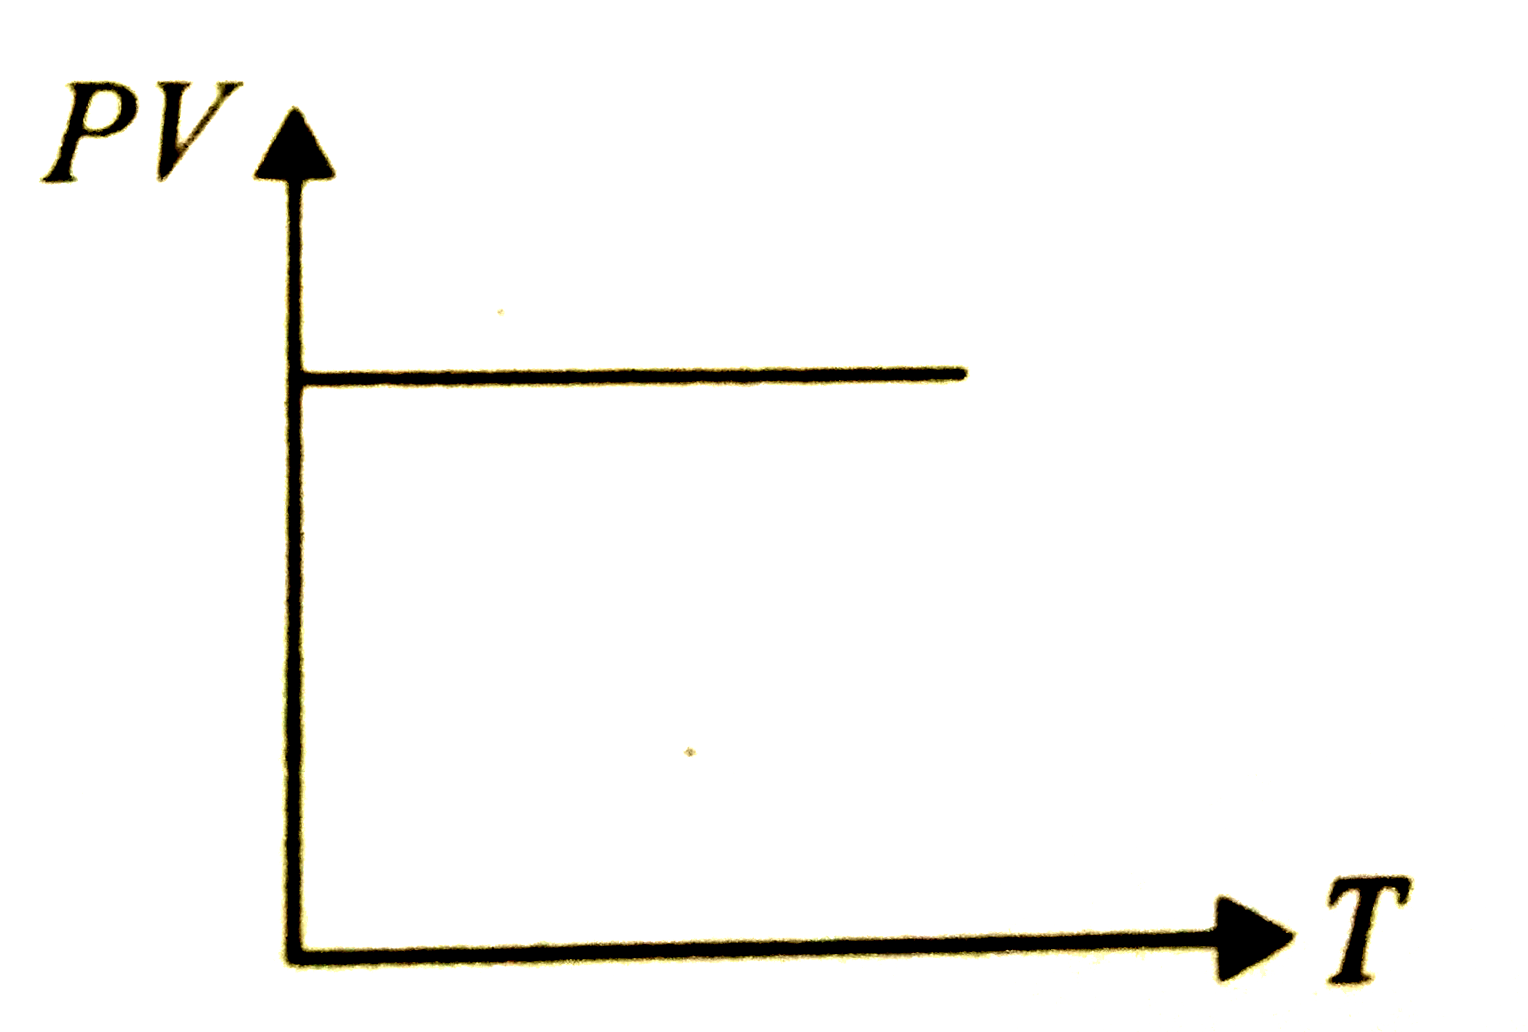 C3.
C3.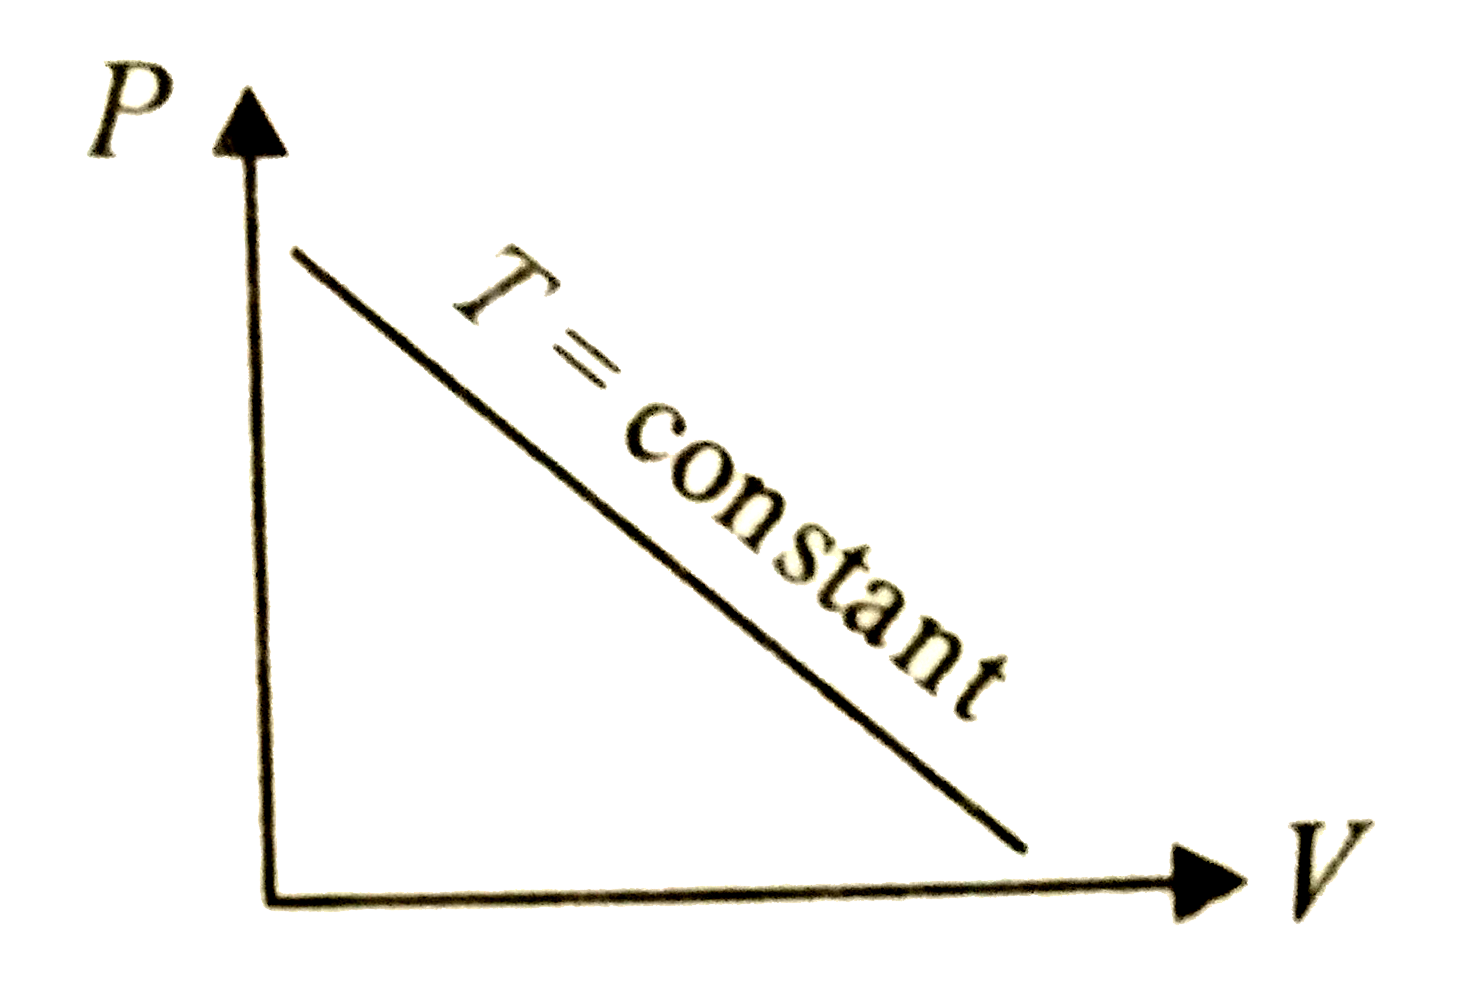 D4.
D4.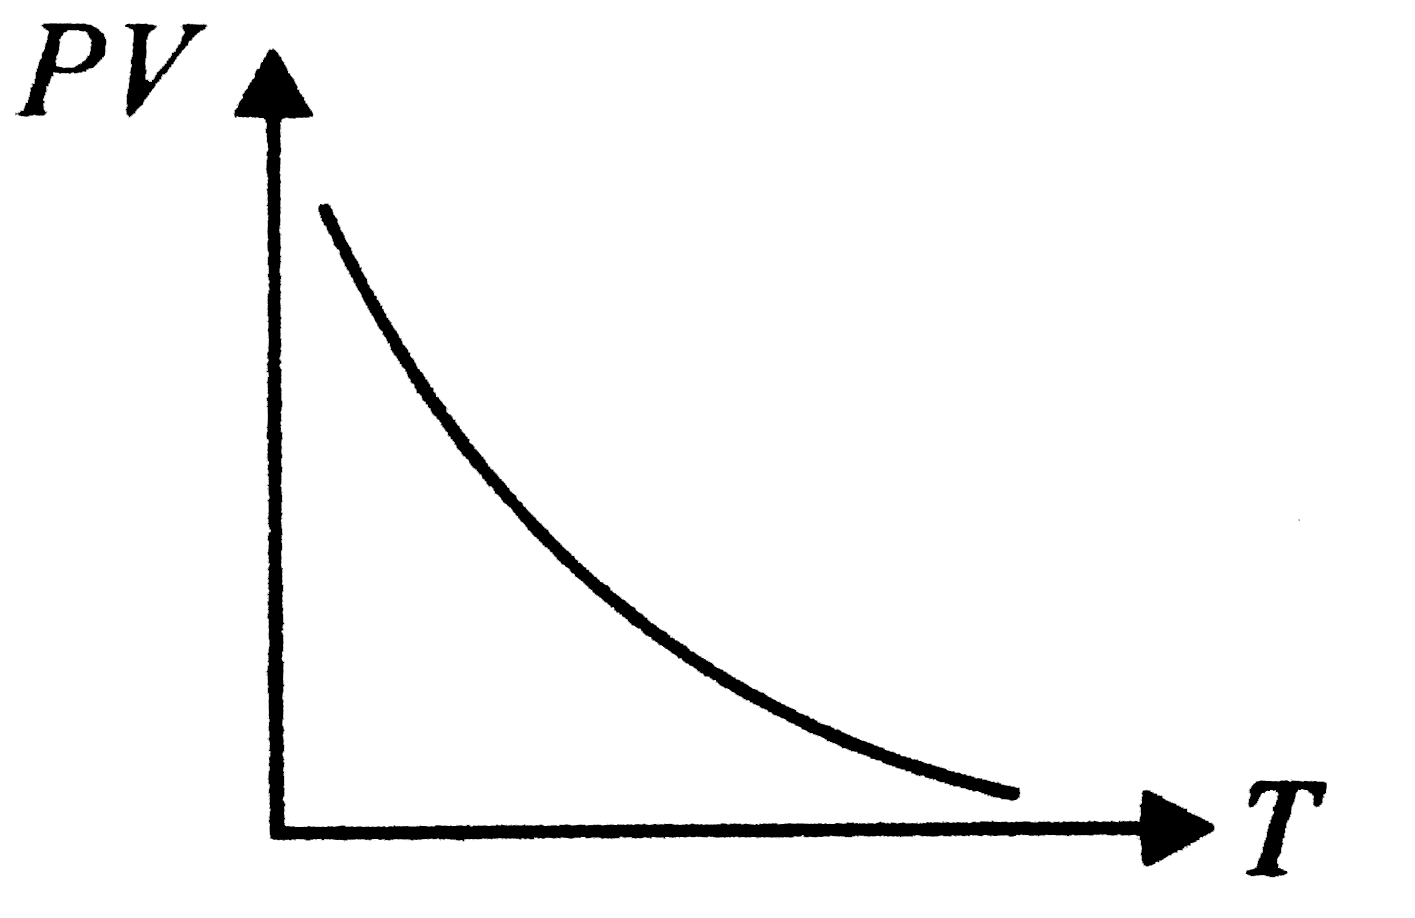
A student plotted the following four graphs representing the variation of velocity of sound in a gas with the pressure P. Whic one is correct?
A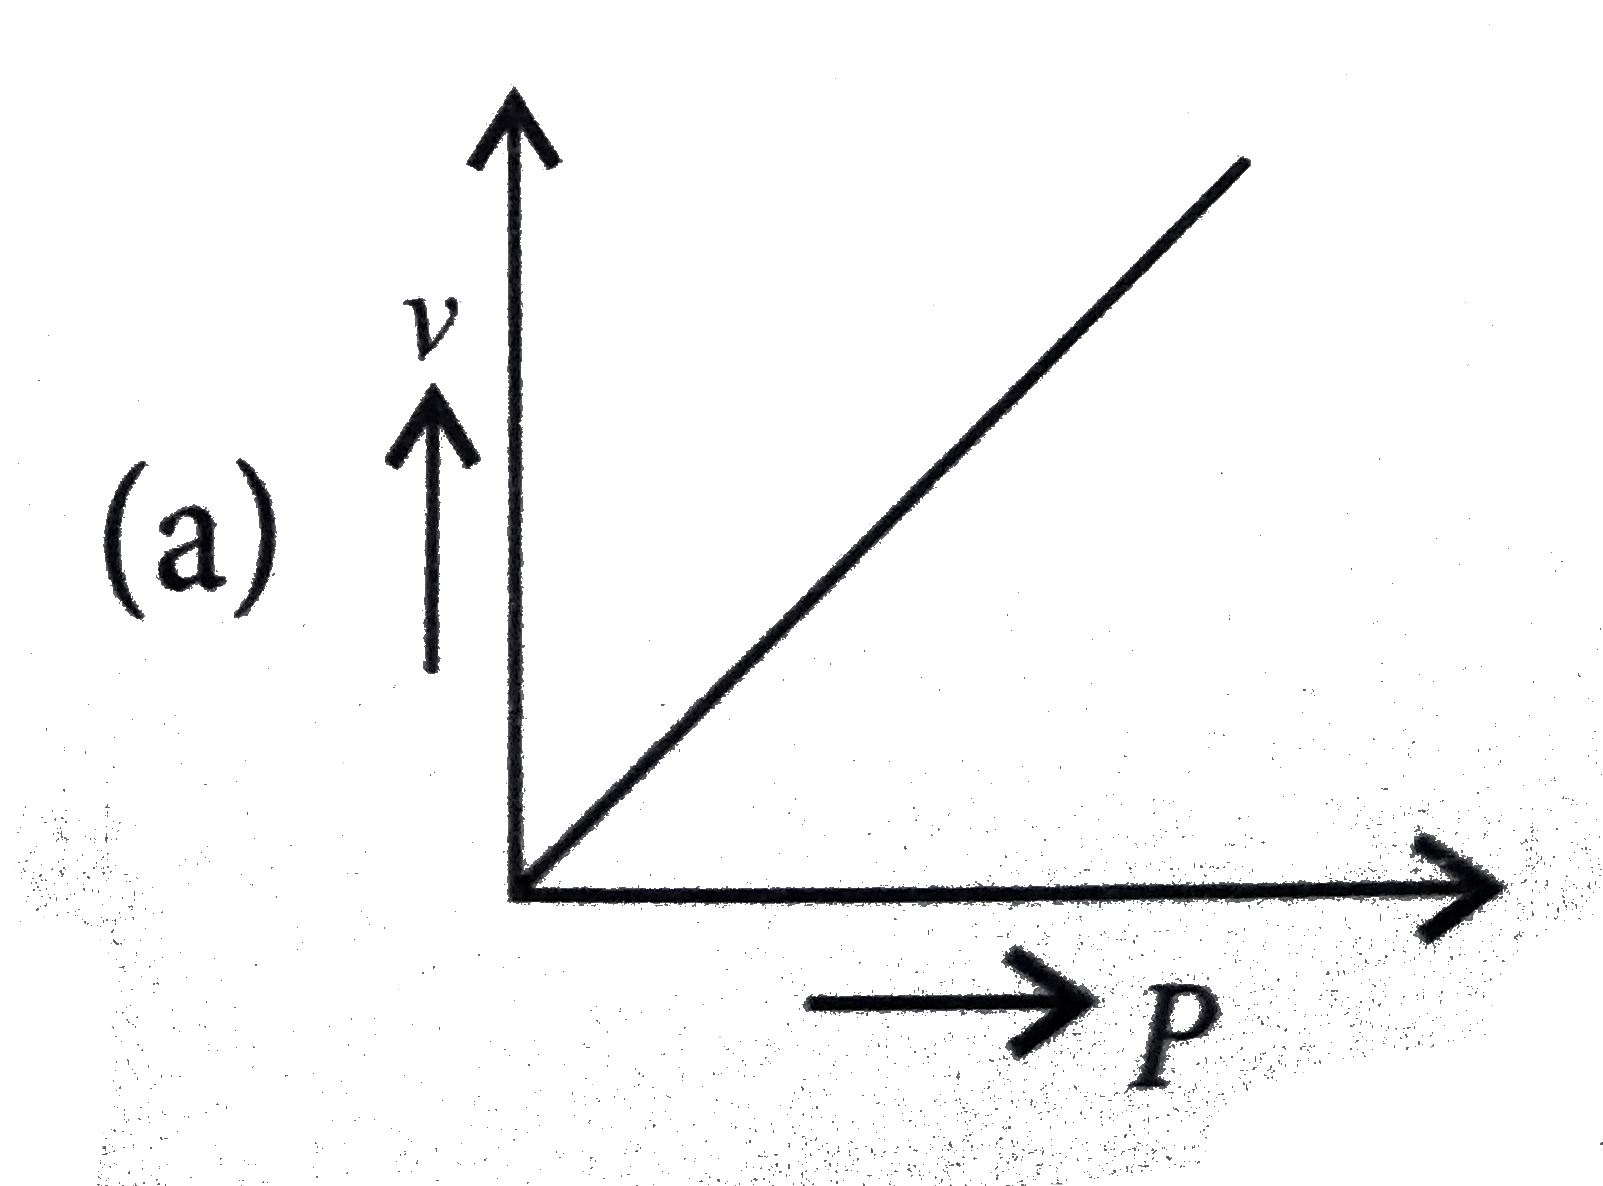 B
B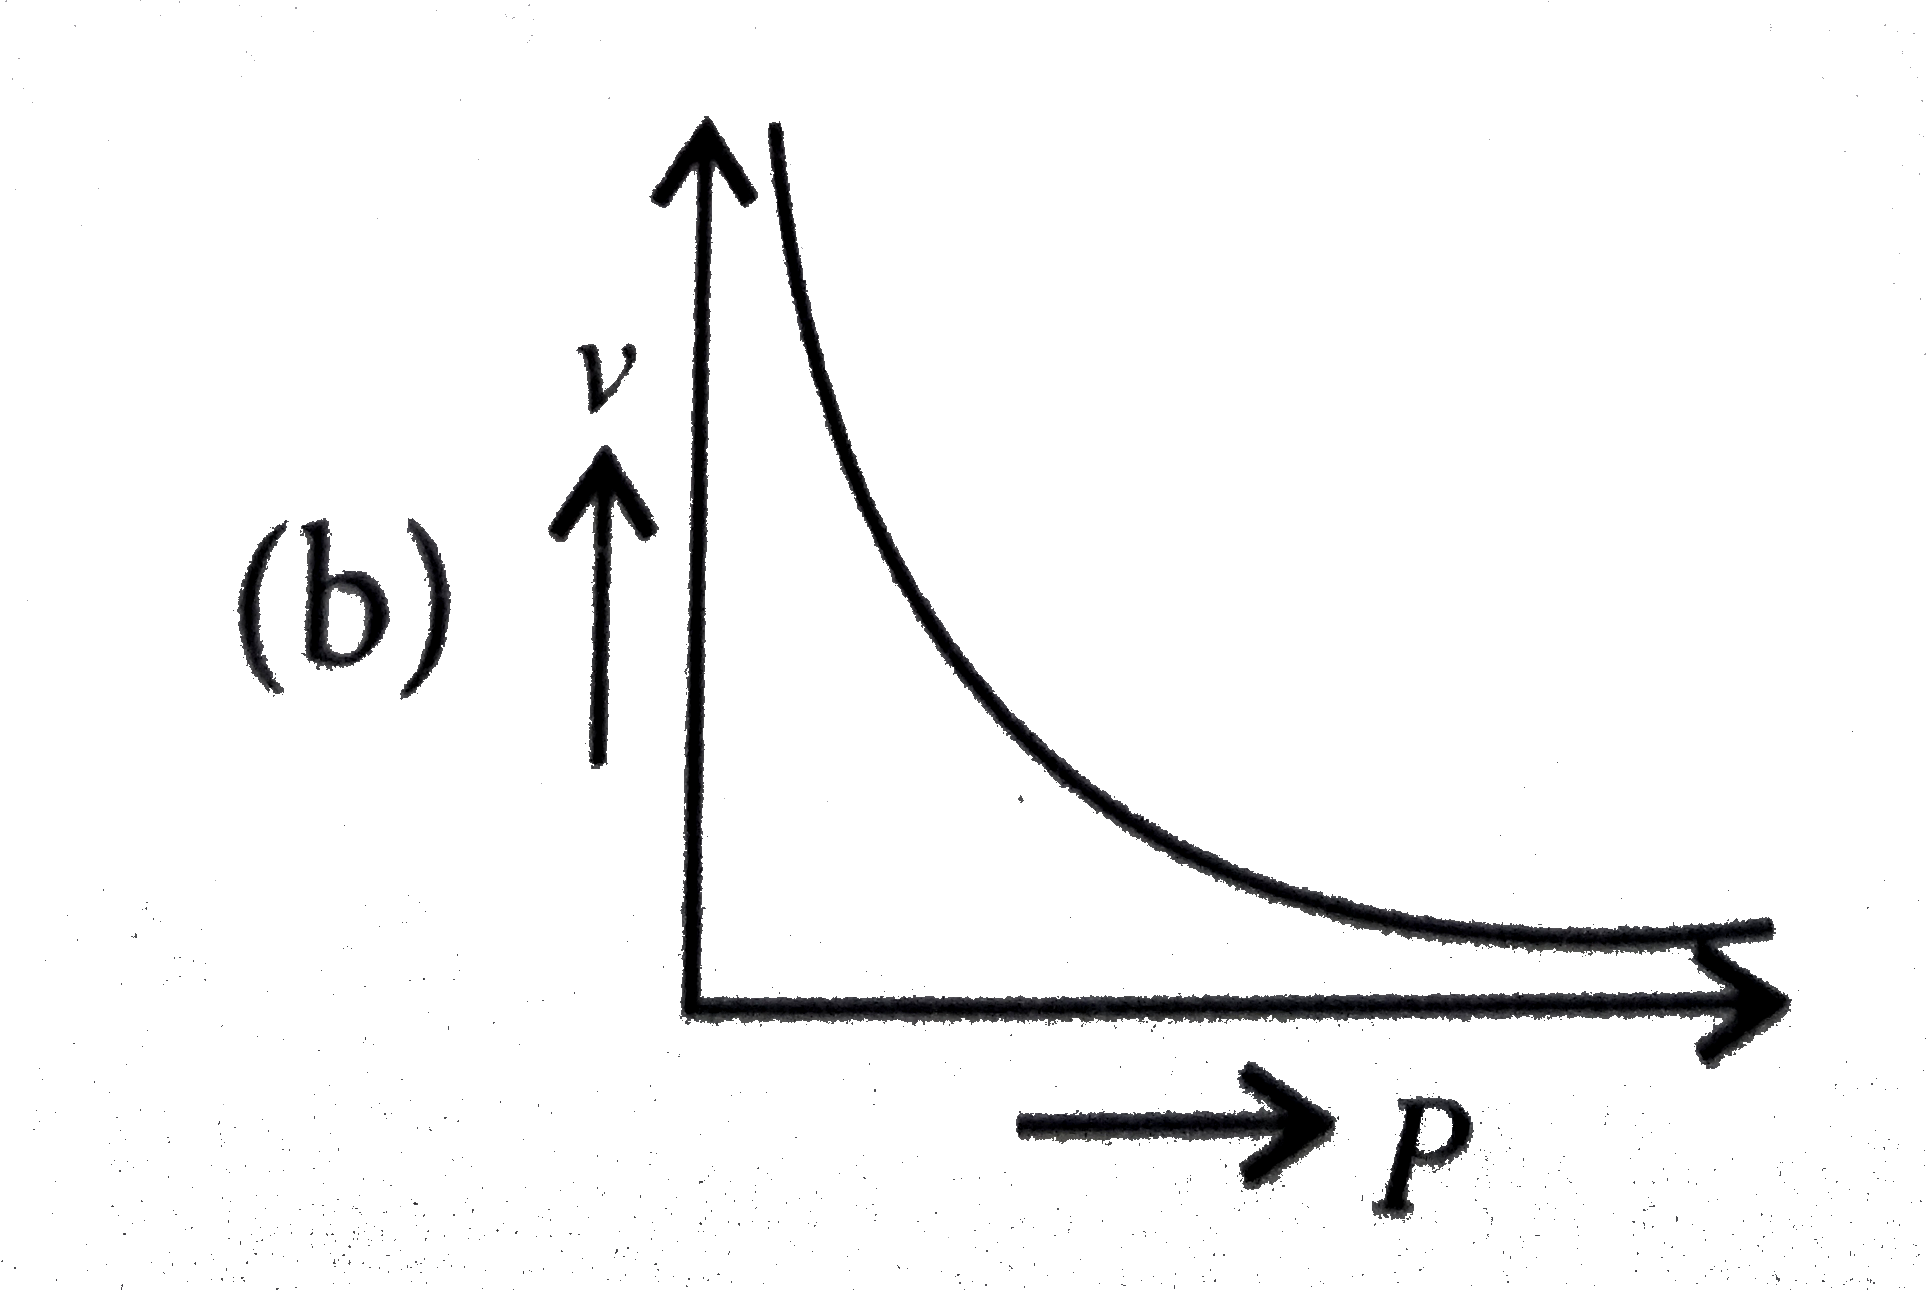 C
C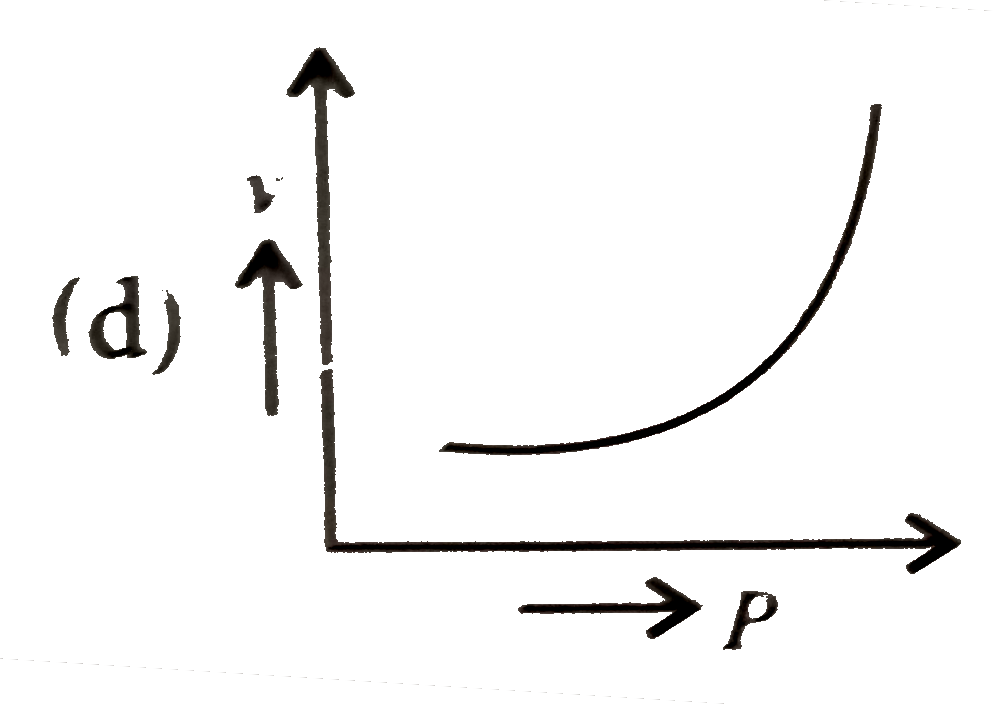 D
D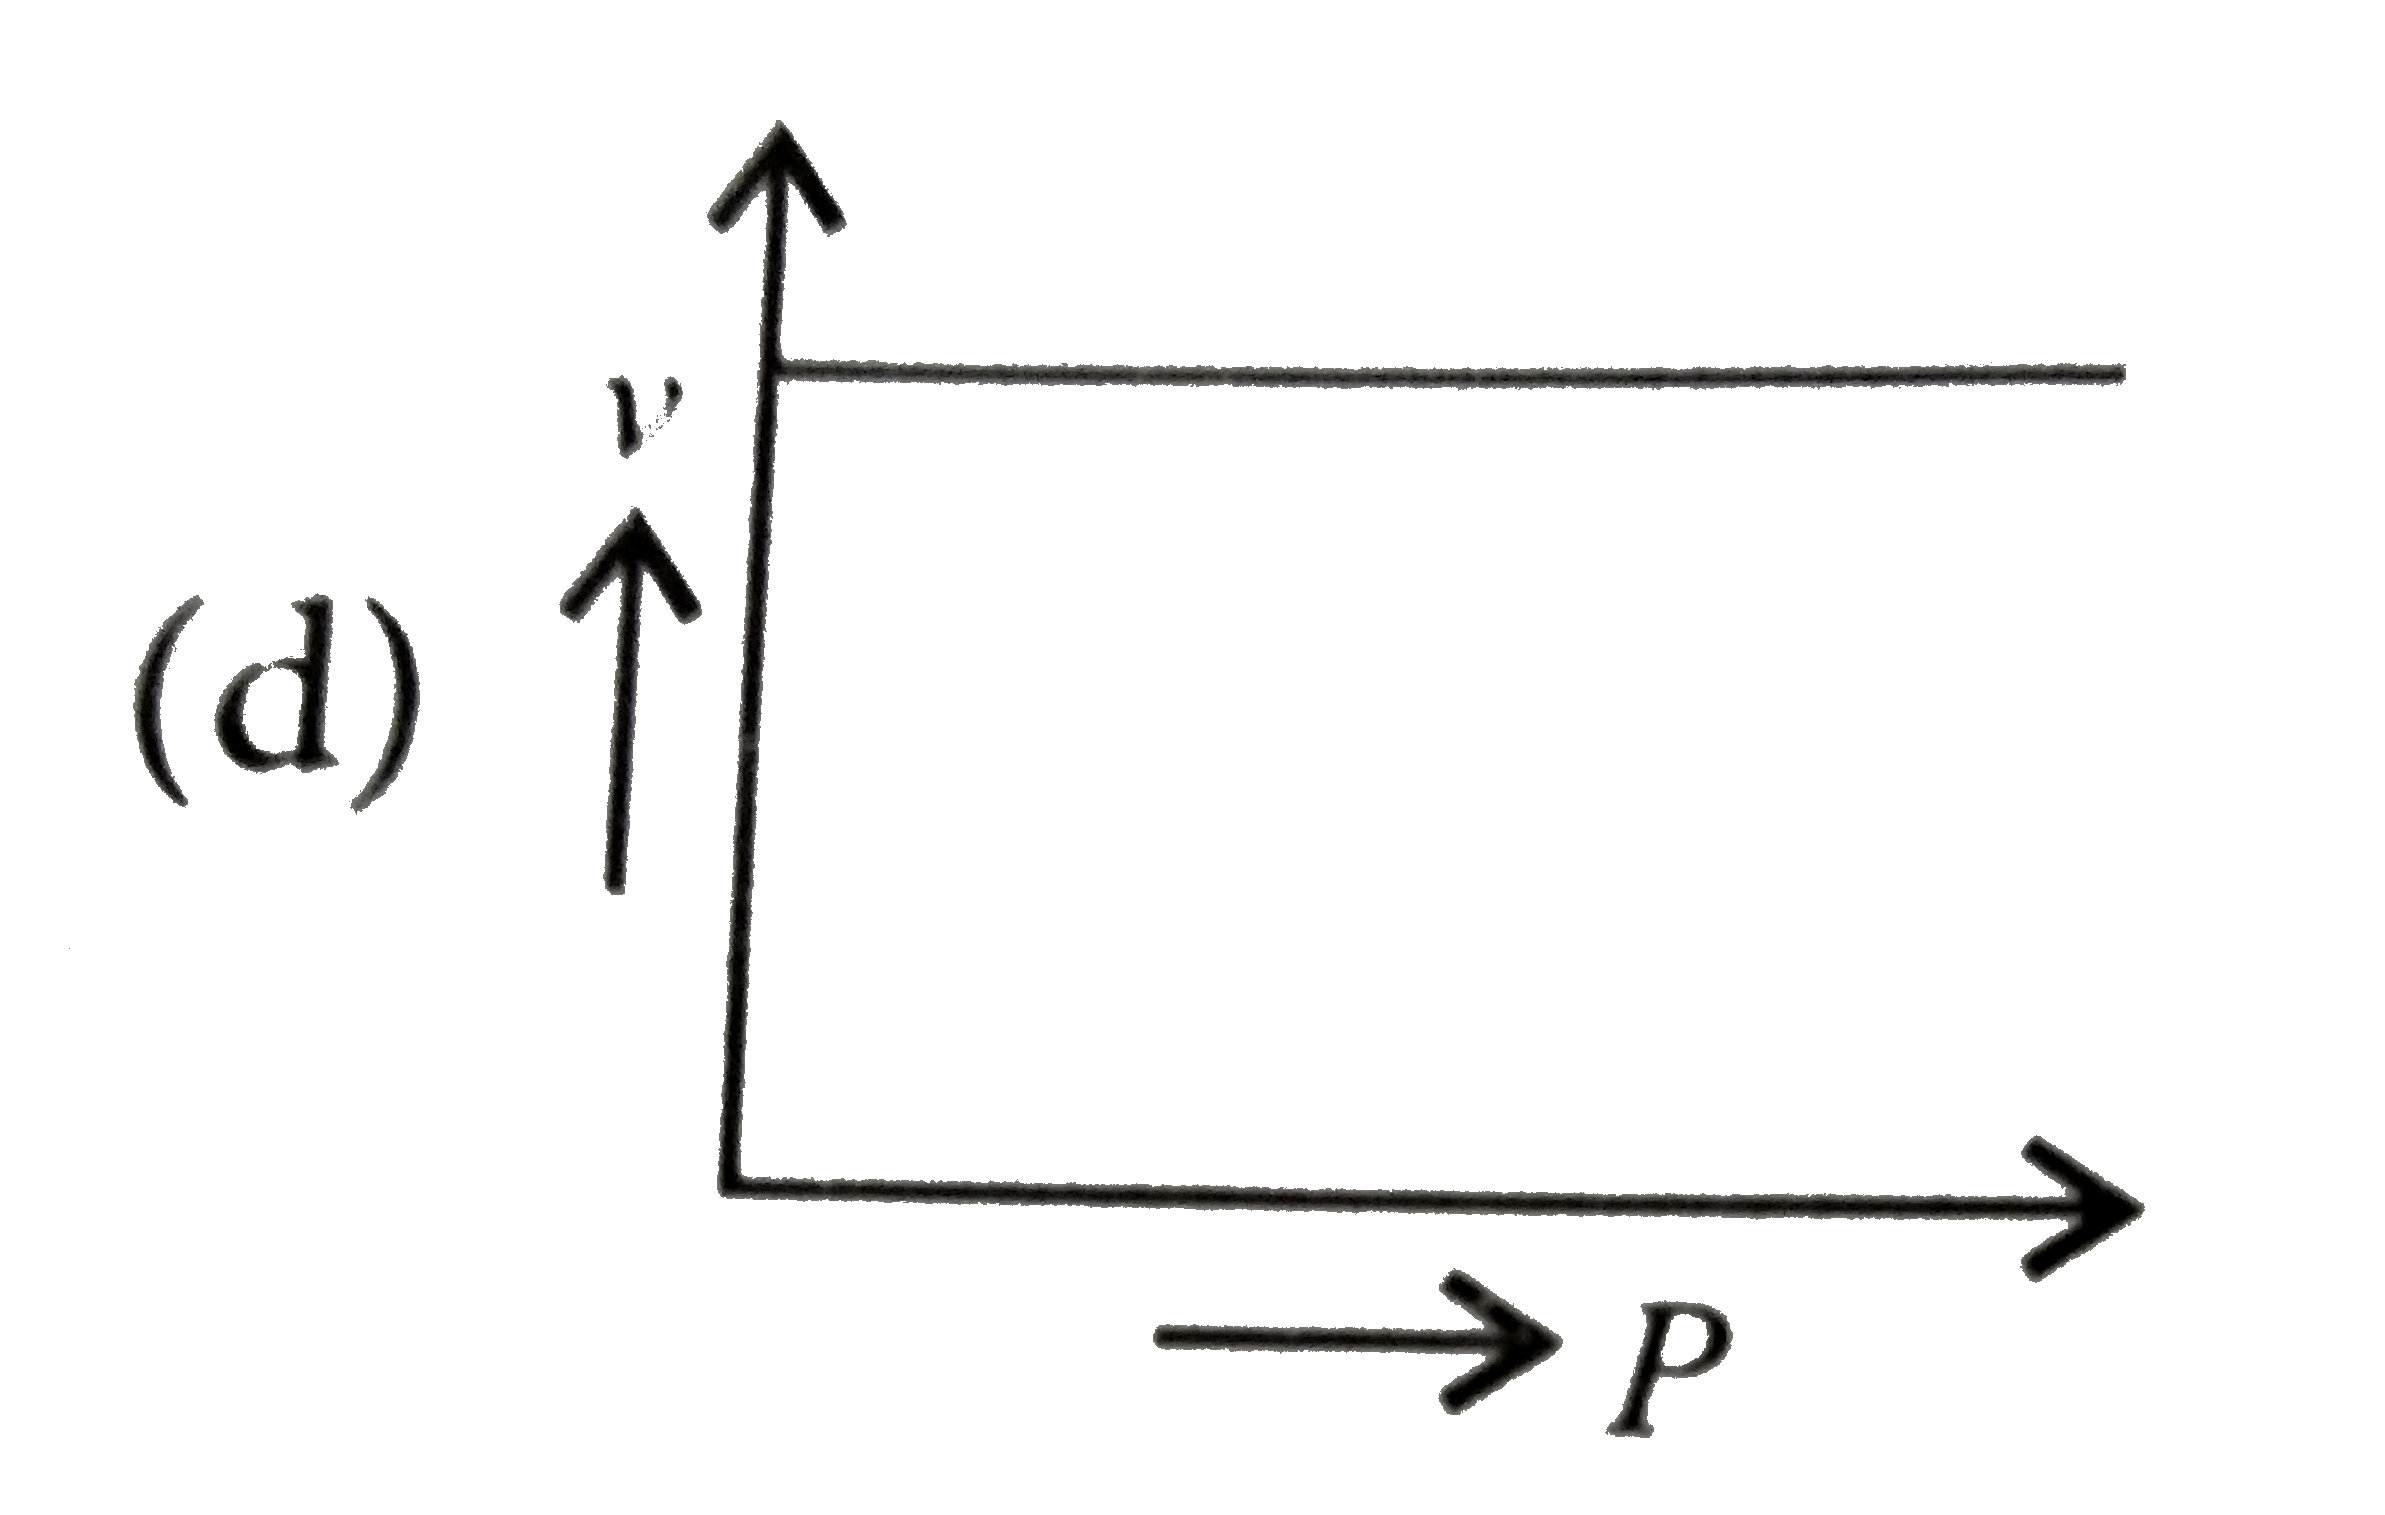
Which of the following graph is incorrect for an ideal gas?

View SolutionFor a fixed mass of gas and constant pressure, which of the following graphs is / are correct?

View SolutionWhich of the following graphs is consistent with ideal gas behaviour?
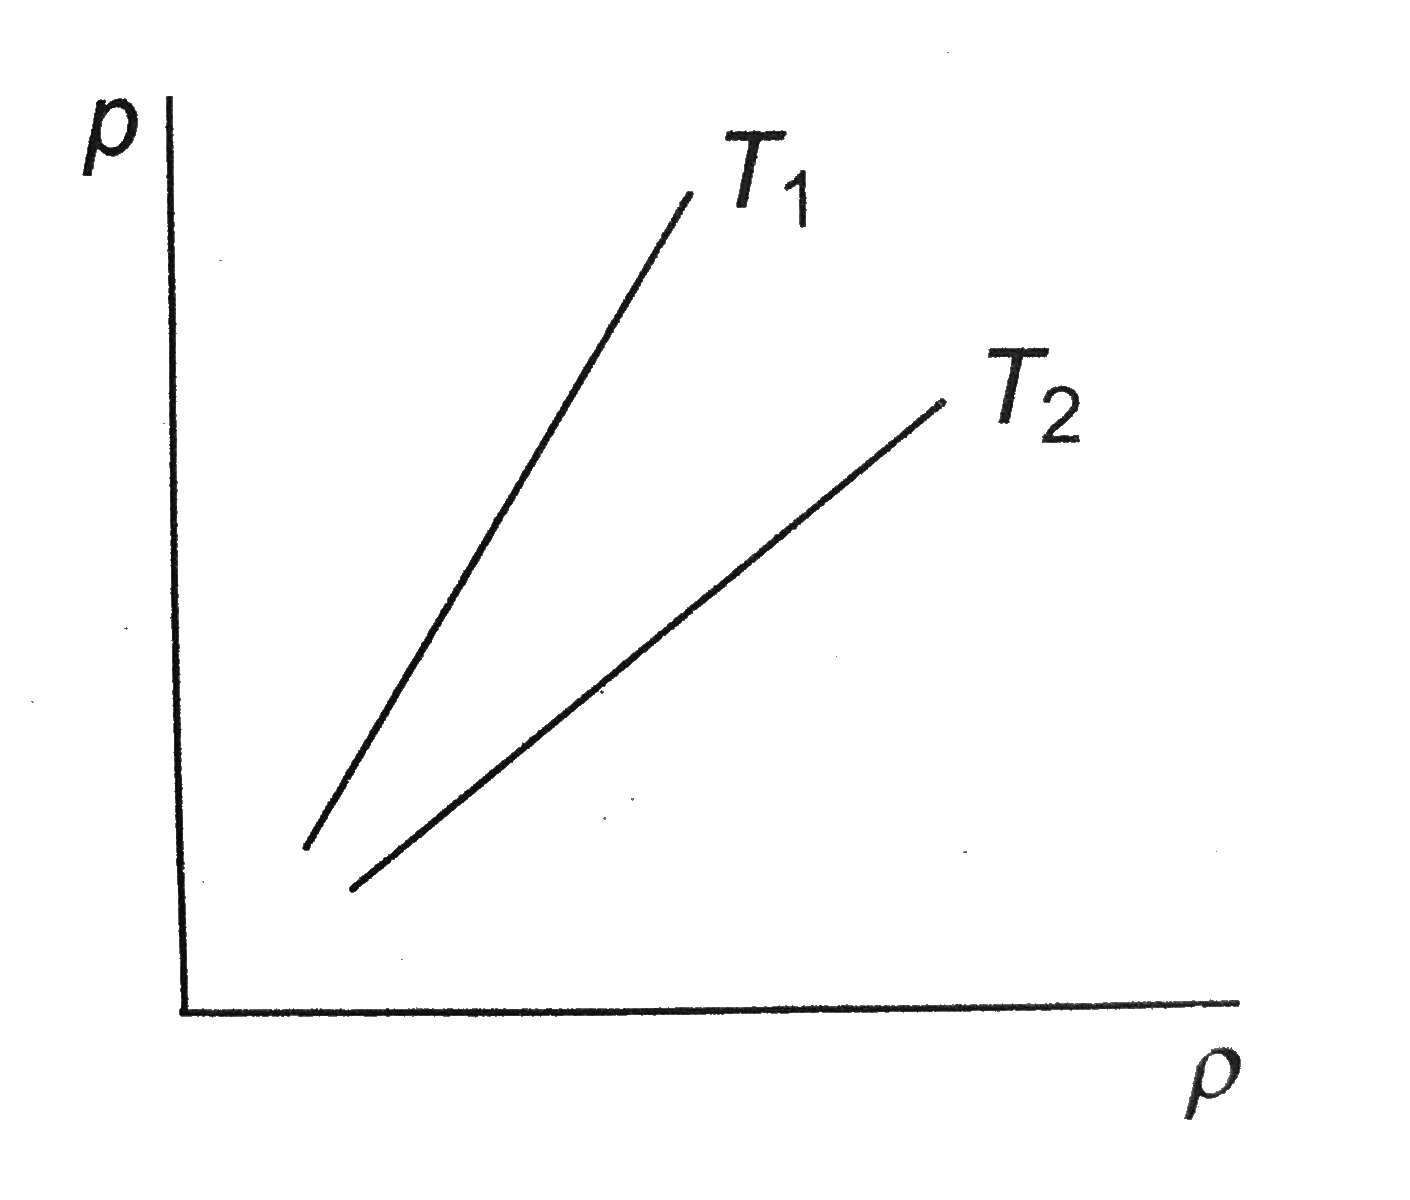
View SolutionFigure shows graphs of pressure vs density for an ideal gas at two temperature T1andT2. Which of the following is correct?
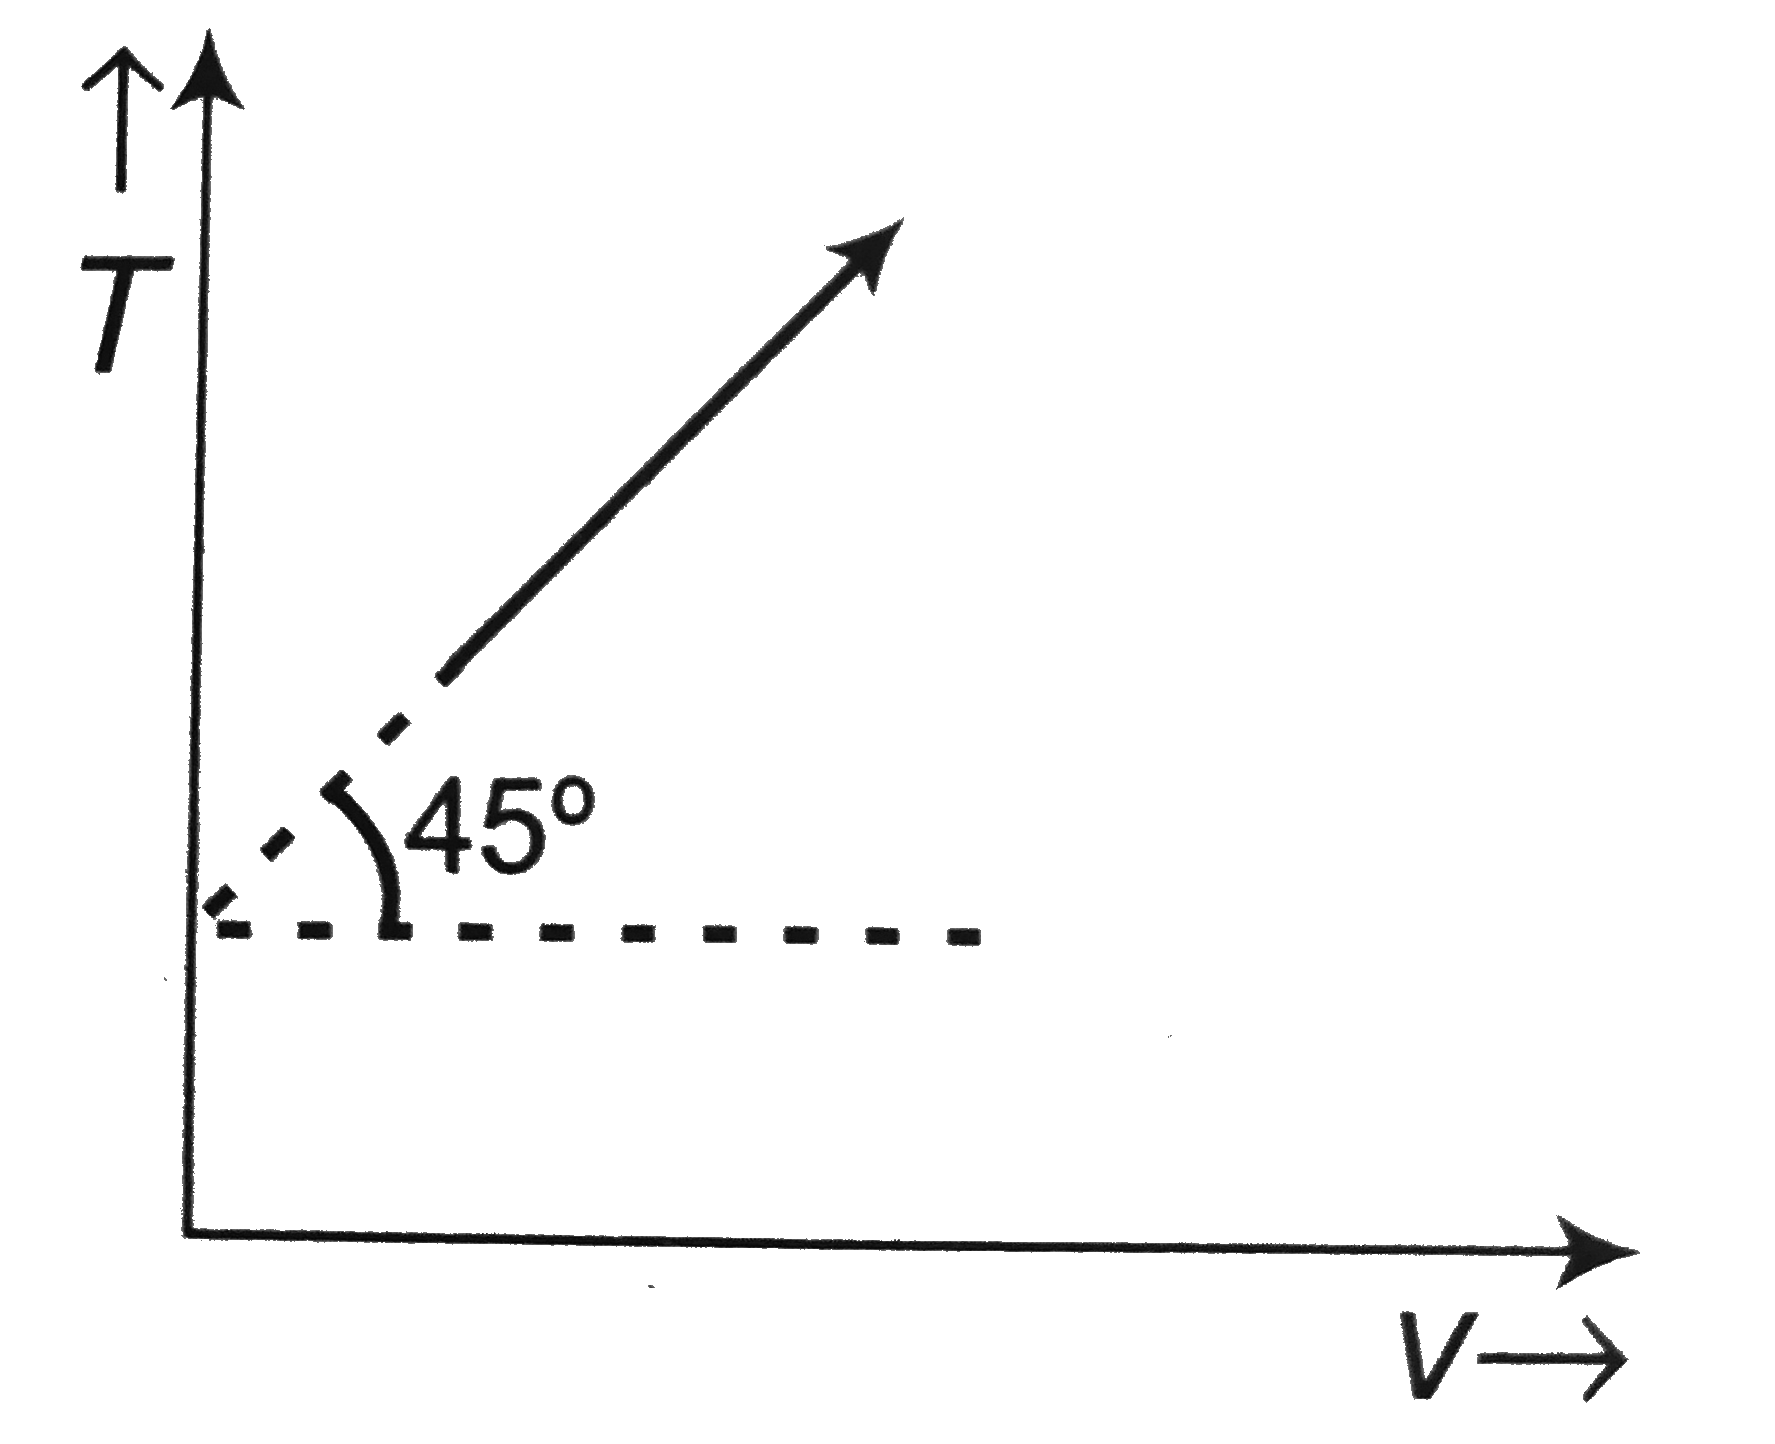
View SolutionThe given curve represents the variation of temperature as a function of volume for one mole of an ideal gas. Which of the following curves best represents the variation of pressure as a function of volume?
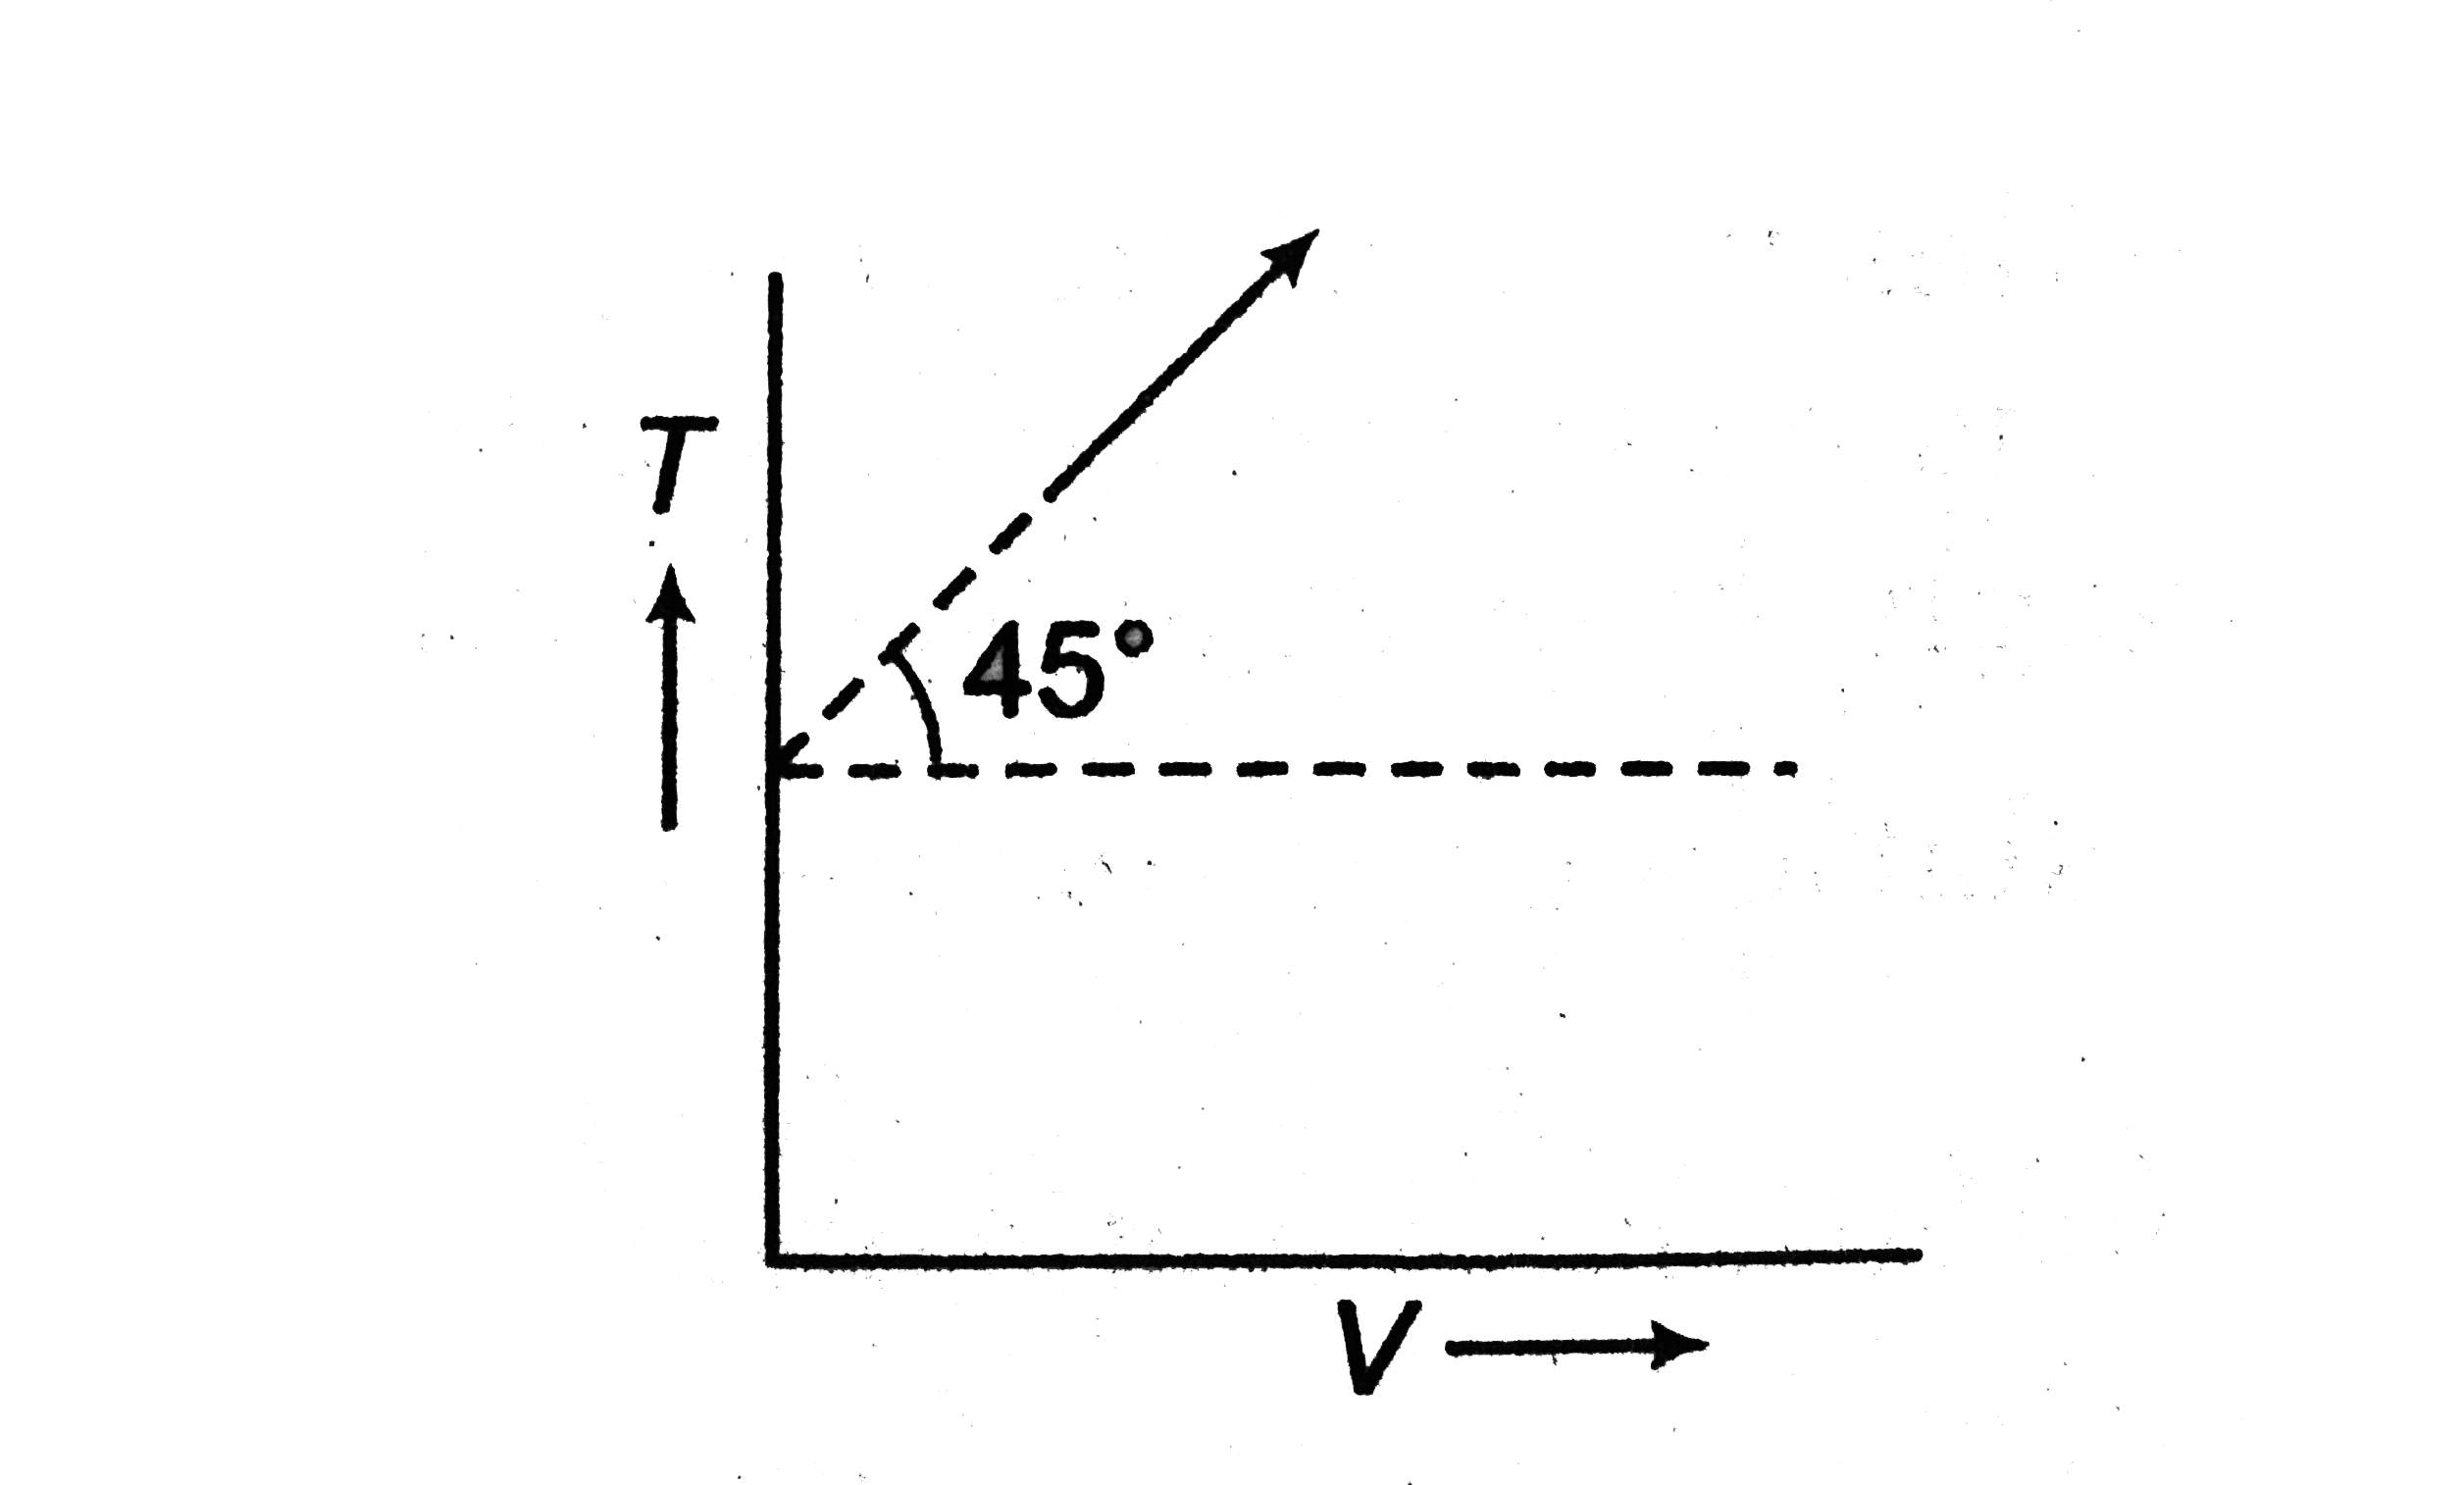
View SolutionThe given curve represents the variation of temperatue as a function of volume for one mole of an ideal gas. Which of the following curves best represents the variation of pressure as a function of volume ?
 .
.
View Solution
