The graph between 1v and 1u for a concave mirror looks like.
a) 
b) 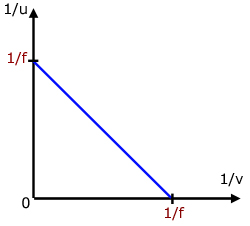
c) 
d) None of the options
The correct Answer is:B
To determine the graph between 1v and 1u for a concave mirror, we can follow these steps:
1. Understand the Mirror Formula:
The mirror formula for a concave mirror is given by:
1f=1v+1u
where f is the focal length, v is the image distance, and u is the object distance.
2. Rearrange the Formula:
We need to rearrange this equation to express 1v in terms of 1u:
1v=−1u+1f
3. Identify the Form of the Equation:
The equation 1v=−1u+1f can be compared to the slope-intercept form of a straight line, y=mx+c:
- Here, y=1v
- x=1u
- The slope m=−1 (indicating a negative slope)
- The y-intercept c=1f
4. Graph Characteristics:
Since the slope is negative, the graph will be a straight line that decreases as 1u increases. The line will intersect the y-axis at 1f.
5. Analyze the Options:
Given the options, we need to identify which graph corresponds to a straight line with a negative slope and a y-intercept at 1f.
6. Conclusion:
After analyzing the options, we find that the correct graph is the one that shows a straight line with a negative slope and an intercept at 1f. Therefore, the correct answer is option B.
The mirror formula for a concave mirror is given by:
1f=1v+1u
where f is the focal length, v is the image distance, and u is the object distance.
We need to rearrange this equation to express 1v in terms of 1u:
1v=−1u+1f
The equation 1v=−1u+1f can be compared to the slope-intercept form of a straight line, y=mx+c:
- Here, y=1v
- x=1u
- The slope m=−1 (indicating a negative slope)
- The y-intercept c=1f
Since the slope is negative, the graph will be a straight line that decreases as 1u increases. The line will intersect the y-axis at 1f.
Given the options, we need to identify which graph corresponds to a straight line with a negative slope and a y-intercept at 1f.
After analyzing the options, we find that the correct graph is the one that shows a straight line with a negative slope and an intercept at 1f. Therefore, the correct answer is option B.
Topper's Solved these Questions
- EXPERIMENTSBook:DC PANDEY ENGLISHChapter:EXPERIMENTSExercise:Subjective
Explore 15 Videos
- EXPERIMENTSBook:DC PANDEY ENGLISHChapter:EXPERIMENTSExercise:Exercise 3.8
Explore 3 Videos
- ELECTROSTATICSBook:DC PANDEY ENGLISHChapter:ELECTROSTATICSExercise:Integer
Explore 17 Videos
- FLUID MECHANICSBook:DC PANDEY ENGLISHChapter:FLUID MECHANICSExercise:Medical entranes gallery
Explore 49 Videos
Similar Questions
Knowledge Check
In an experiment to find focal length of a concave mirror, a graph is drawn between the magnitudes of (u) and (v). The graph looks like.
A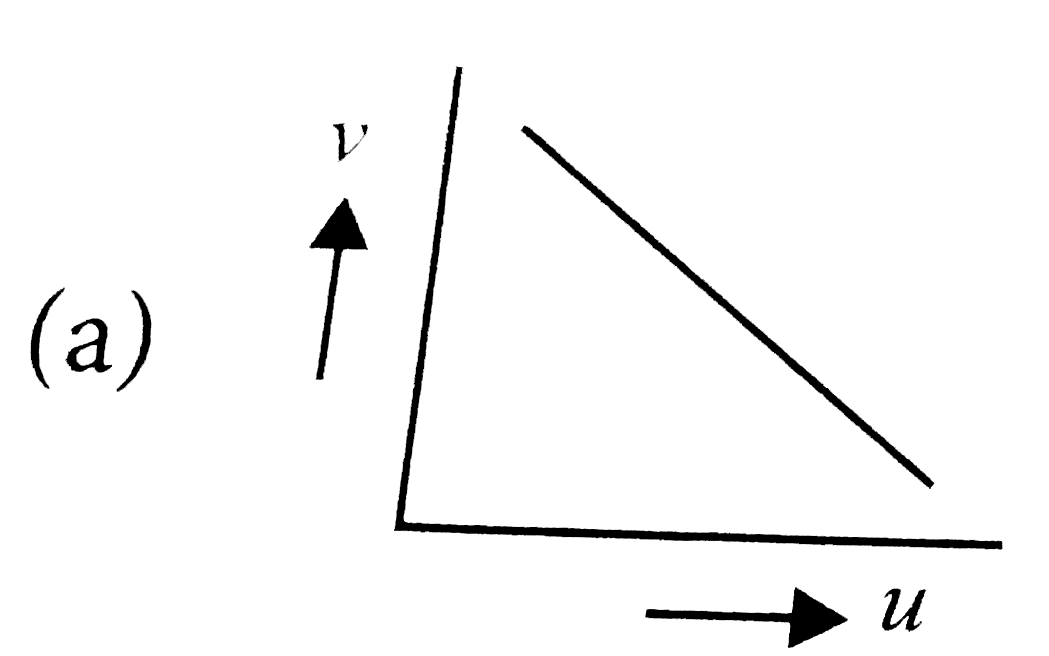 B
B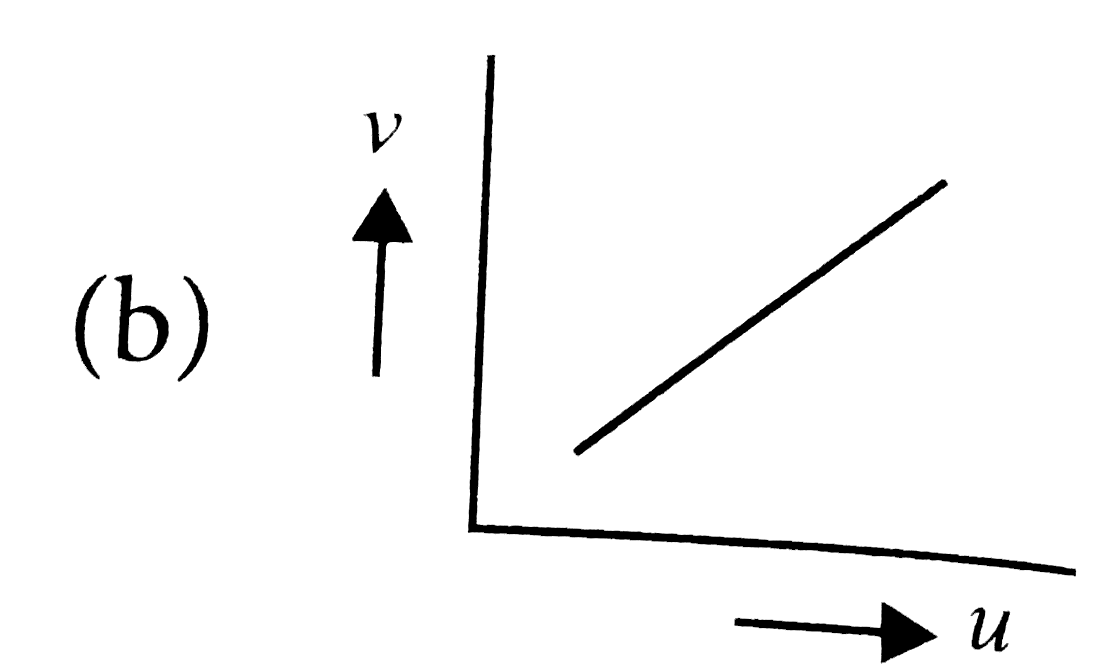 C
C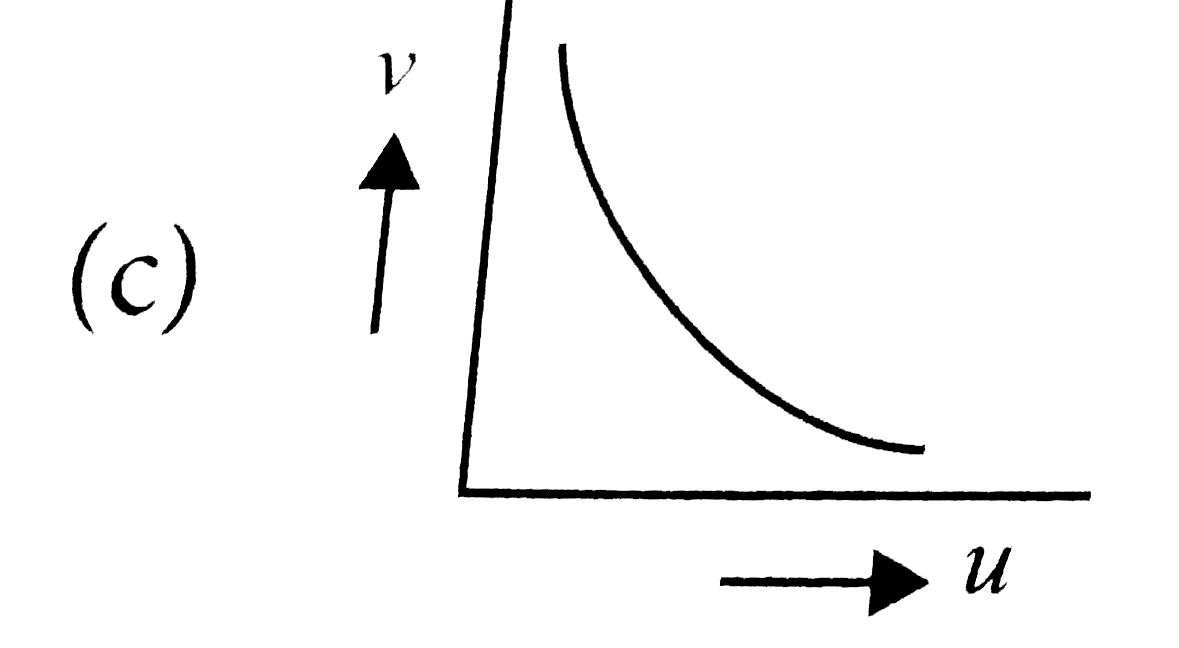 D
D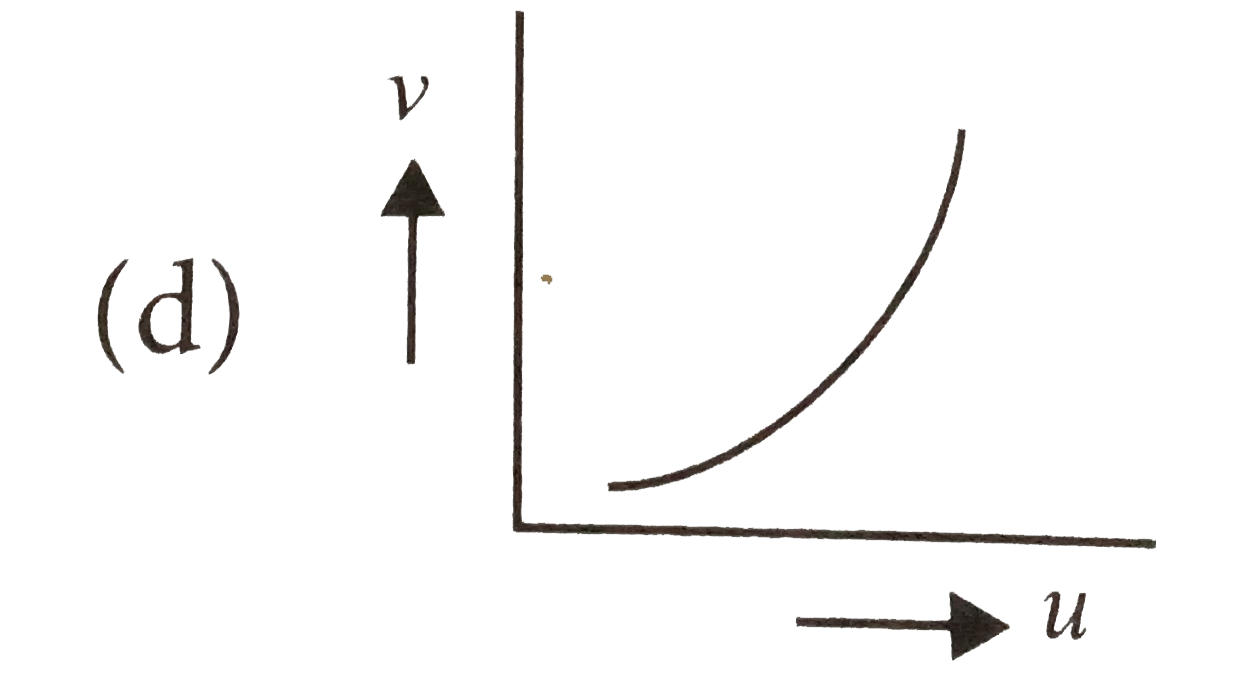
The graph betwene P and V at constant temperature should look like
View SolutionWhat is the type of graph between log P and log(1V) at constant temperature for a given amount of gas ?
View SolutionIn an experiment to find focal length of a concave mirror, a graph is drawn between the magnitudes of (u) and (v). The graph looks like.
View SolutionA student measures the focal length of a convex lens by putting an object pin at a distance u from the lens and measuring the distance v of the image pin. The graph between u and v plotted by the student should look like
View SolutionBy Plotting 1v verus 1u focal length of a convex mirror can be found .
View SolutionAn object is placed between a plane mirror and a concave mirror of focal length 15 cm as shown in Figure . Find the position of the images after two reflections.
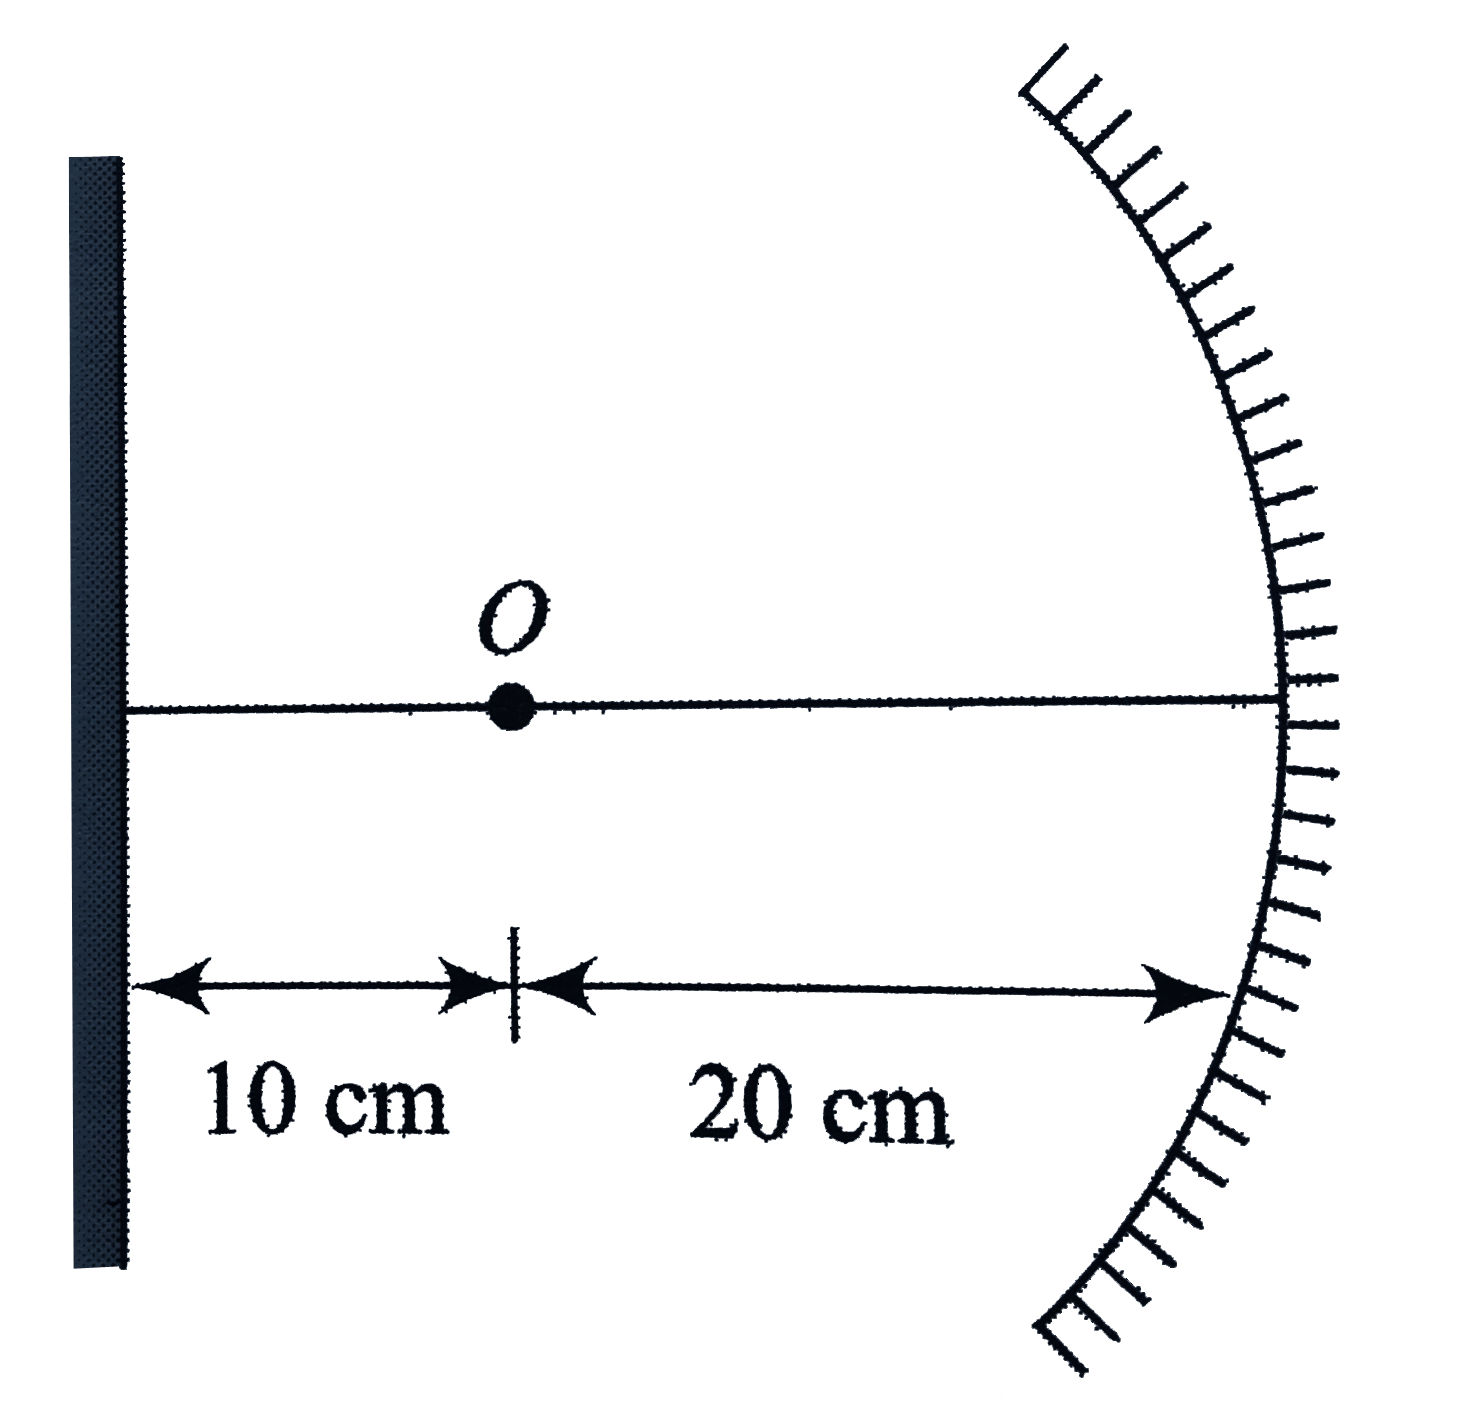
View SolutionFor sperical mirros graph plotted between −1V and −1uis .
View Solution