The graph between the (velocity)2 and temperature T of a gas is
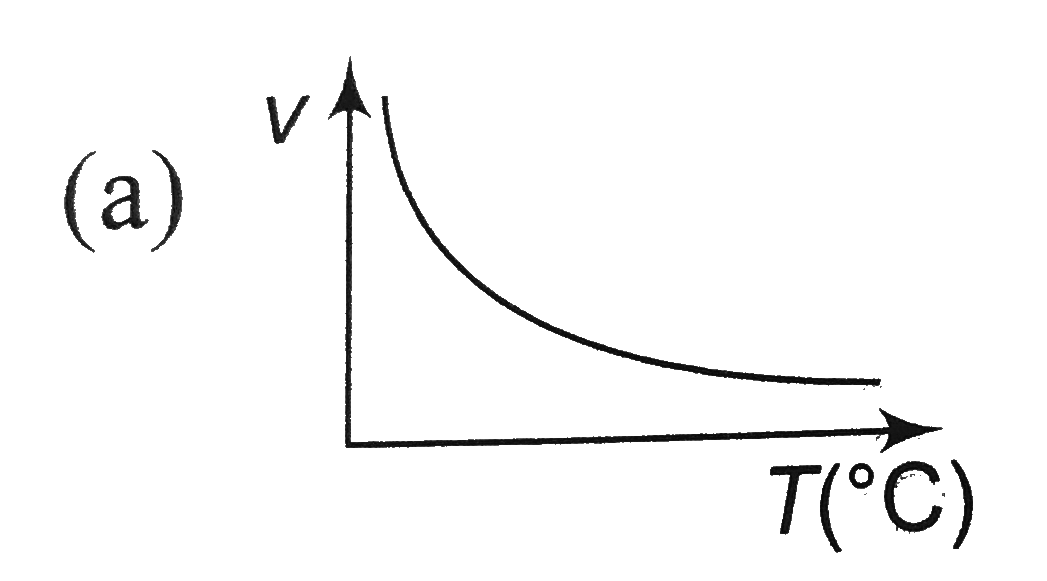
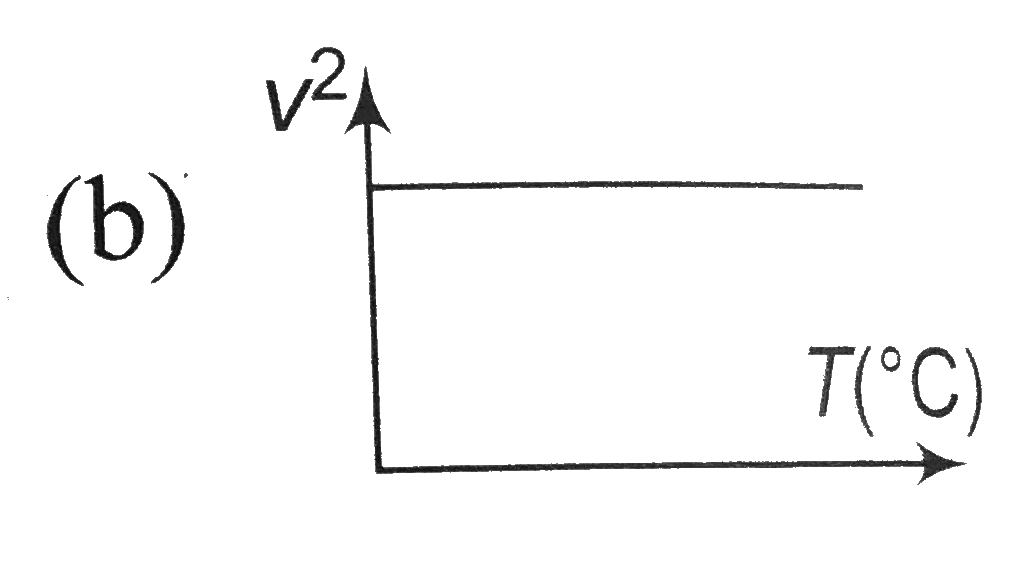
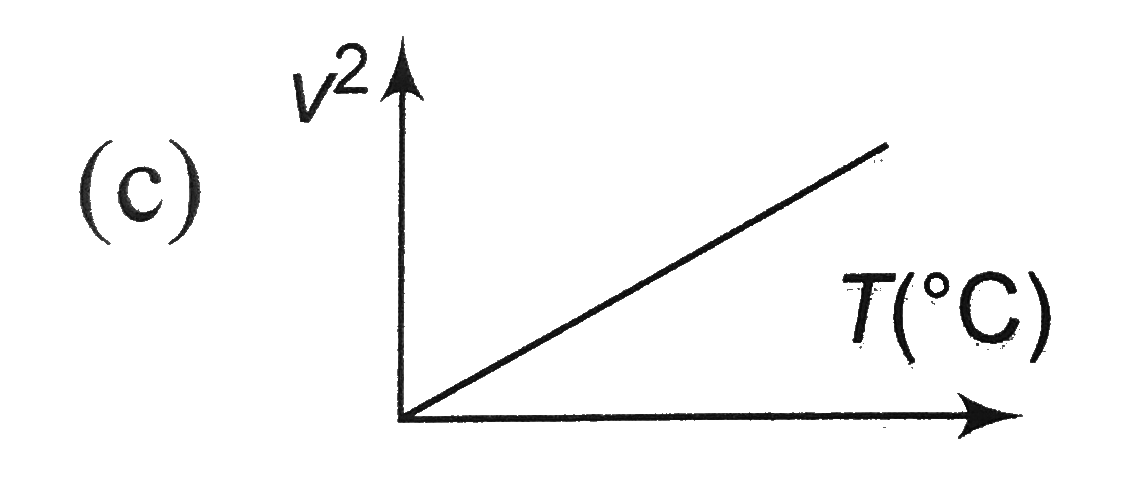
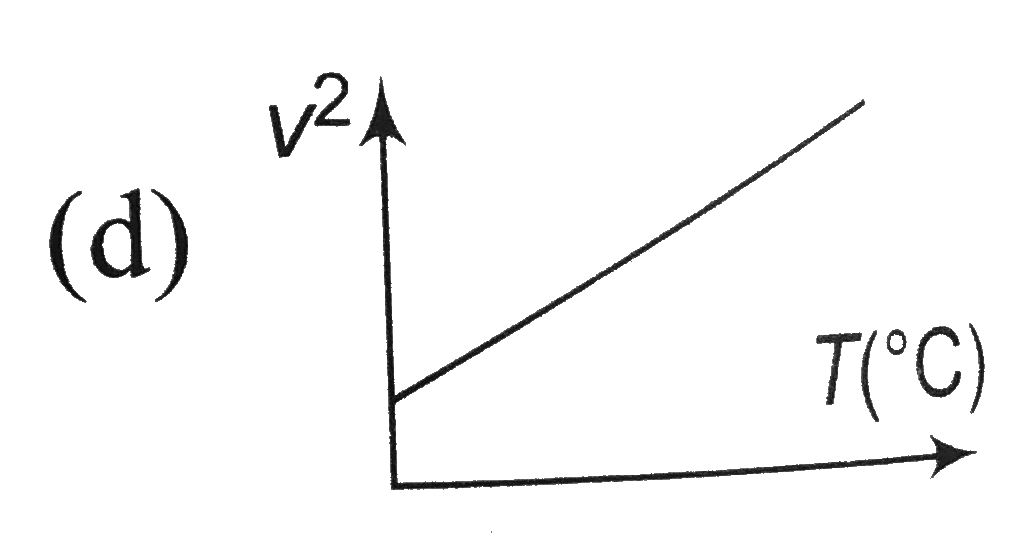
The correct Answer is:D
To determine the graph between the square of the velocity (v2) and the temperature T of a gas, we can follow these steps:
1. Understanding the Relationship:
We start with the relationship derived from the kinetic theory of gases. The velocity v of gas molecules is related to the temperature T of the gas. According to the kinetic theory, the average velocity of gas molecules is proportional to the square root of the absolute temperature.
2. Using the Formula:
The formula we can use is:
v∝√T
This means that the velocity v is directly proportional to the square root of the temperature T.
3. Squaring the Relationship:
To find the relationship between v2 and T, we square both sides of the equation:
v2∝T
This indicates that the square of the velocity is directly proportional to the temperature.
4. Graph Interpretation:
If we plot v2 on the y-axis and T on the x-axis, the relationship v2∝T suggests that the graph will be a straight line. However, we must consider the behavior at T=0.
5. Considering the Zero Temperature:
At absolute zero temperature (T=0), the velocity of gas molecules does not become zero due to quantum effects. Therefore, the graph will not pass through the origin. Instead, it will start from a positive value on the y-axis.
6. Conclusion:
Thus, the graph of v2 versus T will be a straight line that does not pass through the origin, indicating a linear relationship with a positive intercept.
Final Answer:
The graph between (velocity)2 and temperature T of a gas is a straight line that does not pass through the origin.
---
We start with the relationship derived from the kinetic theory of gases. The velocity v of gas molecules is related to the temperature T of the gas. According to the kinetic theory, the average velocity of gas molecules is proportional to the square root of the absolute temperature.
The formula we can use is:
v∝√T
This means that the velocity v is directly proportional to the square root of the temperature T.
To find the relationship between v2 and T, we square both sides of the equation:
v2∝T
This indicates that the square of the velocity is directly proportional to the temperature.
If we plot v2 on the y-axis and T on the x-axis, the relationship v2∝T suggests that the graph will be a straight line. However, we must consider the behavior at T=0.
At absolute zero temperature (T=0), the velocity of gas molecules does not become zero due to quantum effects. Therefore, the graph will not pass through the origin. Instead, it will start from a positive value on the y-axis.
Thus, the graph of v2 versus T will be a straight line that does not pass through the origin, indicating a linear relationship with a positive intercept.
The graph between (velocity)2 and temperature T of a gas is a straight line that does not pass through the origin.
Topper's Solved these Questions
- WAVES AND ACOUSTICSBOOK - A2ZCHAPTER - WAVES AND ACOUSTICSEXERCISE - Doppler Effect
25 Videos
- WAVES AND ACOUSTICSBOOK - A2ZCHAPTER - WAVES AND ACOUSTICSEXERCISE - Problems Based On Mixed Concepts
15 Videos
- WAVES AND ACOUSTICSBOOK - A2ZCHAPTER - WAVES AND ACOUSTICSEXERCISE - Vibration Of Air Column
23 Videos
- VECTORSBOOK - A2ZCHAPTER - VECTORSEXERCISE - Chapter Test
29 Videos
- WORK, ENERGY, POWER AND COLLISIONBOOK - A2ZCHAPTER - WORK, ENERGY, POWER AND COLLISIONEXERCISE - Chapter Test
29 Videos
Similar Questions
Knowledge Check
The graph between surface tension and temperature T is
A B
B C
C D
D
The graph between L and T2 is
A B
B C
C D
D
The graph between L and T2 is
A B
B C
C D
D
The slope of the graph between log P and log V at constant temperature for a given mass of gas is
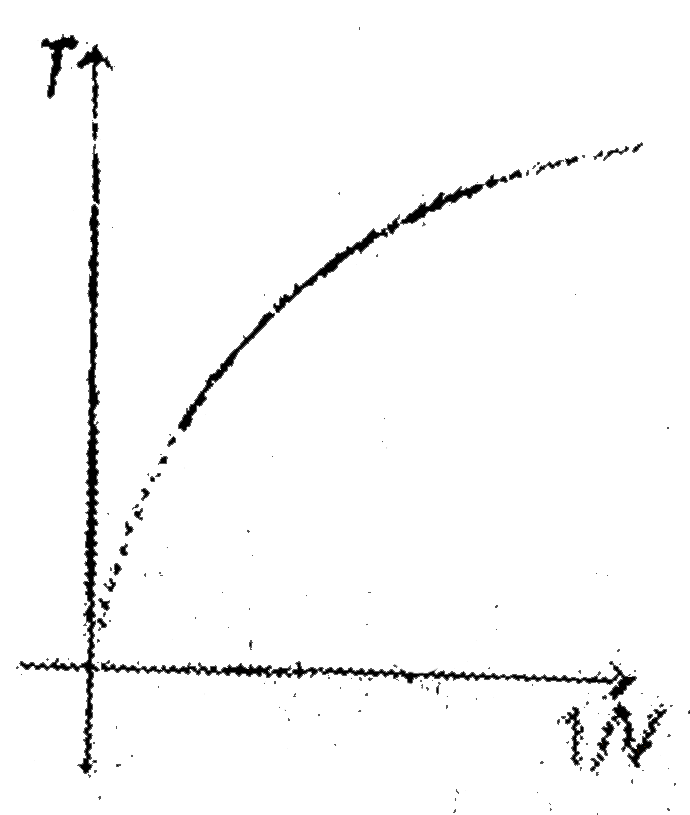
View SolutionFigure shows a parabolic graph between T and 1V (T = temperature, V = Volume) for a gas undergoing an adiabatic process. If the ratio of rms velocity of molecules and speed of sound in the gas at the same temperature is √n, then find the value of n.
View SolutionA particle is exdecuting a linear SHM. What is the nature of the graph between the velocity and displacement of the particle at any ins"tan"t ?
View SolutionGraph between P & V below critical temperature is
View SolutionThe graph between log t1/2 and log a at a given temperature is
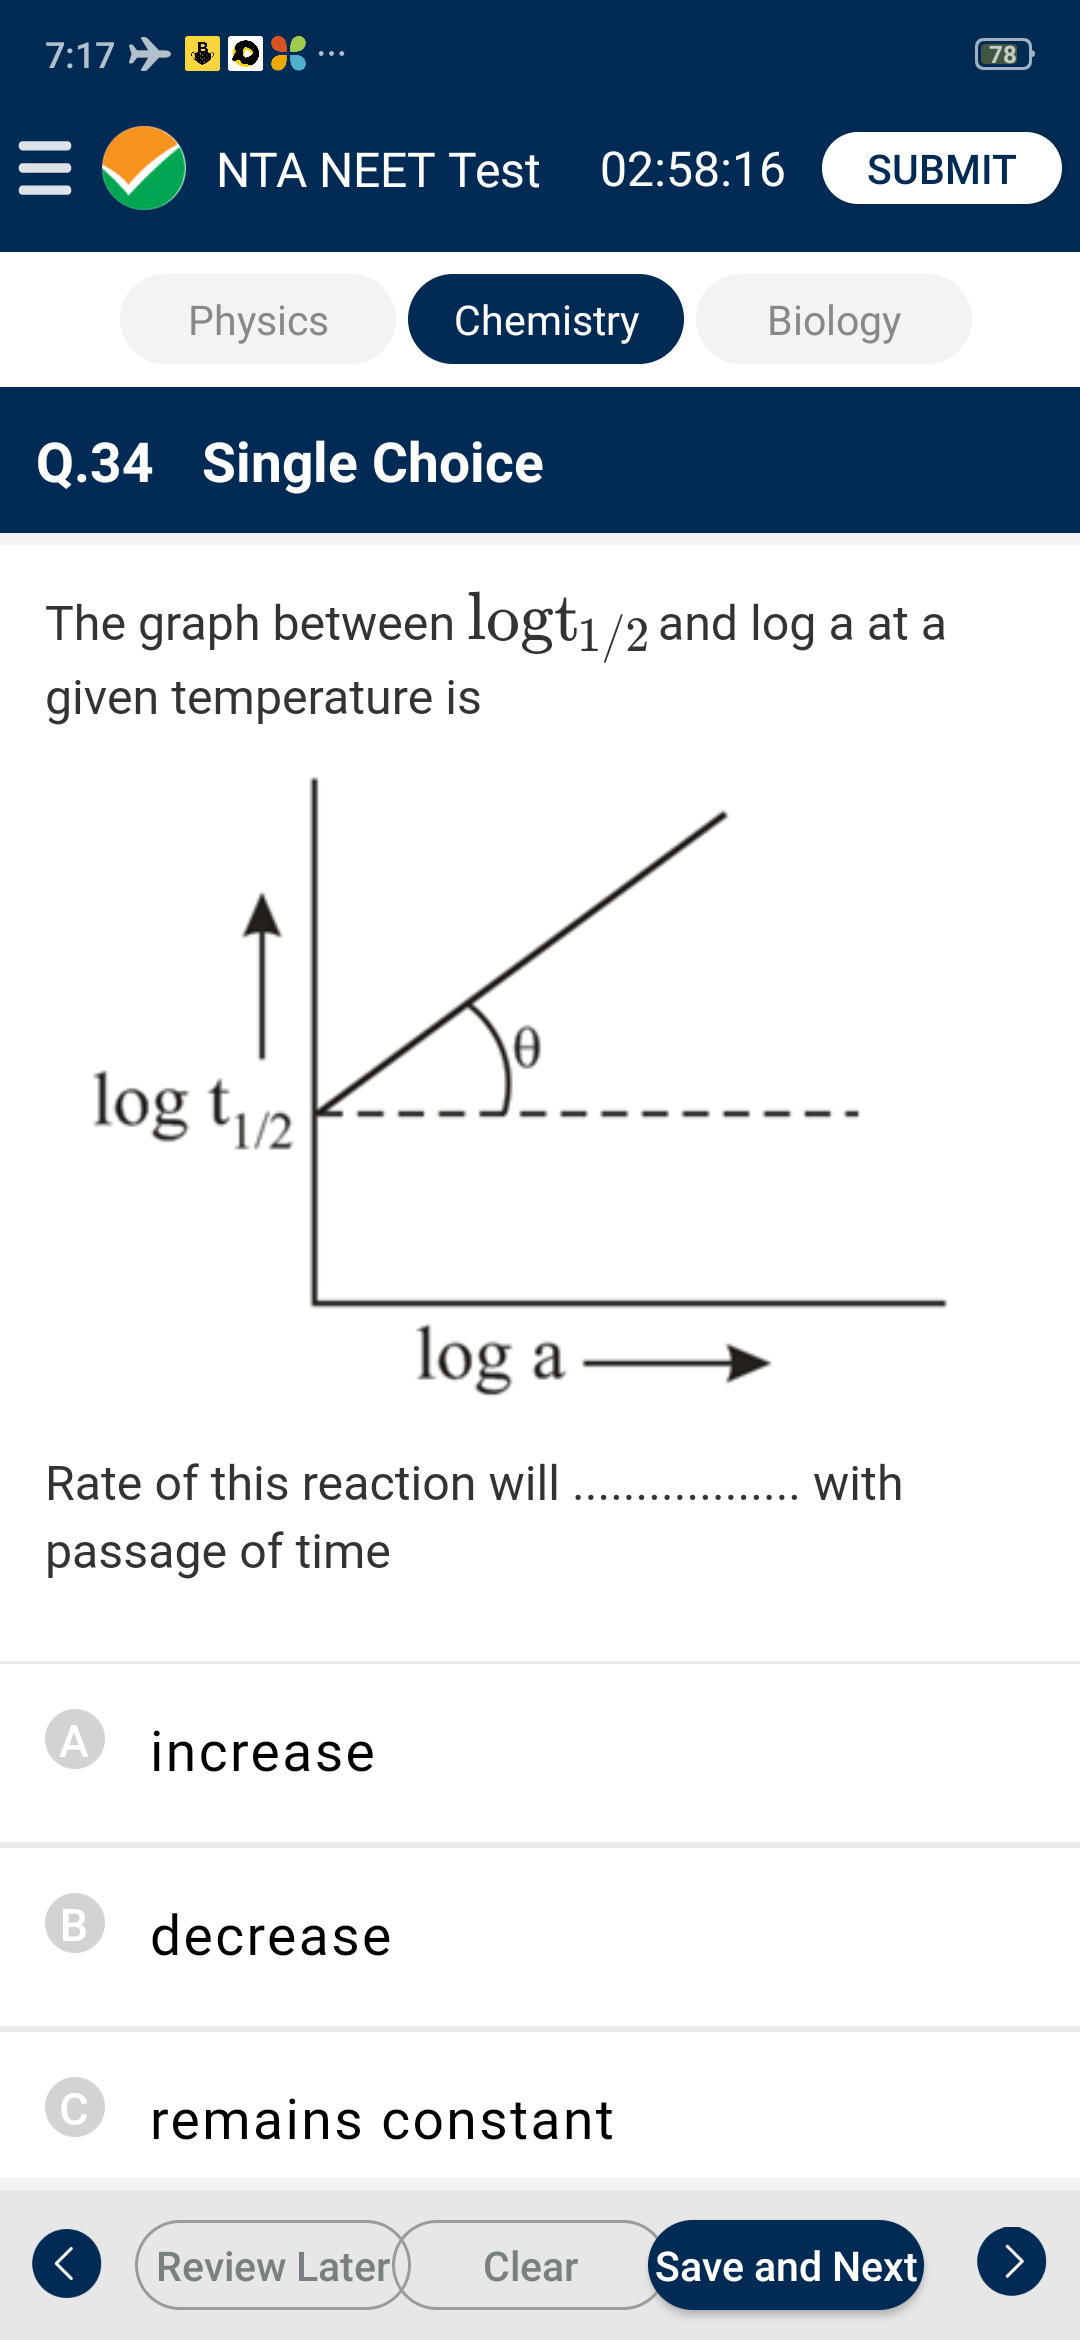
Rate of this reaction will …….with passage of time
View Solution
