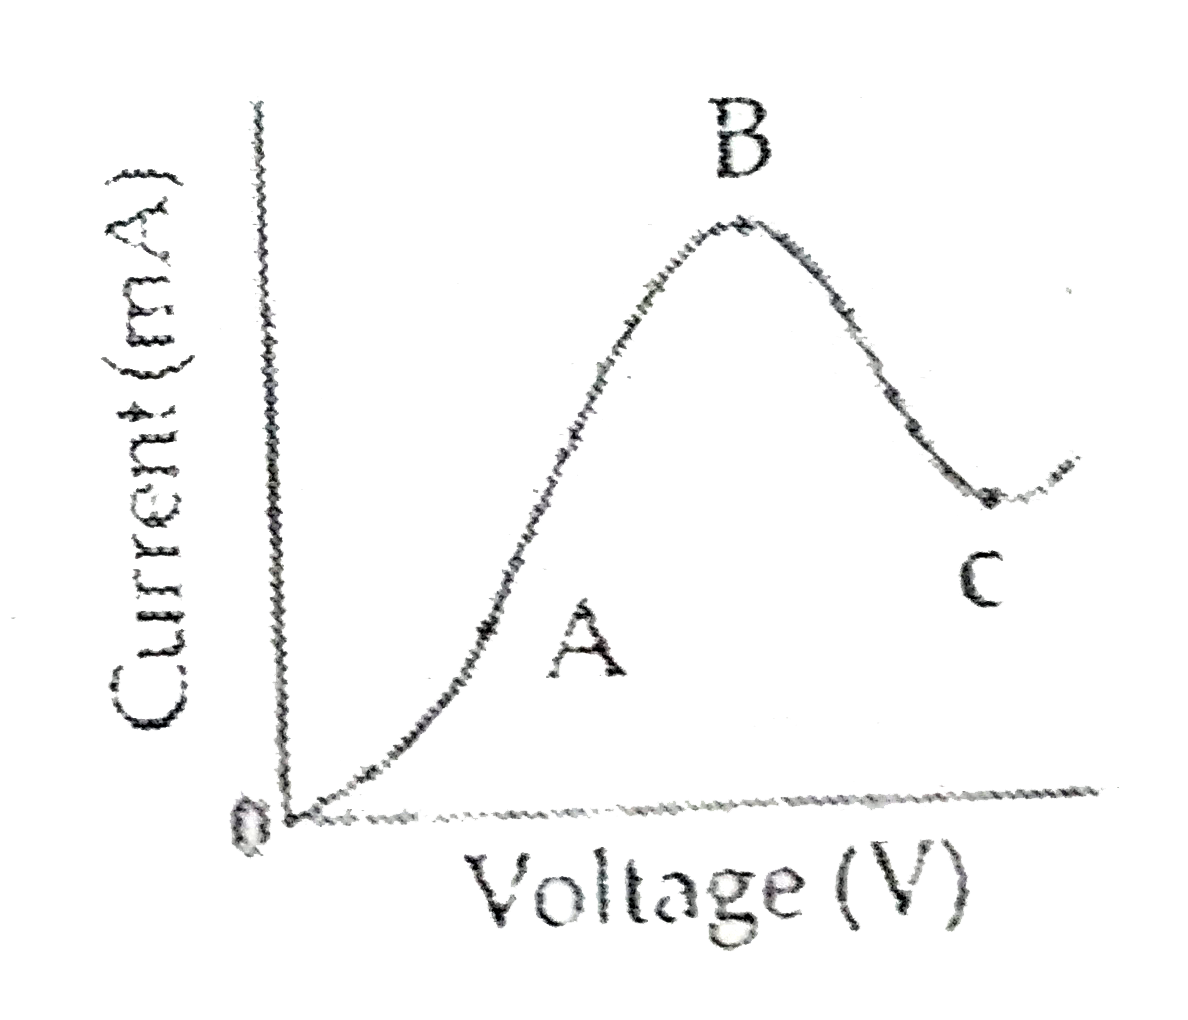
The graph shown in the figure represents a plot of current versus voltage for a given semiconductor. Identify the region, if any, over which the semiconductor has a negative resistance.

Resistance of a material can be found out by the slope of the curve V vs. I Part BC of the curve shows the negative resistance as with the increase in current, voltage decreases.
Topper's Solved these Questions
- SEMI-CONDUCTORS ELECTRONICSBOOK - OSWAAL PUBLICATIONCHAPTER - SEMI-CONDUCTORS ELECTRONICSEXERCISE - TOPIC -2 SEMICONDUCTOR DIODES AND THEIR APPLICATIONS (SHORT ANSWER TYPE QUESTIONS- I)
9 Videos
- SEMI-CONDUCTORS ELECTRONICSBOOK - OSWAAL PUBLICATIONCHAPTER - SEMI-CONDUCTORS ELECTRONICSEXERCISE - TOPIC -2 SEMICONDUCTOR DIODES AND THEIR APPLICATIONS (SHORT ANSWER TYPE QUESTIONS- II)
9 Videos
- SEMI-CONDUCTORS ELECTRONICSBOOK - OSWAAL PUBLICATIONCHAPTER - SEMI-CONDUCTORS ELECTRONICSEXERCISE - TOPIC -1 ENERGY BANDS ( LONG ANSWER TYPE QUESTIONS-II)
2 Videos
- Sample Paper 8BOOK - OSWAAL PUBLICATIONCHAPTER - Sample Paper 8EXERCISE - Exercise
37 Videos
- SOLVED PAPER (II PUC JULY 2016)BOOK - OSWAAL PUBLICATIONCHAPTER - SOLVED PAPER (II PUC JULY 2016)EXERCISE - PART D
11 Videos
Similar Questions
Knowledge Check
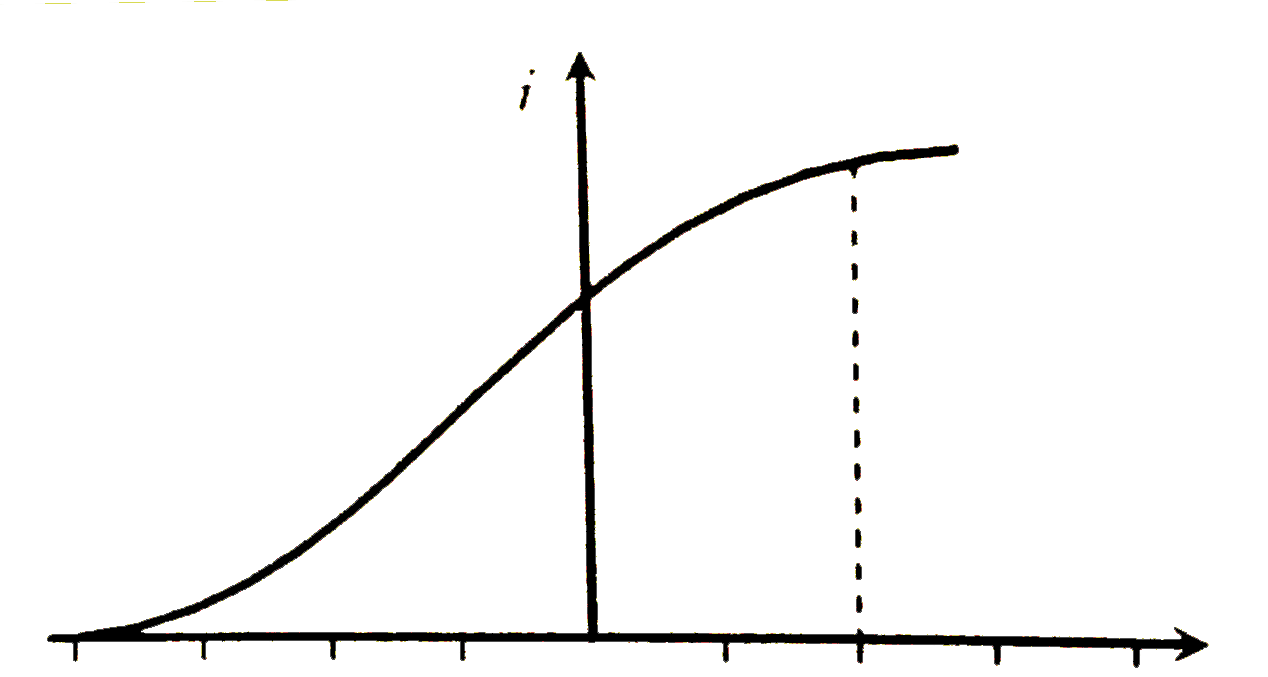
Figure represents the graph of photo current l versus applied voltage (V). The minimum energy of emitted photoelectrons is
 A2 eVB4 eVC0 eVD4 J
Plot a graph showing variation of current versus voltage for the material Ga.
View SolutionPlot a graph showing variation of current versus voltage for the material Ga.
View SolutionGraph showing the variation of current versus voltage for a material Ga As (a semiconductor) is shown in the Fig. Identify the region of (i) negative resistance, (ii) where Ohm's law is obeyed.
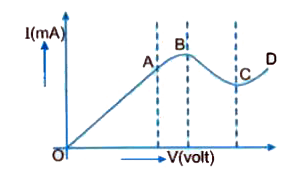
View SolutionGraph showing the variation of current versus voltage for a material GaAs is shown in figure. Identify the region of (i) negative resistance (ii) where Ohm's law is obeyed.
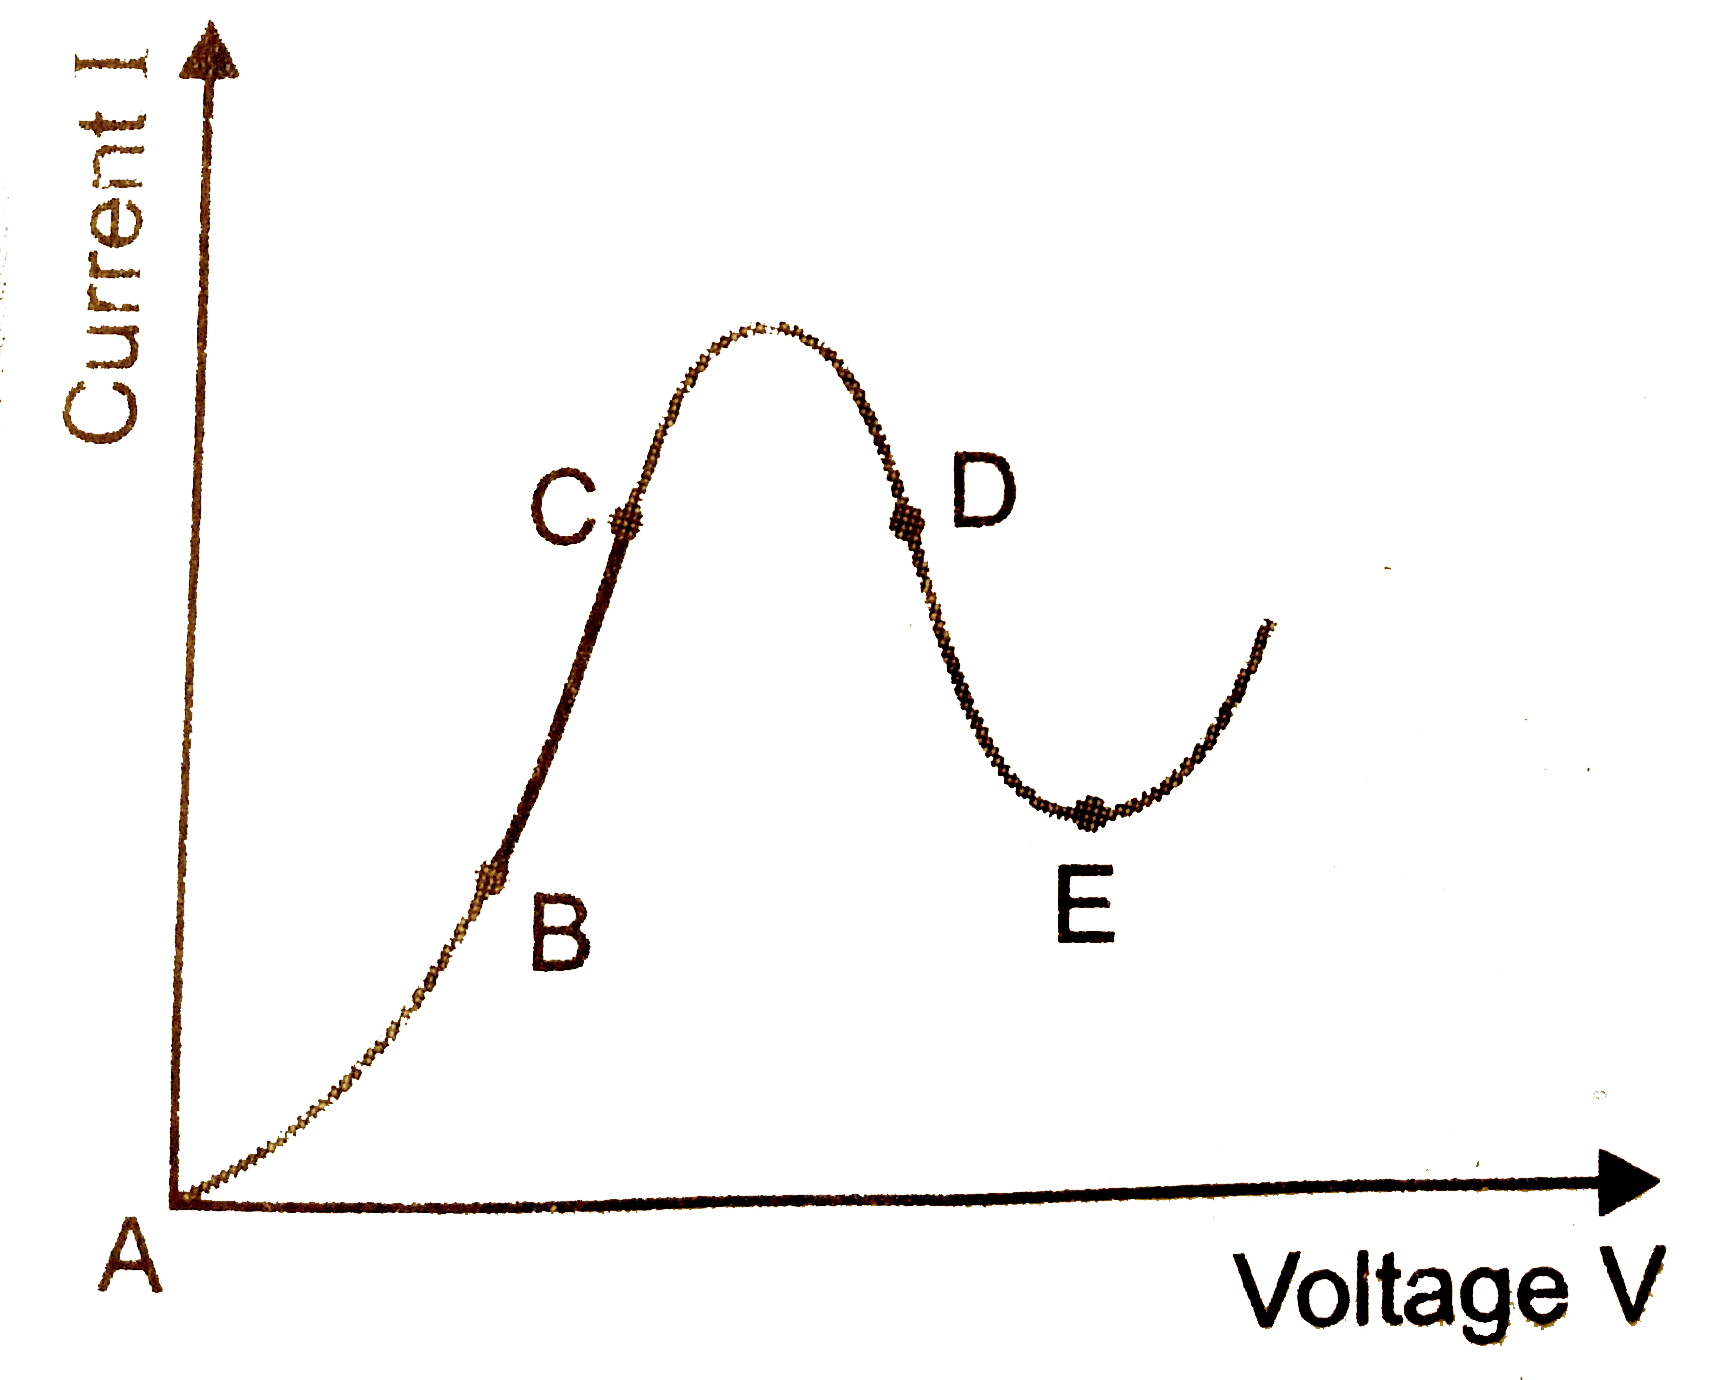
View SolutionGraph showing the variation of current versus voltage for a material GaAs is shown in figure. Identify the region of (i) negative resistance (ii) where Ohm's law is obeyed.

View SolutionIn an electric circuit shown alongside, find
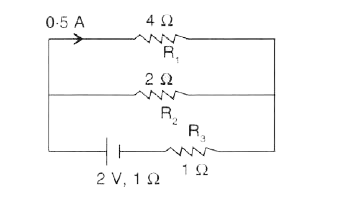
terminal voltage of the battery
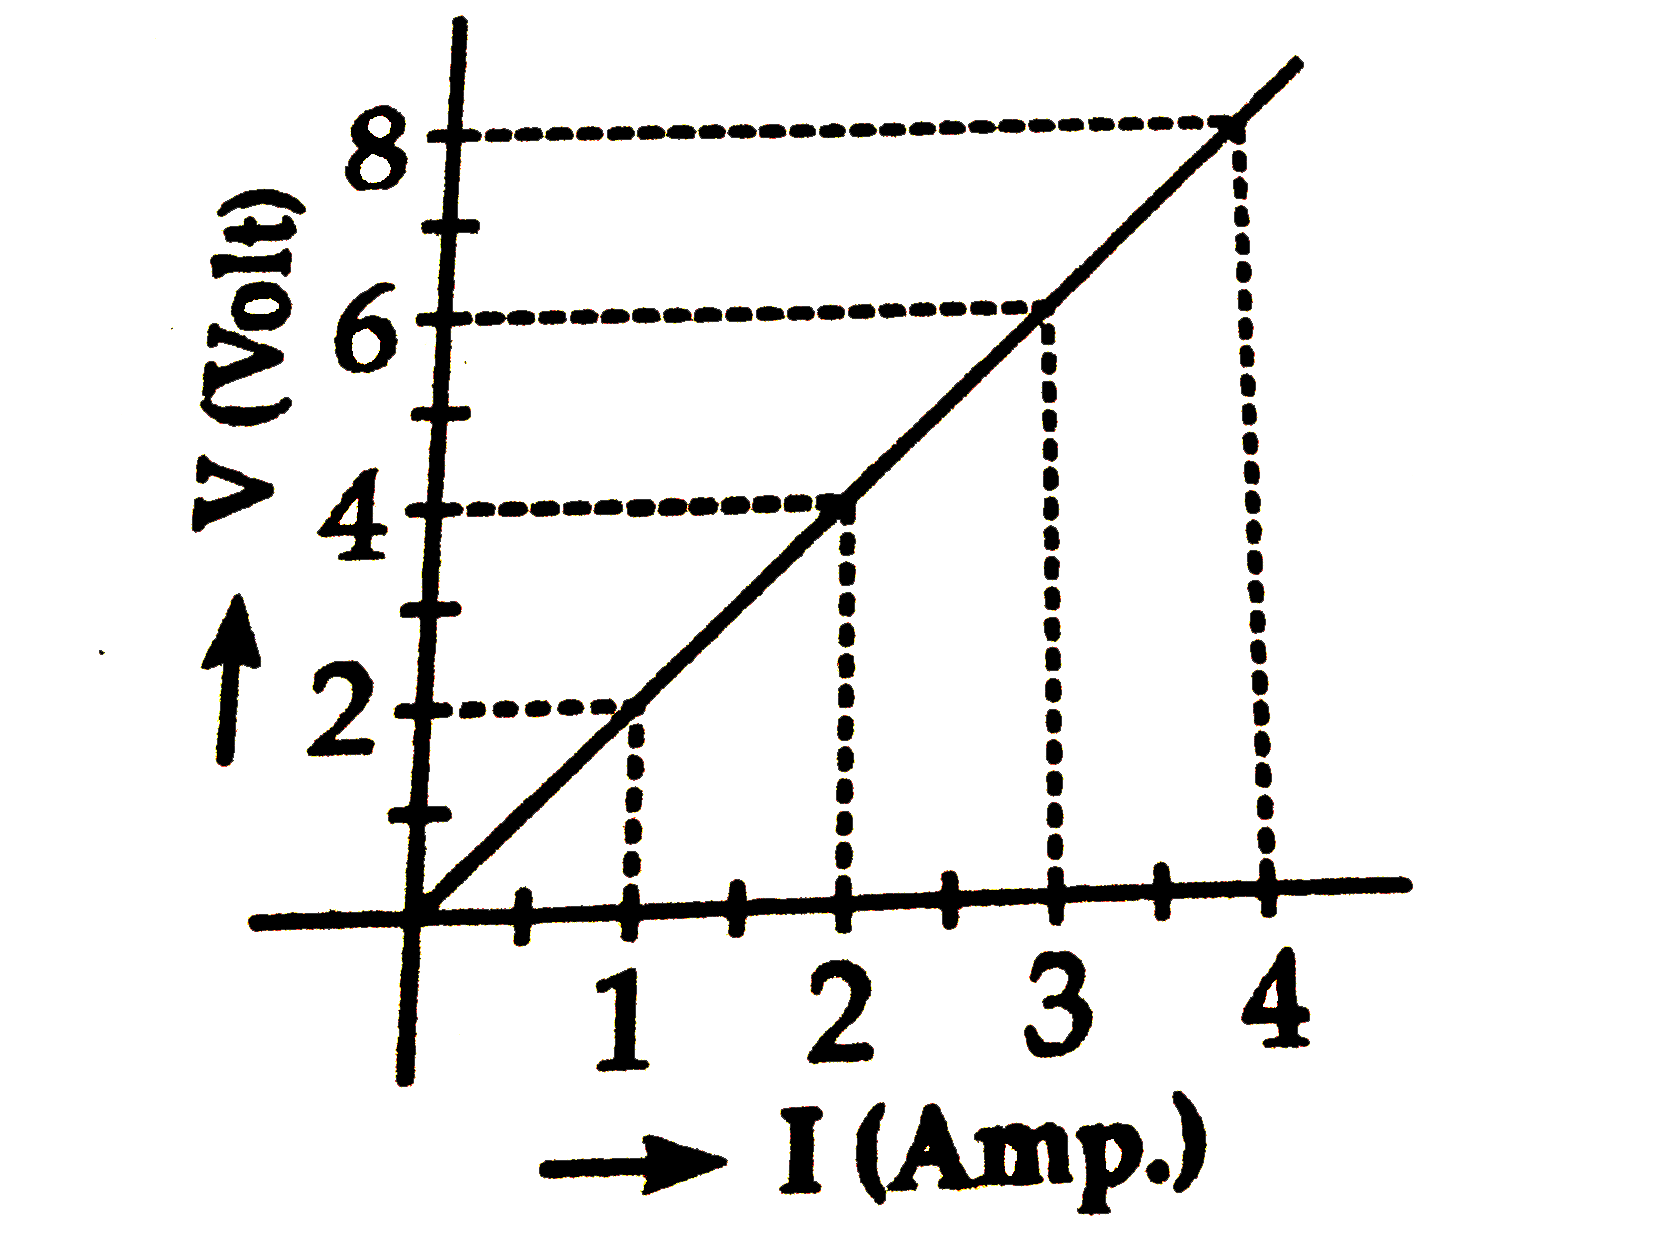
View SolutionVariation of current and voltage in a conductor is shown in the adjoining figure. The resistance of the conductor is
View Solution

