The graph which represents the correct variation of logarithm of activity (log A) versus time, in figure is.
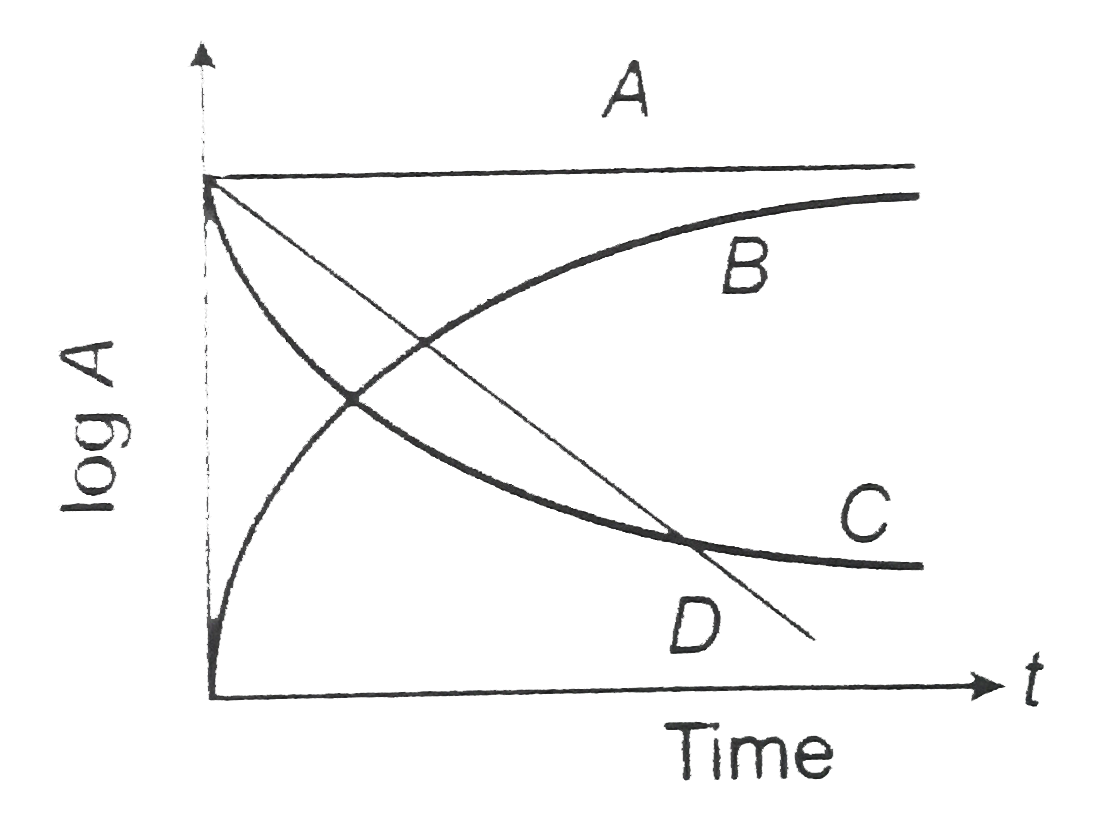 .
.
A
B
C
D
The correct Answer is:D
(d) Activity A=λN0e−λt
⇒logeA=logeλN0+logee−λt
⇒logeA=logeC−λt(TakeλN0=C)
⇒logeA=−λt+logeC
This is the equation of a straight line having negative slope (=−λ) and positive intercept in logeA axis.
Topper's Solved these Questions
Similar Questions
A radioactive isotope X decays into a stable nucleus Y. Draw graphs showing the variation of rate of formation of Y versus time and the variation of population of Y versus time. Initial population of Y is zero.
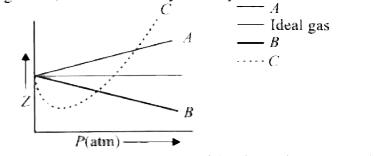
View SolutionThe given graph represents the variation of Z (compressibility factor =PVnRT) versus P, for three real gases A,B and C. Identify the only incorrect statement.
 View Solution
Knowledge Check
- Question 1 - Select One
At time t=0, some radioactive gas is injected into a sealed vessel. At time T, some more of the same gas is injected into the same vessel. Which one of the following graphs best represents the variation of the logarithm of the activity A of the gas with time t?
A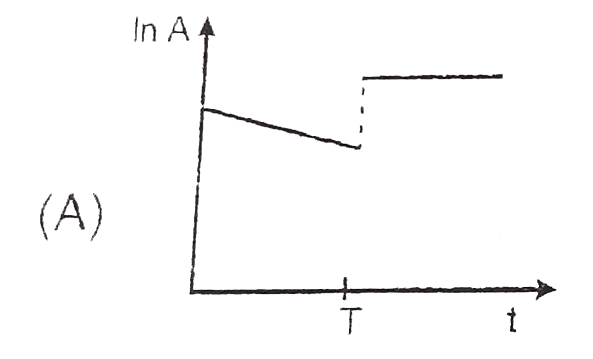 B
B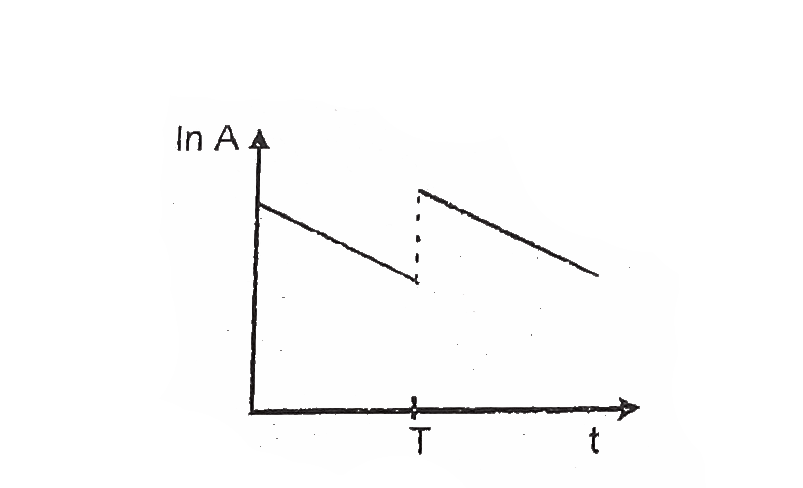 C
C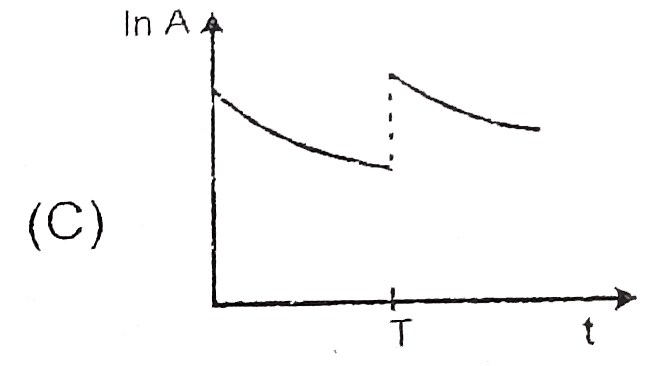 D
D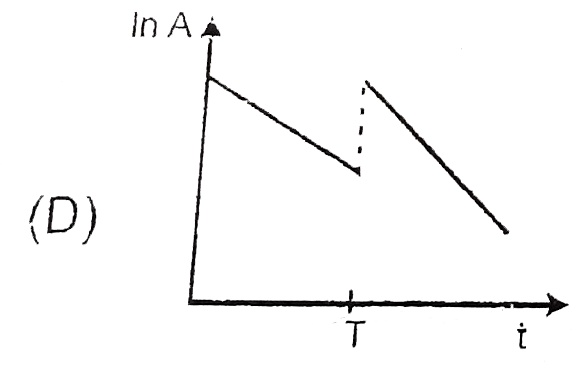
- Question 2 - Select One
Which of the following graphs represents the variation of activity (A) of a radioactive substance with time (t).
A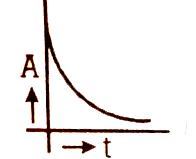 B
B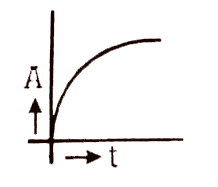 C
C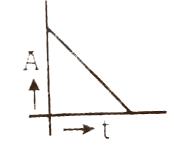 D
D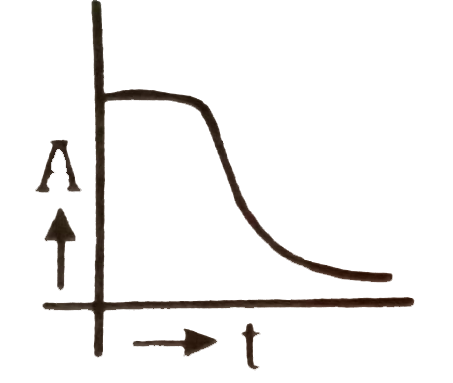
- Question 3 - Select One
The graph which represents the variation of mean kinetic energy of moleules with temperature ∘C is ?
A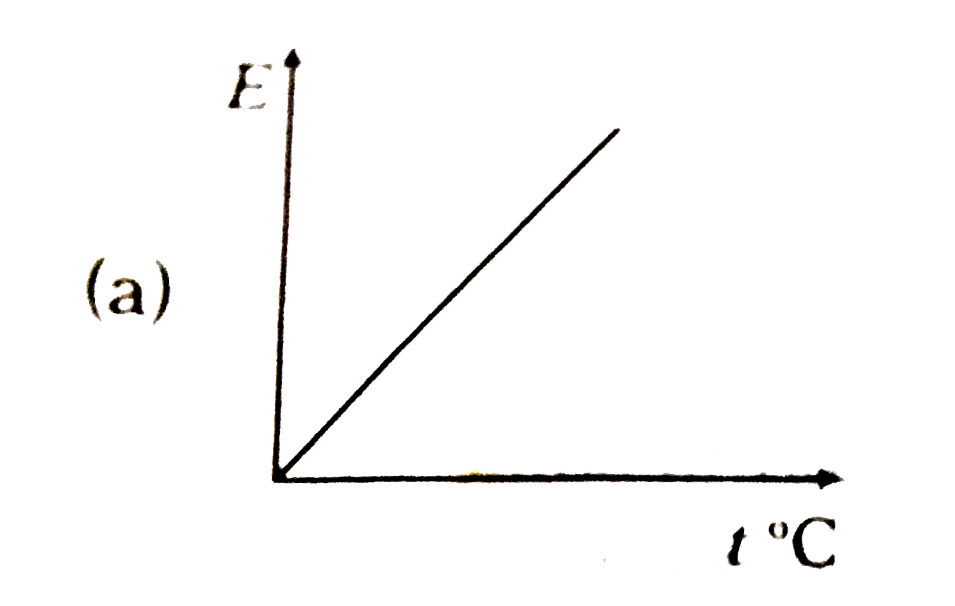 B
B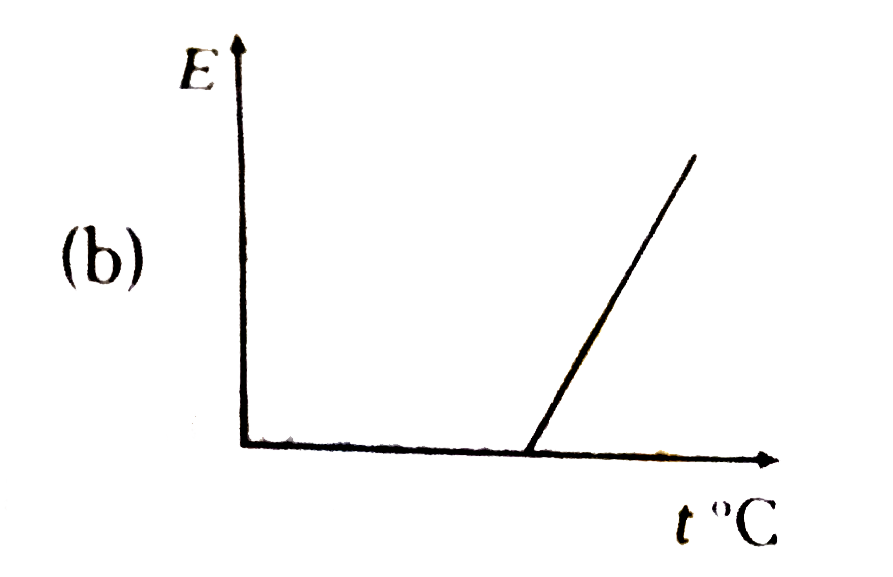 C
C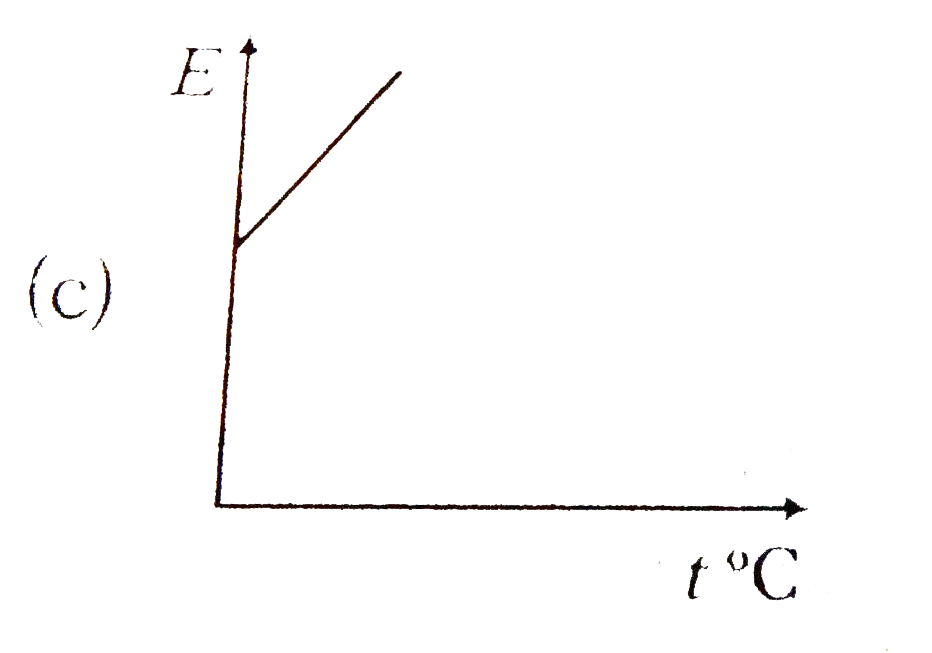 D
D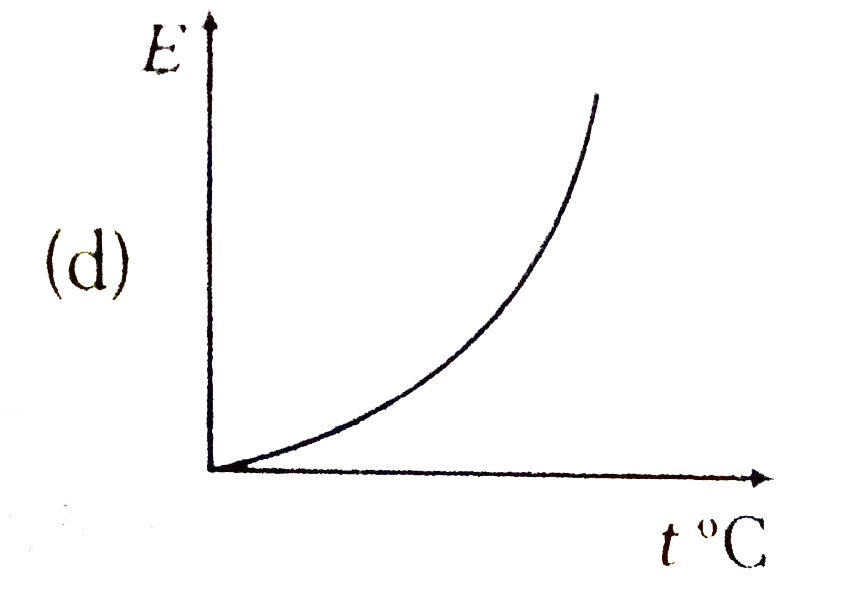
The given graph represents the variation of Z (compressibility factor =PVnRT) versus P, for three real gases A, B and C. Identify the only incorrect statement.
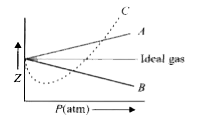 View Solution
Which graph best represents the variation of radius r of a circular orbit of a satellite against its time priod T ?
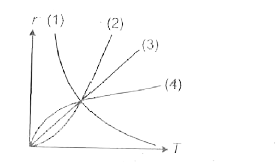 View Solution
Variation of velocity v versus time t is ( Given x= Asinomegat)
View SolutionWhich of the following graphs represent the correct variation of inductive reactance XL with frequency υ?
View Solutionwhich of the following graph represents the variation of resistivity (ρ) with temperature (T) for copper?
View Solution

