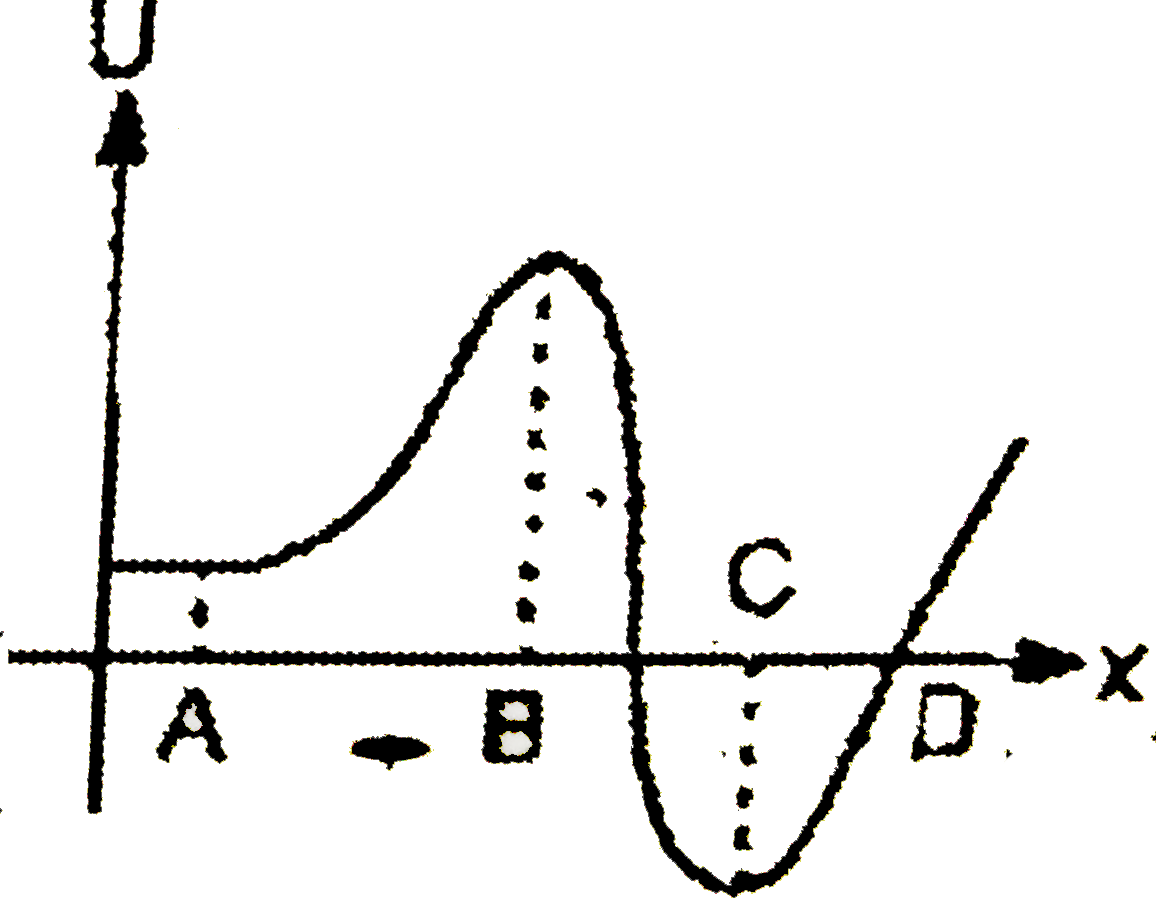
The slope of potential energy versus position graph represents
force
power
momentum
work
The correct Answer is:A
To solve the question, "The slope of potential energy versus position graph represents," we can follow these steps:
Step 1: Understand the Graph
- We are given a graph where the y-axis represents potential energy (U) and the x-axis represents position (x).
Hint: Remember that in a graph, the y-axis typically represents the dependent variable, while the x-axis represents the independent variable.
Step 2: Identify the Slope
- The slope of a graph is defined as the change in the y-value divided by the change in the x-value. For our graph, the slope can be expressed mathematically as dUdx.
Hint: The slope can be thought of as the rate of change of the potential energy with respect to position.
Step 3: Relate the Slope to Force
- From physics, we know that the force (F) acting on an object is related to the potential energy by the equation:
F=−dUdx
- This means that the slope of the potential energy versus position graph (dUdx) is equal to the negative of the force.
Hint: The negative sign indicates that force acts in the direction of decreasing potential energy.
Step 4: Conclusion
- Therefore, the slope of the potential energy versus position graph represents the negative of the force acting on the object. Thus, we can conclude that the answer to the question is that the slope represents force.
Final Answer: The slope of the potential energy versus position graph represents force.
- We are given a graph where the y-axis represents potential energy (U) and the x-axis represents position (x).
- The slope of a graph is defined as the change in the y-value divided by the change in the x-value. For our graph, the slope can be expressed mathematically as dUdx.
- From physics, we know that the force (F) acting on an object is related to the potential energy by the equation:
F=−dUdx
- This means that the slope of the potential energy versus position graph (dUdx) is equal to the negative of the force.
- Therefore, the slope of the potential energy versus position graph represents the negative of the force acting on the object. Thus, we can conclude that the answer to the question is that the slope represents force.
Topper's Solved these Questions
Similar Questions
Knowledge Check
- Question 1 - Select One
The slope of the kinetic energy versus position vector curve gives the rate of change of :-
AworkBforceCpowerDmomentum - Question 2 - Select One or More
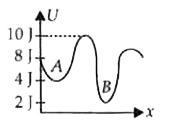
A particle moves along x-axis whose potential energy versus x-coordinate graph is shown in the given figure. At x = 0, the particle is released form rest. Two potential wells A and B are shown in the figure. Then,
 Athe particle will never reach the potential well B.Bthe particle will be trapped into the potential well A.Cthe maximum kinetic energy during motion of the particle is 4 J.Dthe maximum kinetic energy during motion of the particle is 6 J.
 - Question 3 - Select One
STATEMENT - 1 : The instantaneous velocity is always tangential to the path
and
STATEMENT - 2 : The slope of position-time graph represents the velocity.AStatement-1 is True, Statement-2 is True, Statement-2 is a correct explanation for Statement-1BStatement-1 is True, Statement-2 is True, Statement-2 is NOT a correct explanation for Statement-1CStatement-1 is True, Statement-2 is FalseDStatement-1 is False, Statement-2 is True
Which of the following position versus time graphs represents a a body at rest?
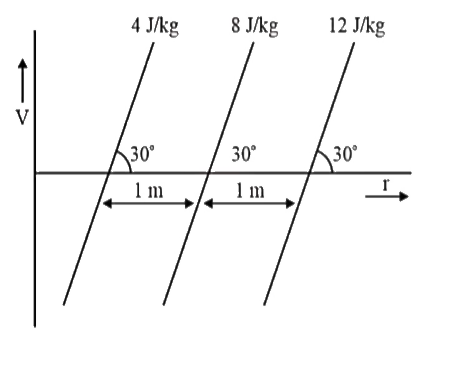
View SolutionGravitational potential V versus distance r graph is represented in the figure. The magnitude of gravitational field intensity is equal to
 View Solution
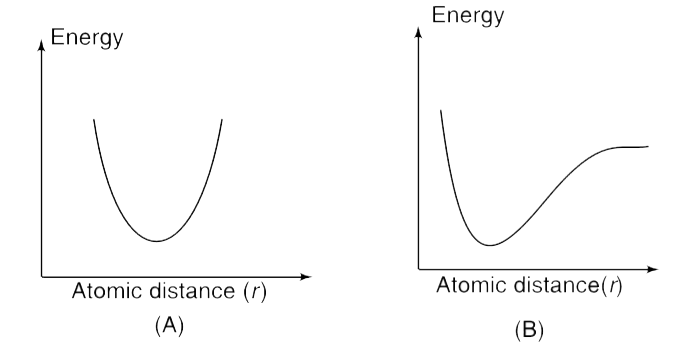
In the given figure graph B shows the variation of potential energy versus atomic separation (r) in a material. Argue qualitatively to show that if the potential energy graph was a symmetrical one as depicted in graph A, there would have been no thermal expansion on heatin
 View Solution
STATEMENT - 1 : The slope on a position-time graph is representative of the acceleration of the object.
STATEMENT - 2 : A straight, diagonal line on a position-time graph is representative of an onject with a constant velocity.
STATEMENT - 3 : I an object is at rest, then the position-time graph must be a horizontal line located on the time-axis.View SolutionThe following plot shows the variation of potential energy (U) of a system versus position (x). From the graph we can interpret that :
 View Solution

