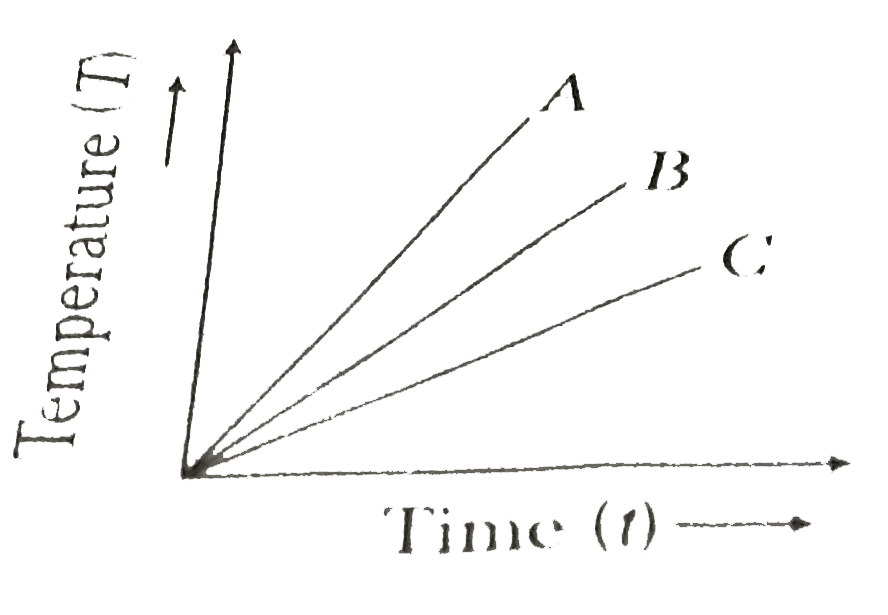
The temperatures versus time graph is shown in figure. Which of the substance A,B and C has the lowest heat capacity if heat is supplied to all of them at equal rates.
A
B
C
All the above
The correct Answer is:A
Slope α (1)/(Heat capacity)
Topper's Solved these Questions
- CALORIMETRY AND HEAT TRANSFERBook:DC PANDEYChapter:CALORIMETRY AND HEAT TRANSFERExercise:Check points 16.3
Explore 20 Videos
- CALORIMETRY AND HEAT TRANSFERBook:DC PANDEYChapter:CALORIMETRY AND HEAT TRANSFERExercise:Check points 16.4
Explore 25 Videos
- CALORIMETRY AND HEAT TRANSFERBook:DC PANDEYChapter:CALORIMETRY AND HEAT TRANSFERExercise:Check point 16.1
Explore 10 Videos
- CALORIMETRY & HEAT TRANSFERBook:DC PANDEYChapter:CALORIMETRY & HEAT TRANSFERExercise:Level 2 Subjective
Explore 14 Videos
- CENTRE OF MASSBook:DC PANDEYChapter:CENTRE OF MASSExercise:Medical entrances gallery
Explore 27 Videos
Similar Questions
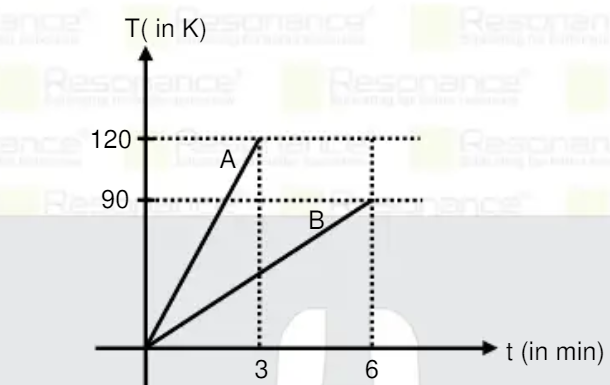
The temperature vs time graph for two different gases A and B having same number of moles is as shown in figure. If heat is supplied by same rate to both the gases. Find ratio of specific heat capacity of both gases.
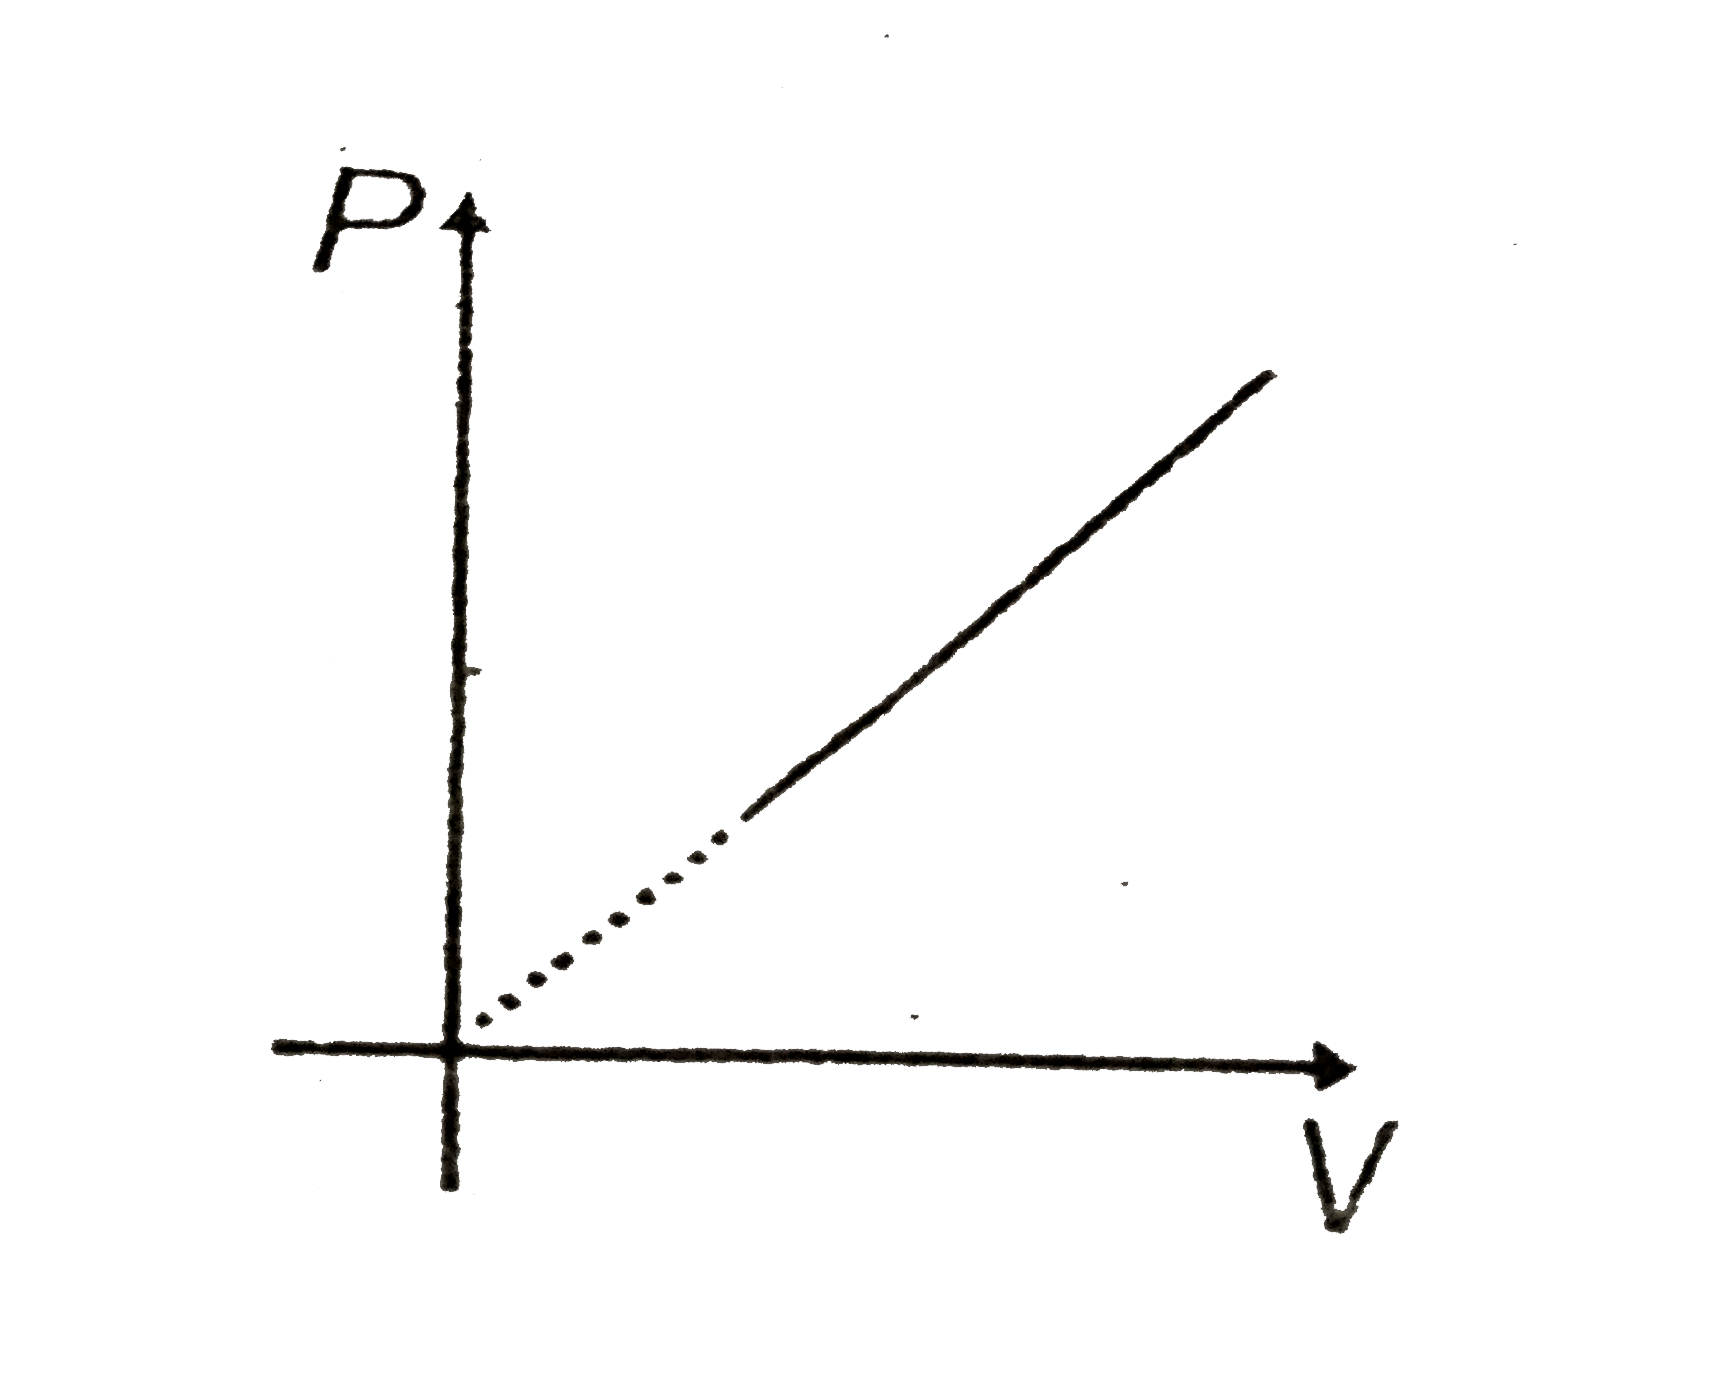
View SolutionThe variation of pressure versus volume is shown in the figure. The gas is diatomic and the molar specific heat capacity for the process is found to xR. Find the value of x.
 .
.
View Solution
Knowledge Check
Which of the following substances has the lowest value of specific heat
AglassBcopperCleadDmercuryWhich of the following substances has the greatest specific heat capacity
AIronBWaterCMercuryDSaltWhich of the substances A, B or C has the highest specific heat ? The temperature vs time graph is shown
 AABBCCDAll have equal specific heat
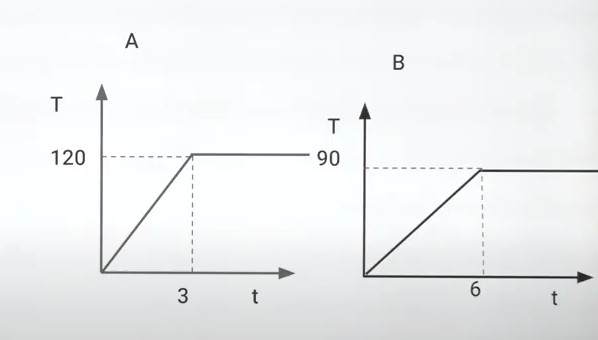
Temperature vs. time graphs are given below for 2 substances. Compare specific heat capacity
View SolutionA sphere A is placed at smooth table. An another sphere B is suspended as shown in figure. Both spheres are identical in all respects. Equal quantity of heat is supplied to both spheres. All kiinds of heat loss are neglected. The final temperatures of A and B are TA and TB respectively, then
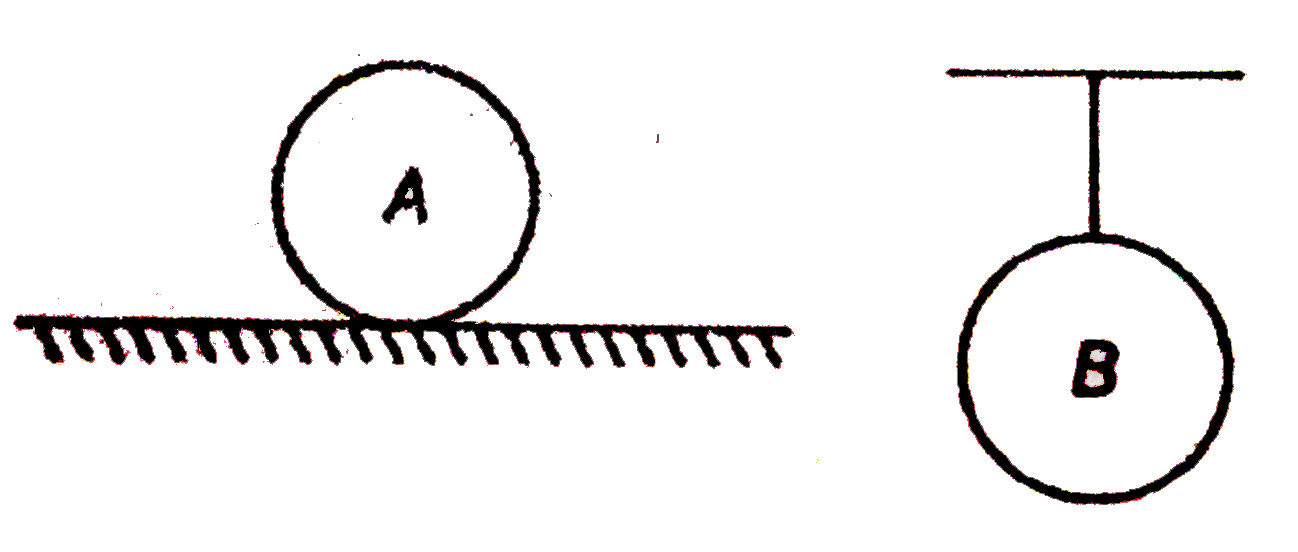
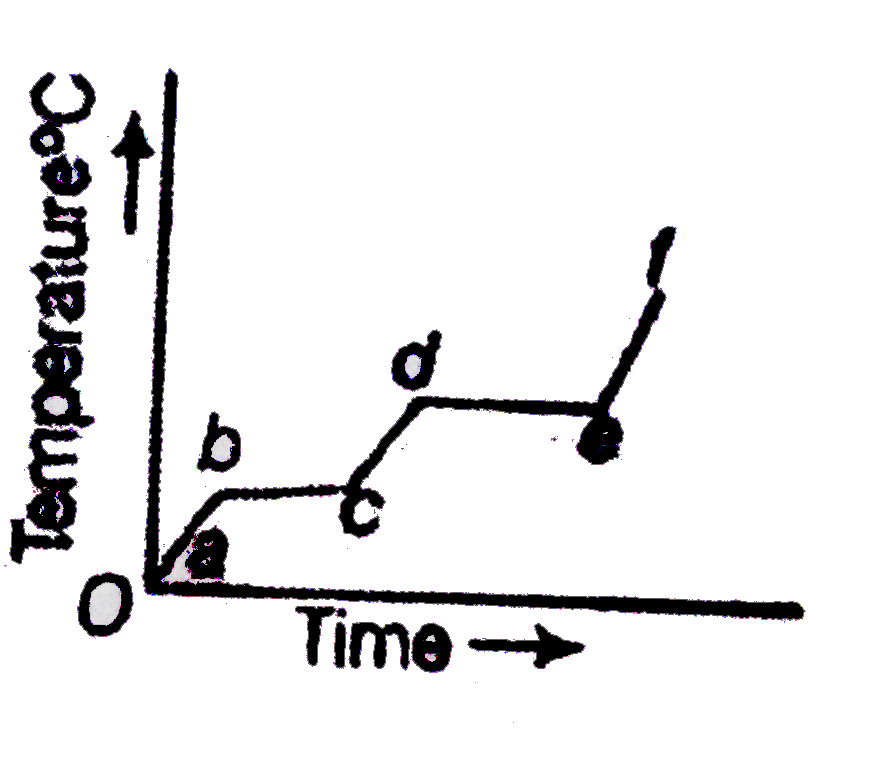
View SolutionThe following figure represents the temperature versus time plot for a given amount of a substance when heat energy is supplied to it at a fixed rate and at a constant pressure. Which part of plot represent a phase change?
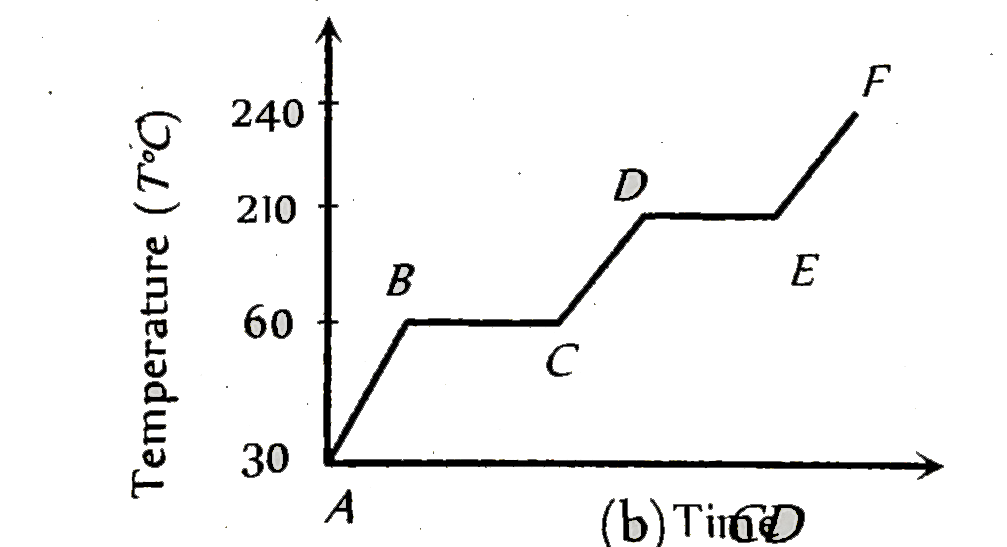
View SolutionA solid substance is at 30∘C . To this substance heat energy is supplied at a constant rate. Then temperature versus time graph is as shown in the figure. The substance is in liquid state for the portion (of the graph)
View SolutionA given substance of mass 'm' is in solid state at certain temperature. Arrange the following steps in proper sequence to calculate the total heat energy required to just convert the substance completely into gaseous state.
(A) Note down the specific latent heat of vapor ization of the substance and calculate the heat supplied to convert from liquid to gaseous state using the formula.
(B) Note down the melting point of the substance and calculate the heat supplied to increase the temperature of the solid to its melting point.
(C ) Note down the boiling point of the substance and calculate the heat supplied to increase the temperature of the substance from melting point to its boiling point.
(D) Add all the heat energies, it gives the resultant heat supplied to the solid to just convert it into gaseous state.
(E) Note down the specific latent heat of fusion of the substance and calculate the heat supplied to convert the substance from solid state to liquid state.
View Solution
