The velocity of an object as a function of time is given by the following graph :

How would you answer this same question if the graph shown were a position-versus time graph ?
Text Solution
If the graph shown were a position- versus-time graph, then the slope would be equal to the velocity. The slope of the given graph starts at zero (around point A), slowly increases to a small positive value at B, continues to slowly increase to a large positive value at C, and then, at on the graph, point D is the location of the greatest slope change, which means that this is the point of the greatest velocity change. Therefore, this is the point at which the magnitude of the acceleration is greatest.
|
Topper's Solved these Questions
Similar Questions
Knowledge Check
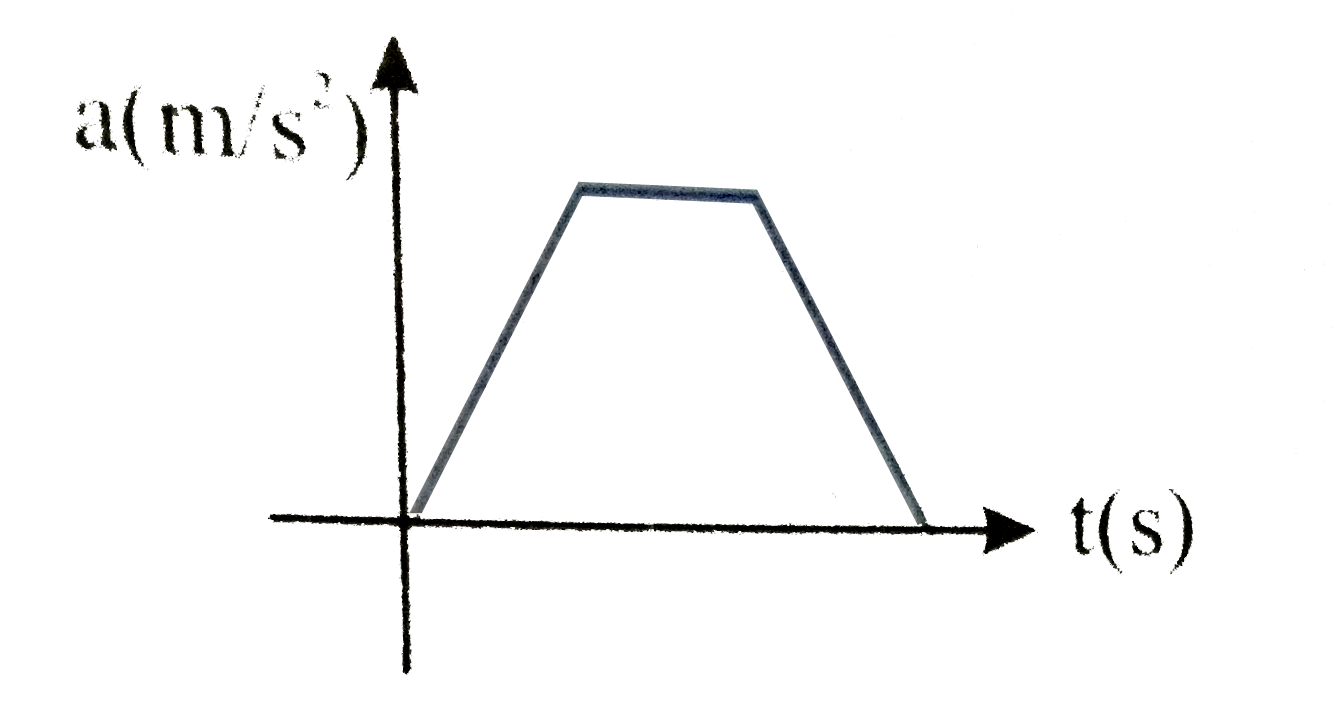
For a particle moving on a straight lint the variation of acceleration with time is given by the graph as shown. Initially the particle was at rest. Then the corresponding kinetic energy of the particle versus time graph will be
 .A
.A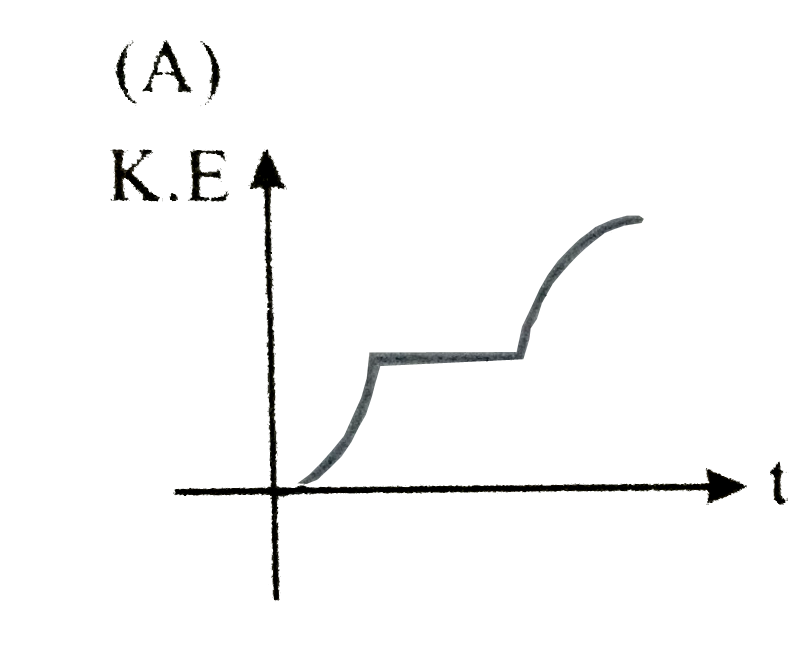 B
B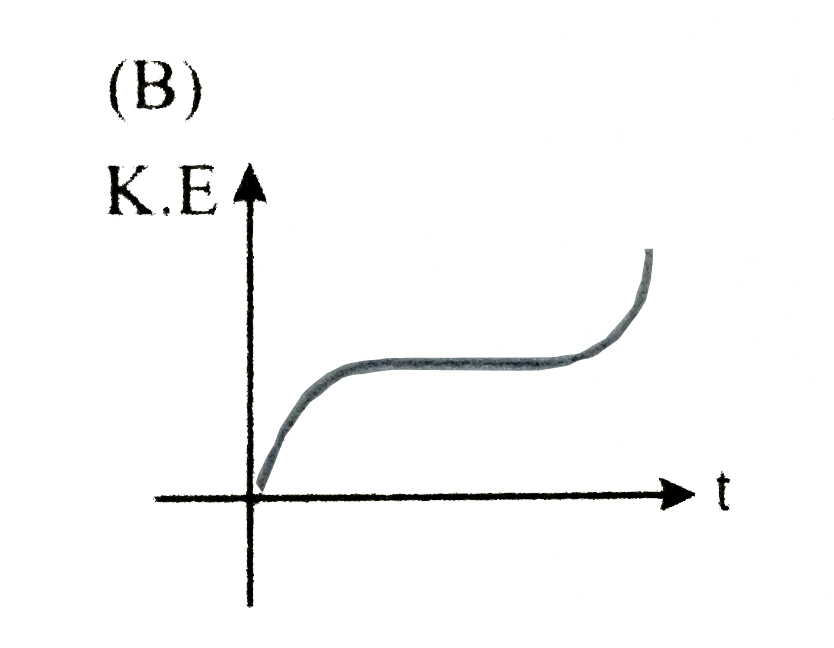 C
C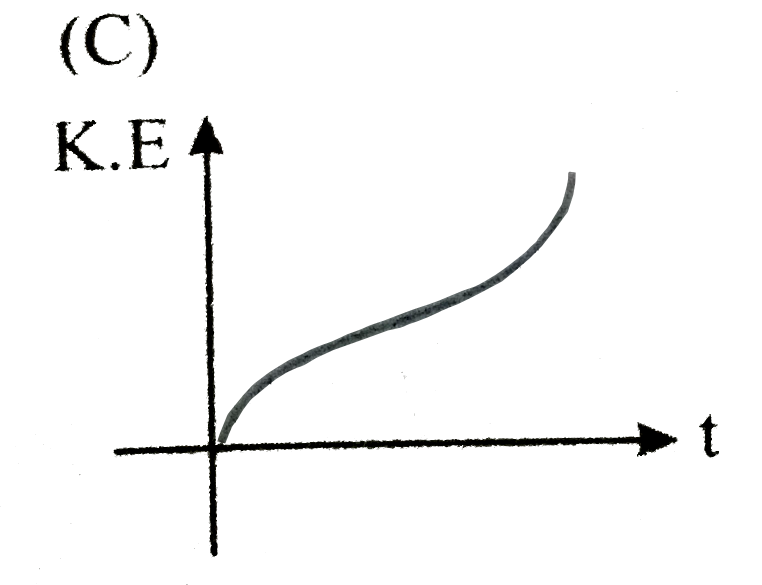 D
D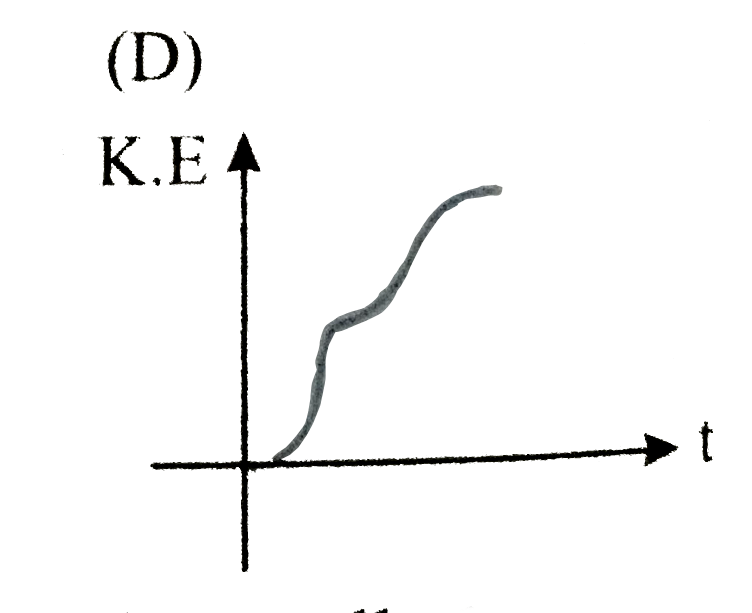
For a given acceleration − time graph, there exist ………………………… velocity − time graph
A1B2C3DmanyThe graph shown the variation with times t of the velocity v of an object . Which one of the following graphs best represents the variation of acceleration a of the object with time t?
 A
A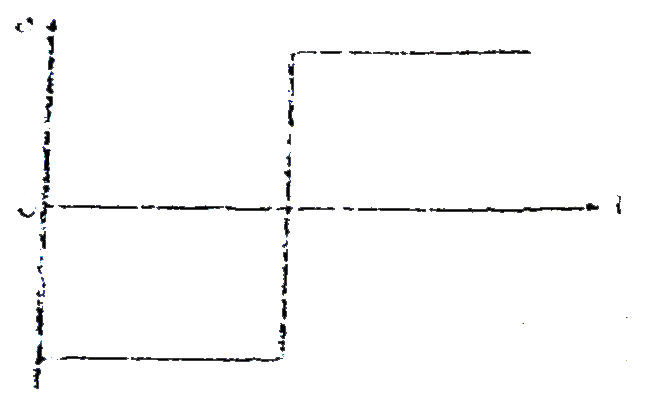 B
B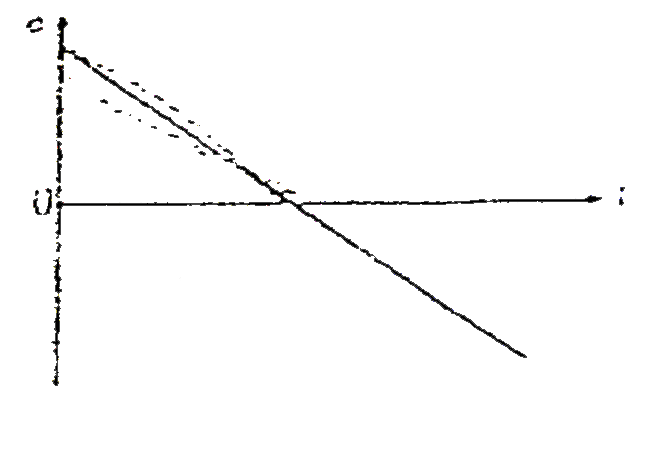 C
C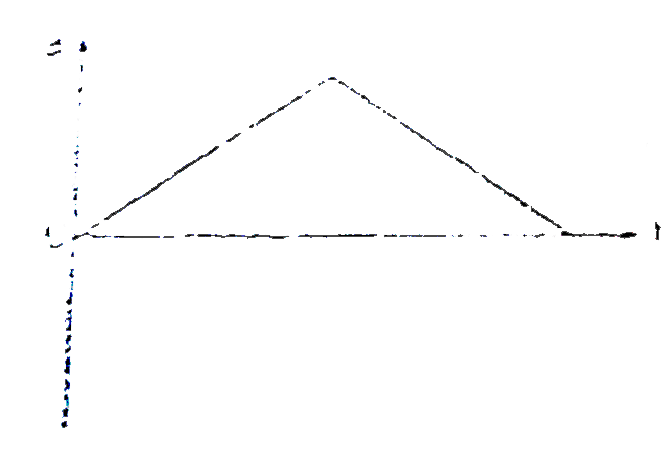 D
D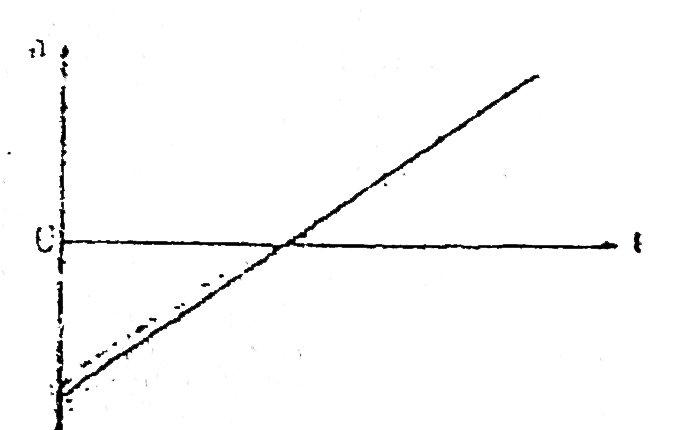
The velocity-time graph of an object is shown below. The acceleration of the object is
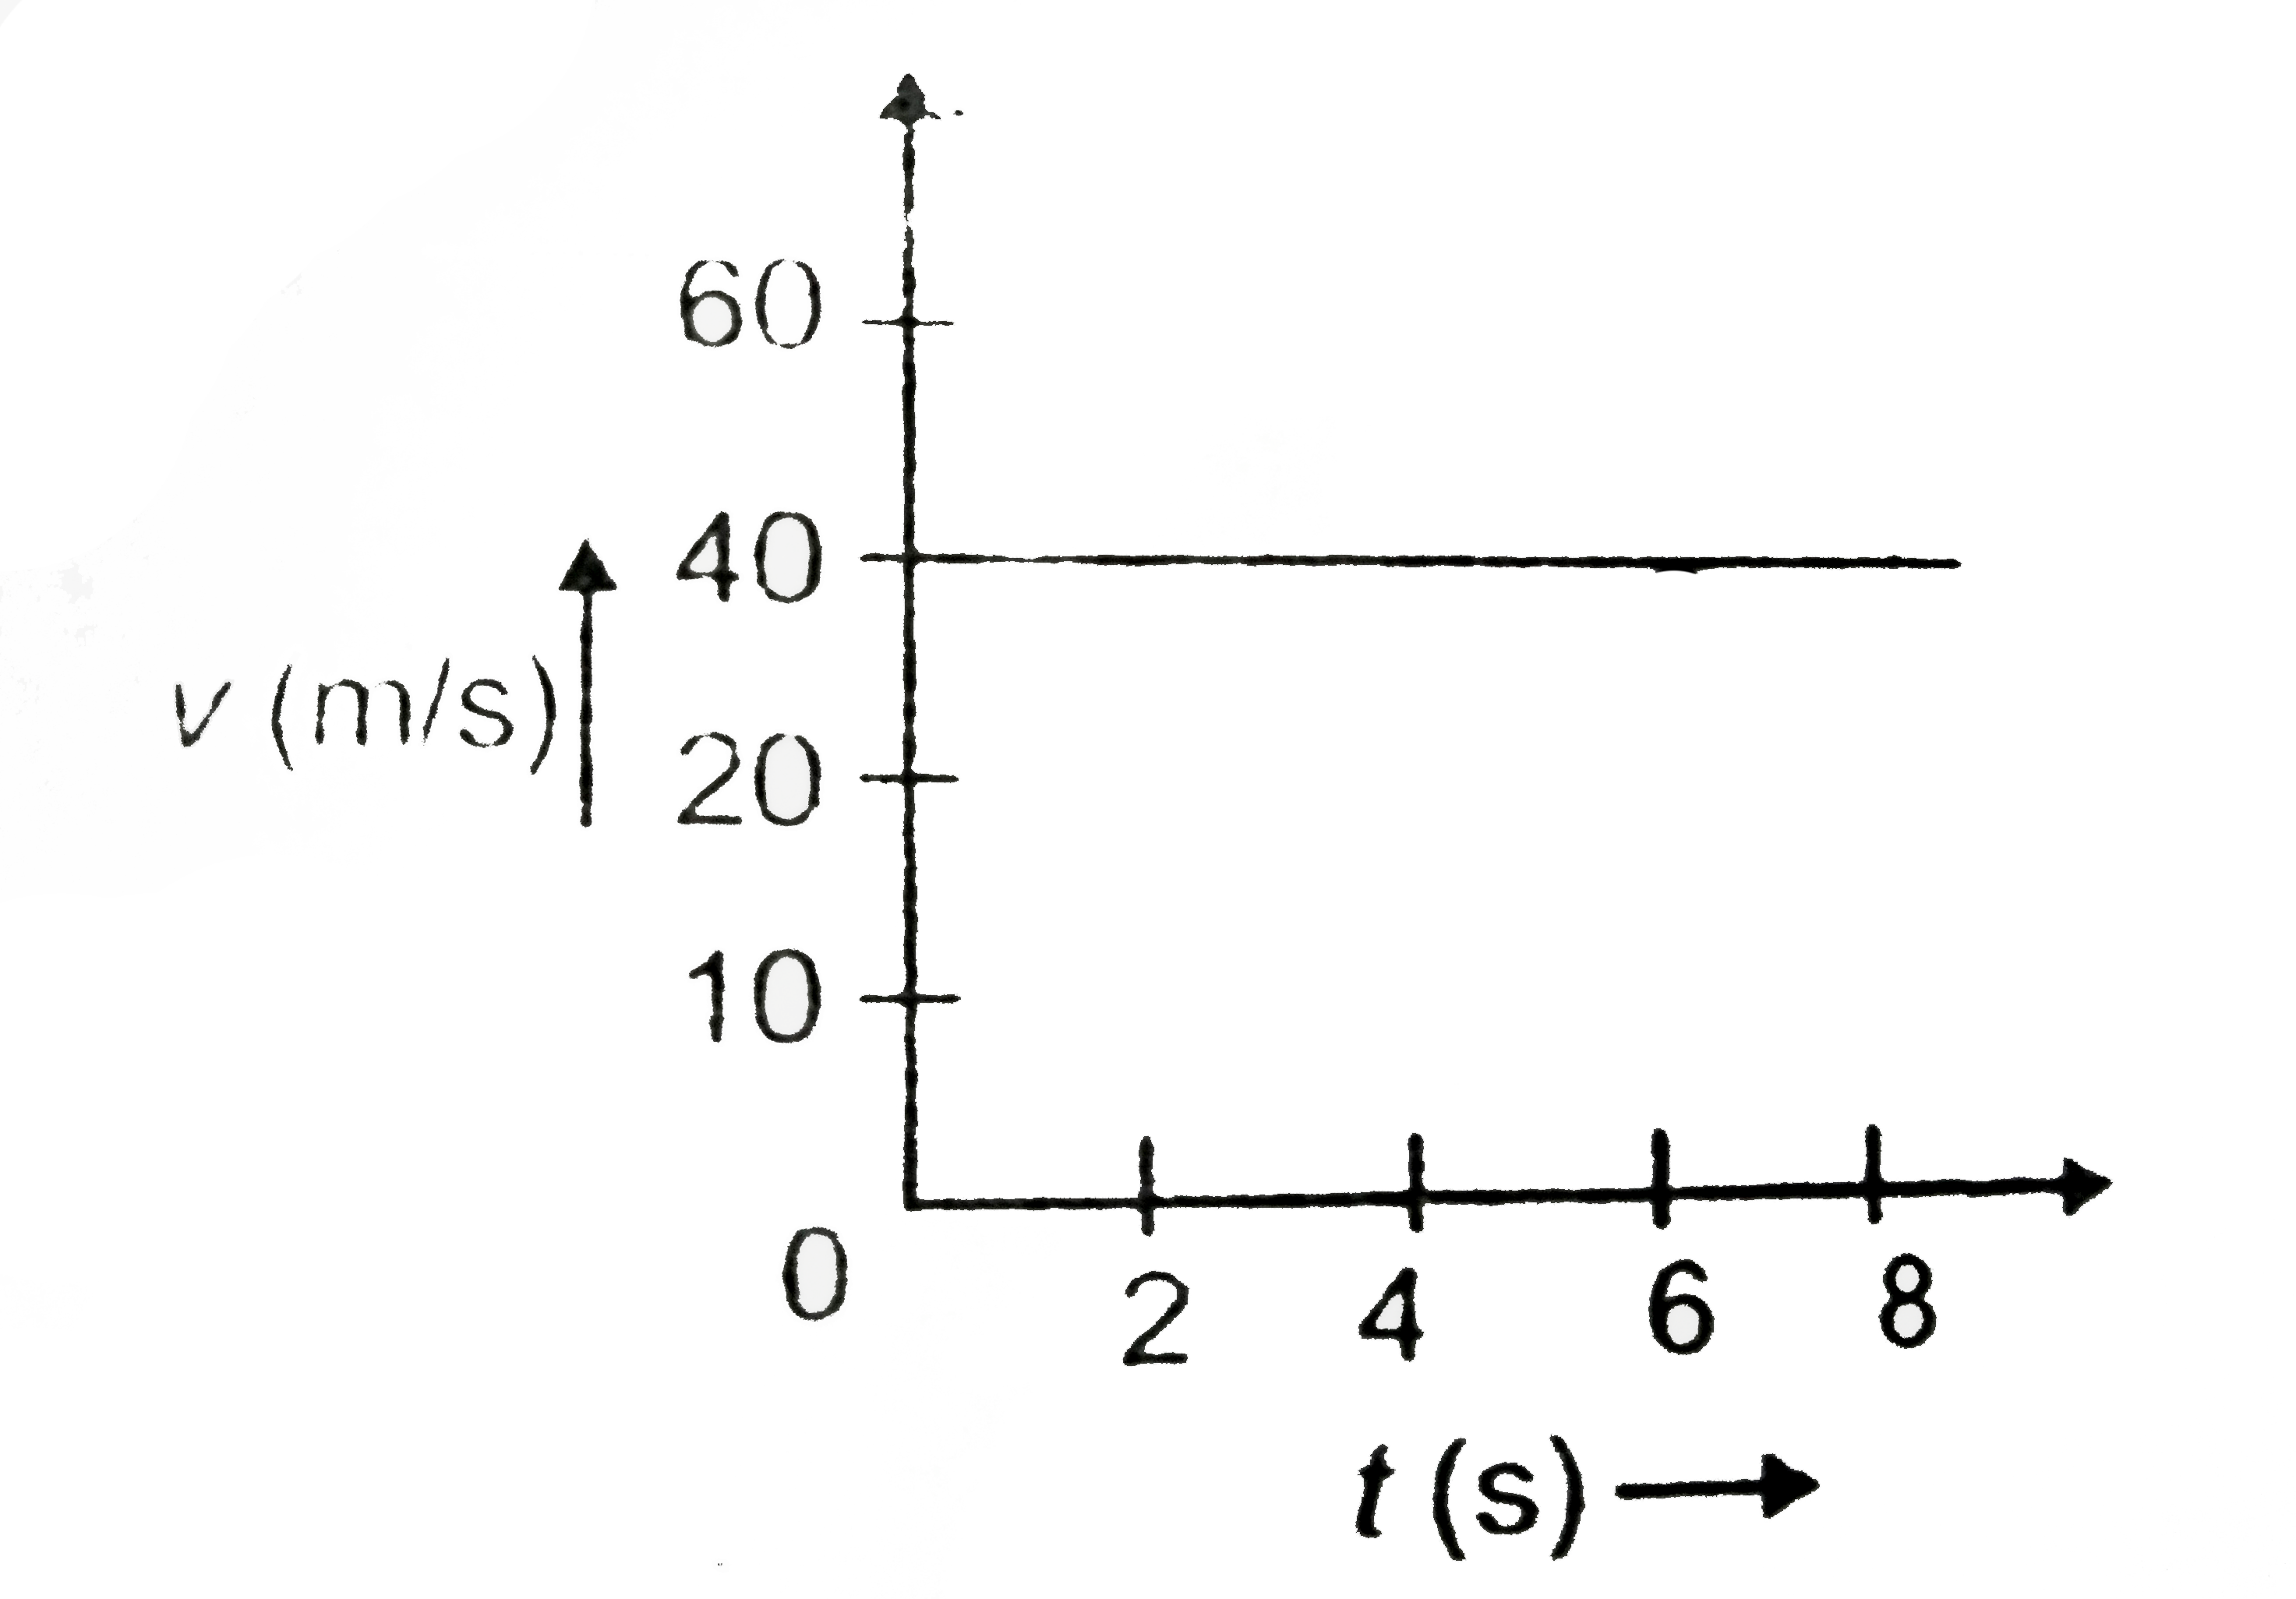
View SolutionThe velocity-time graph of an object is shown below. The acceleration of the object is

View SolutionWhich of the following position versus time graphs represents a a body at rest?
View SolutionThe ratio of velocity of two objects A and B is 1:3. It the position-time graph of object A is inclined to time axis at 30∘, then the position-time graph of object B is inclined to time axis at
View SolutionThe graph in figure shows the velocity v versus time t for a body. Which of the graphs shown in figure represents the corresponding acceleration versus time graphs ?
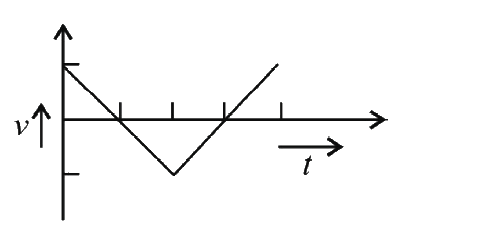
View Solution
