Which of the diagrams shown in figure. Most closely shows the variation inkinetic energy of the earth as it moves once around the sun in its elliptical orbit ?

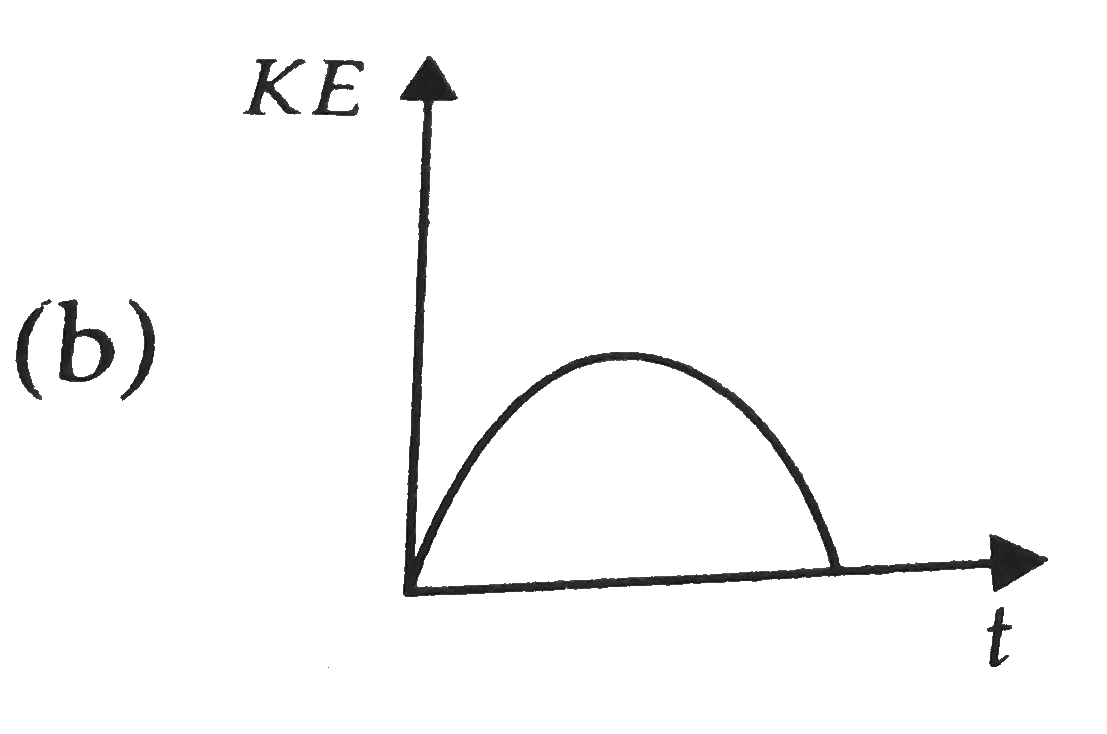
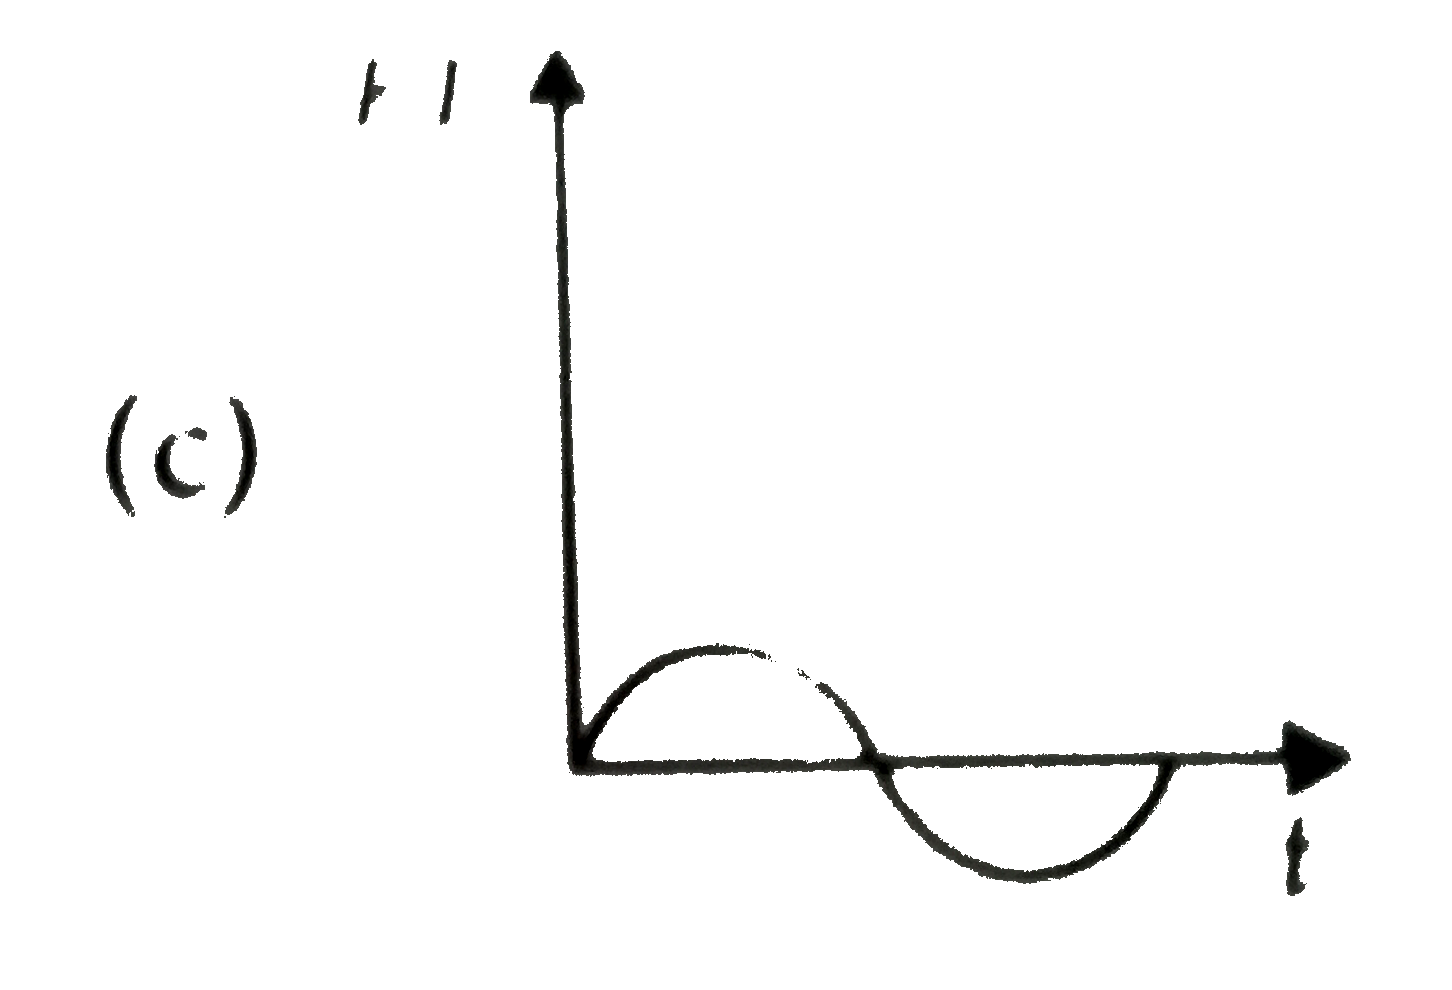
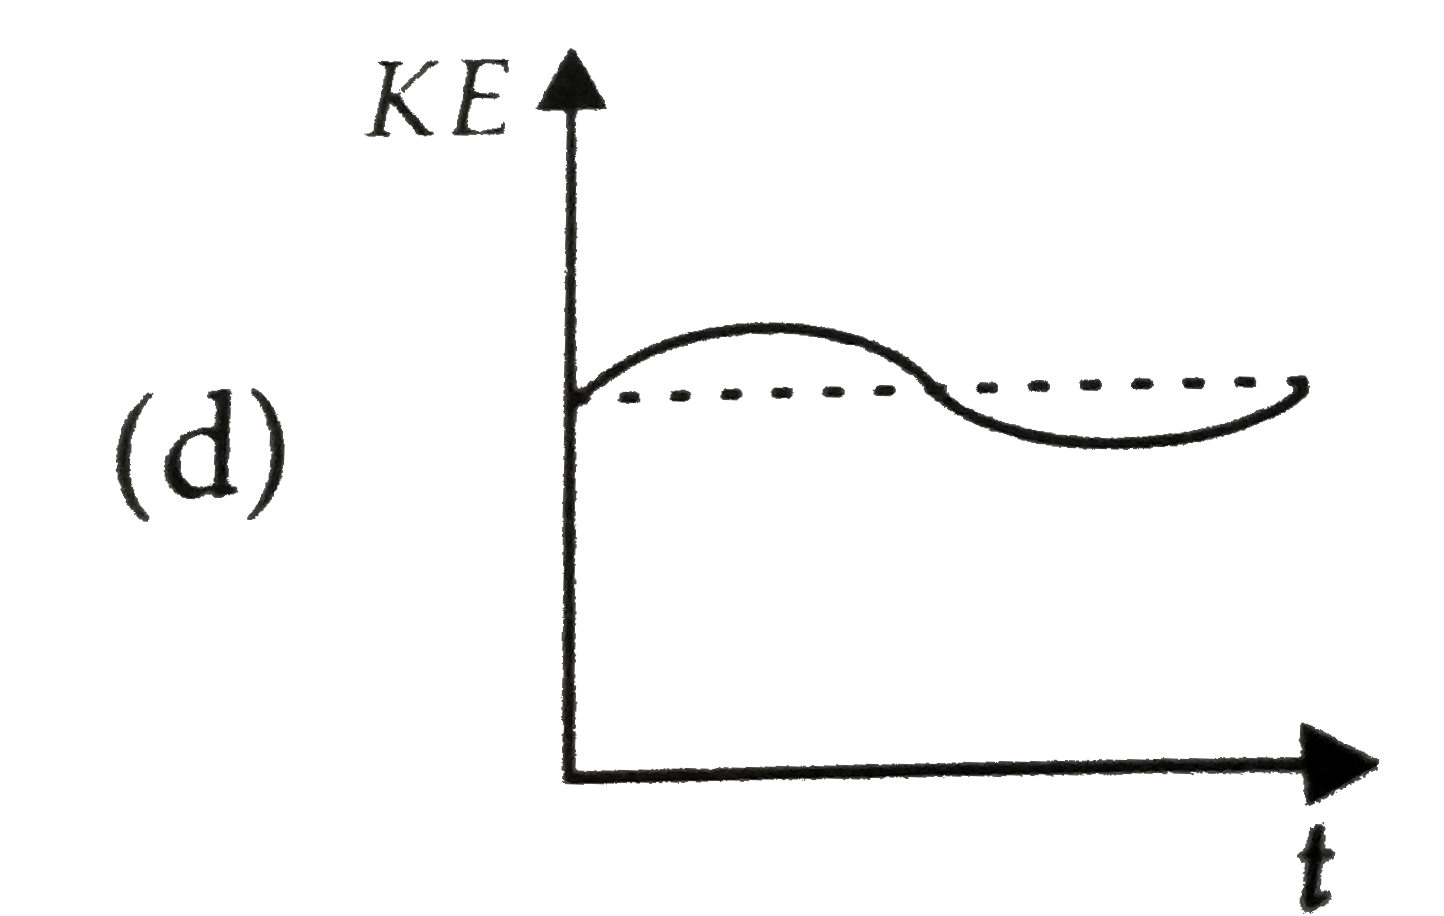
The correct Answer is:D
To determine the variation in kinetic energy of the Earth as it moves once around the Sun in its elliptical orbit, we can follow these steps:
Step 1: Understanding the Orbit
The Earth travels in an elliptical orbit around the Sun. In this orbit, there are two key points to consider:
- Perigee (P): The point where the Earth is closest to the Sun.
- Apogee (A): The point where the Earth is farthest from the Sun.
Step 2: Angular Momentum Conservation
The angular momentum of the Earth as it orbits the Sun is conserved. This means that the product of the radius and the velocity at these two points must be equal:
m⋅rP⋅vP=m⋅rA⋅vA
Where:
- m is the mass of the Earth (which cancels out),
- rP and rA are the distances from the Sun to the Earth at perigee and apogee, respectively,
- vP and vA are the velocities at perigee and apogee, respectively.
Step 3: Relating Distances and Velocities
From the conservation of angular momentum, we can derive:
rArP=vPvA
Since rA>rP, it follows that:
vP<vA
This means that the velocity of the Earth is greater at perigee than at apogee.
Step 4: Kinetic Energy Calculation
Kinetic energy (KE) is given by the formula:
KE=12mv2
From our previous step, since vP>vA, we can conclude:
- Kinetic energy at perigee (KEP) is greater than kinetic energy at apogee (KEA):
KEP>KEA
Step 5: Total Mechanical Energy Conservation
The total mechanical energy (TME) of the Earth-Sun system is conserved:
TME=KE+PE
Where PE is the potential energy. As the Earth moves closer to the Sun, potential energy decreases, and kinetic energy increases, and vice versa when moving away.
Step 6: Graphical Representation
From the above analysis, we can summarize:
- Kinetic energy is maximum at perigee and minimum at apogee.
- The kinetic energy will never be zero as the Earth is always in motion.
Conclusion
The correct graphical representation of the variation in kinetic energy as the Earth orbits the Sun is one that shows kinetic energy increasing as the Earth approaches the Sun (perigee) and decreasing as it moves away (apogee). Among the given options, the diagram that best represents this behavior is option D.
---
The Earth travels in an elliptical orbit around the Sun. In this orbit, there are two key points to consider:
- Perigee (P): The point where the Earth is closest to the Sun.
- Apogee (A): The point where the Earth is farthest from the Sun.
The angular momentum of the Earth as it orbits the Sun is conserved. This means that the product of the radius and the velocity at these two points must be equal:
m⋅rP⋅vP=m⋅rA⋅vA
Where:
- m is the mass of the Earth (which cancels out),
- rP and rA are the distances from the Sun to the Earth at perigee and apogee, respectively,
- vP and vA are the velocities at perigee and apogee, respectively.
From the conservation of angular momentum, we can derive:
rArP=vPvA
Since rA>rP, it follows that:
vP<vA
This means that the velocity of the Earth is greater at perigee than at apogee.
Kinetic energy (KE) is given by the formula:
KE=12mv2
From our previous step, since vP>vA, we can conclude:
- Kinetic energy at perigee (KEP) is greater than kinetic energy at apogee (KEA):
KEP>KEA
The total mechanical energy (TME) of the Earth-Sun system is conserved:
TME=KE+PE
Where PE is the potential energy. As the Earth moves closer to the Sun, potential energy decreases, and kinetic energy increases, and vice versa when moving away.
From the above analysis, we can summarize:
- Kinetic energy is maximum at perigee and minimum at apogee.
- The kinetic energy will never be zero as the Earth is always in motion.
The correct graphical representation of the variation in kinetic energy as the Earth orbits the Sun is one that shows kinetic energy increasing as the Earth approaches the Sun (perigee) and decreasing as it moves away (apogee). Among the given options, the diagram that best represents this behavior is option D.
Topper's Solved these Questions
- BOOK - NCERT FINGERTPS ENGLISHCHAPTER - WORK , ENERGY AND POWEREXERCISE - ASSERTION & REASON15videos
WORK , ENERGY AND POWER
- BOOK - NCERT FINGERTPS ENGLISHCHAPTER - WORK , ENERGY AND POWEREXERCISE - Motion Of Work And Kinetic Energy : The Work-Energy Theorem4videos
WORK , ENERGY AND POWER
- BOOK - NCERT FINGERTPS ENGLISHCHAPTER - WORK , ENERGY AND POWEREXERCISE - Assertion And Reason15videos
WORK , ENERGY AND POWER
- BOOK - NCERT FINGERTPS ENGLISHCHAPTER - WAVESEXERCISE - Assertion And Reason15videos
WAVES
Similar Questions
Knowledge Check
- Question 1 - Select One
Which of the diagram shown in figures respresents variation of total mechanical energy of a pendulam oscillation in air as function of time?
A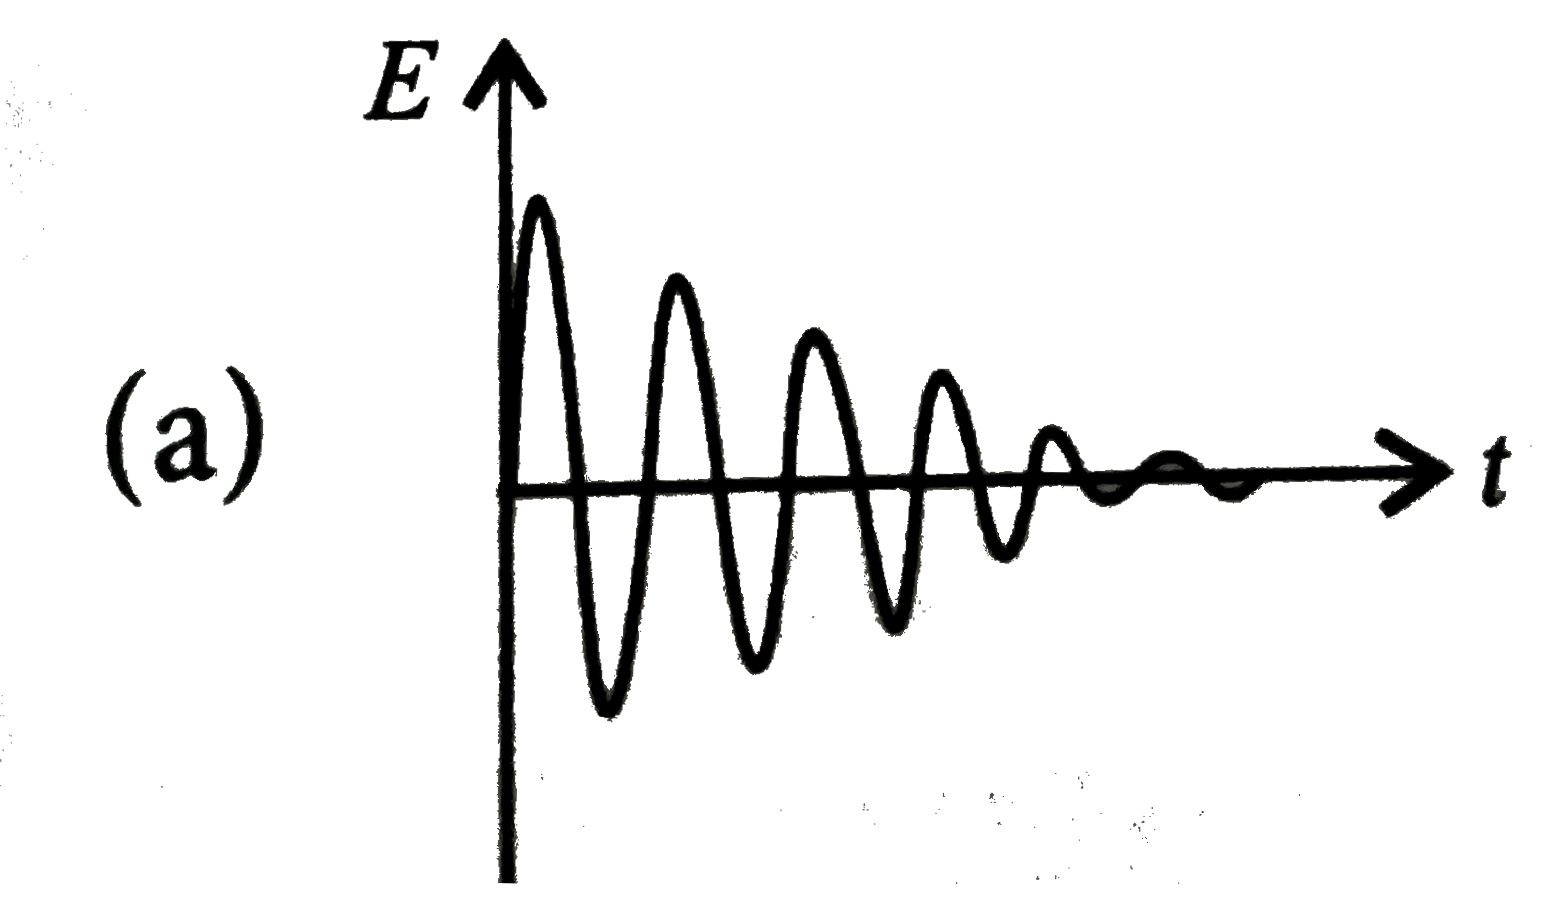 B
B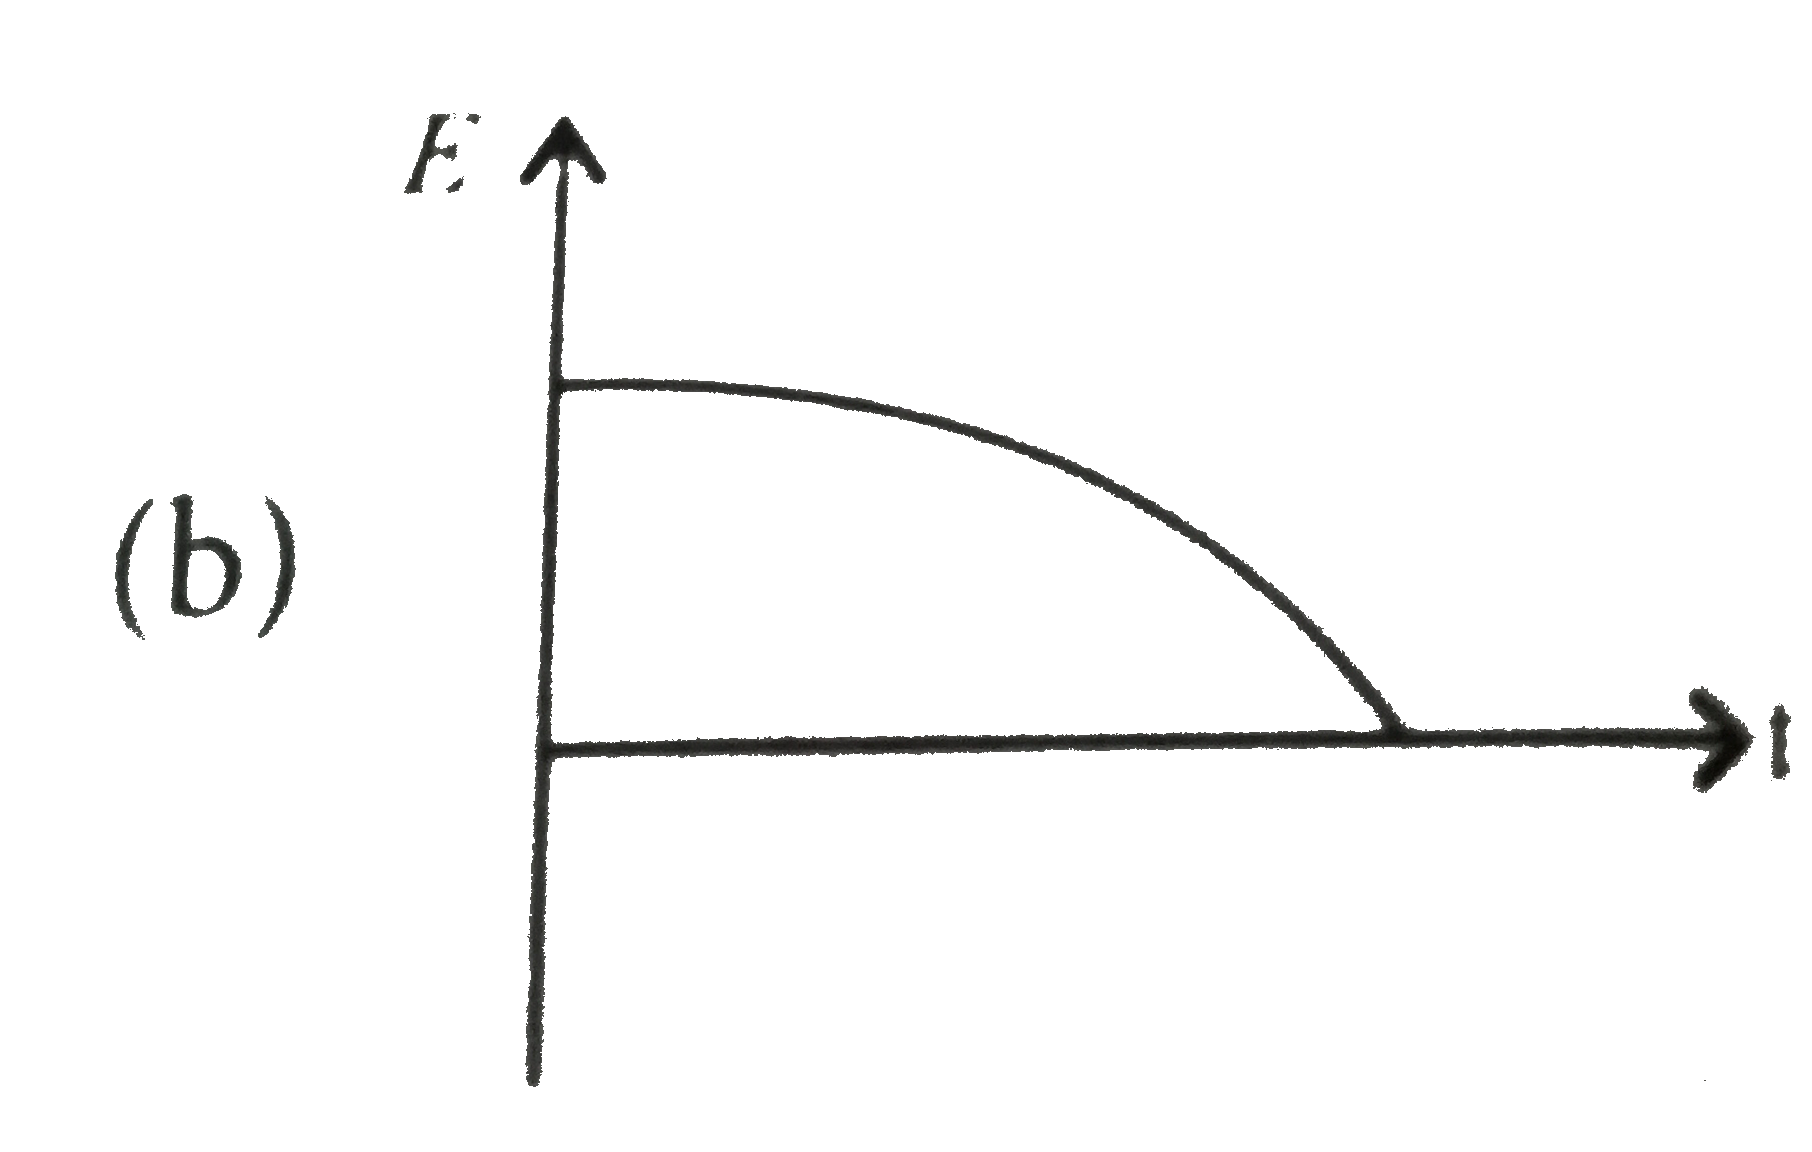 C
C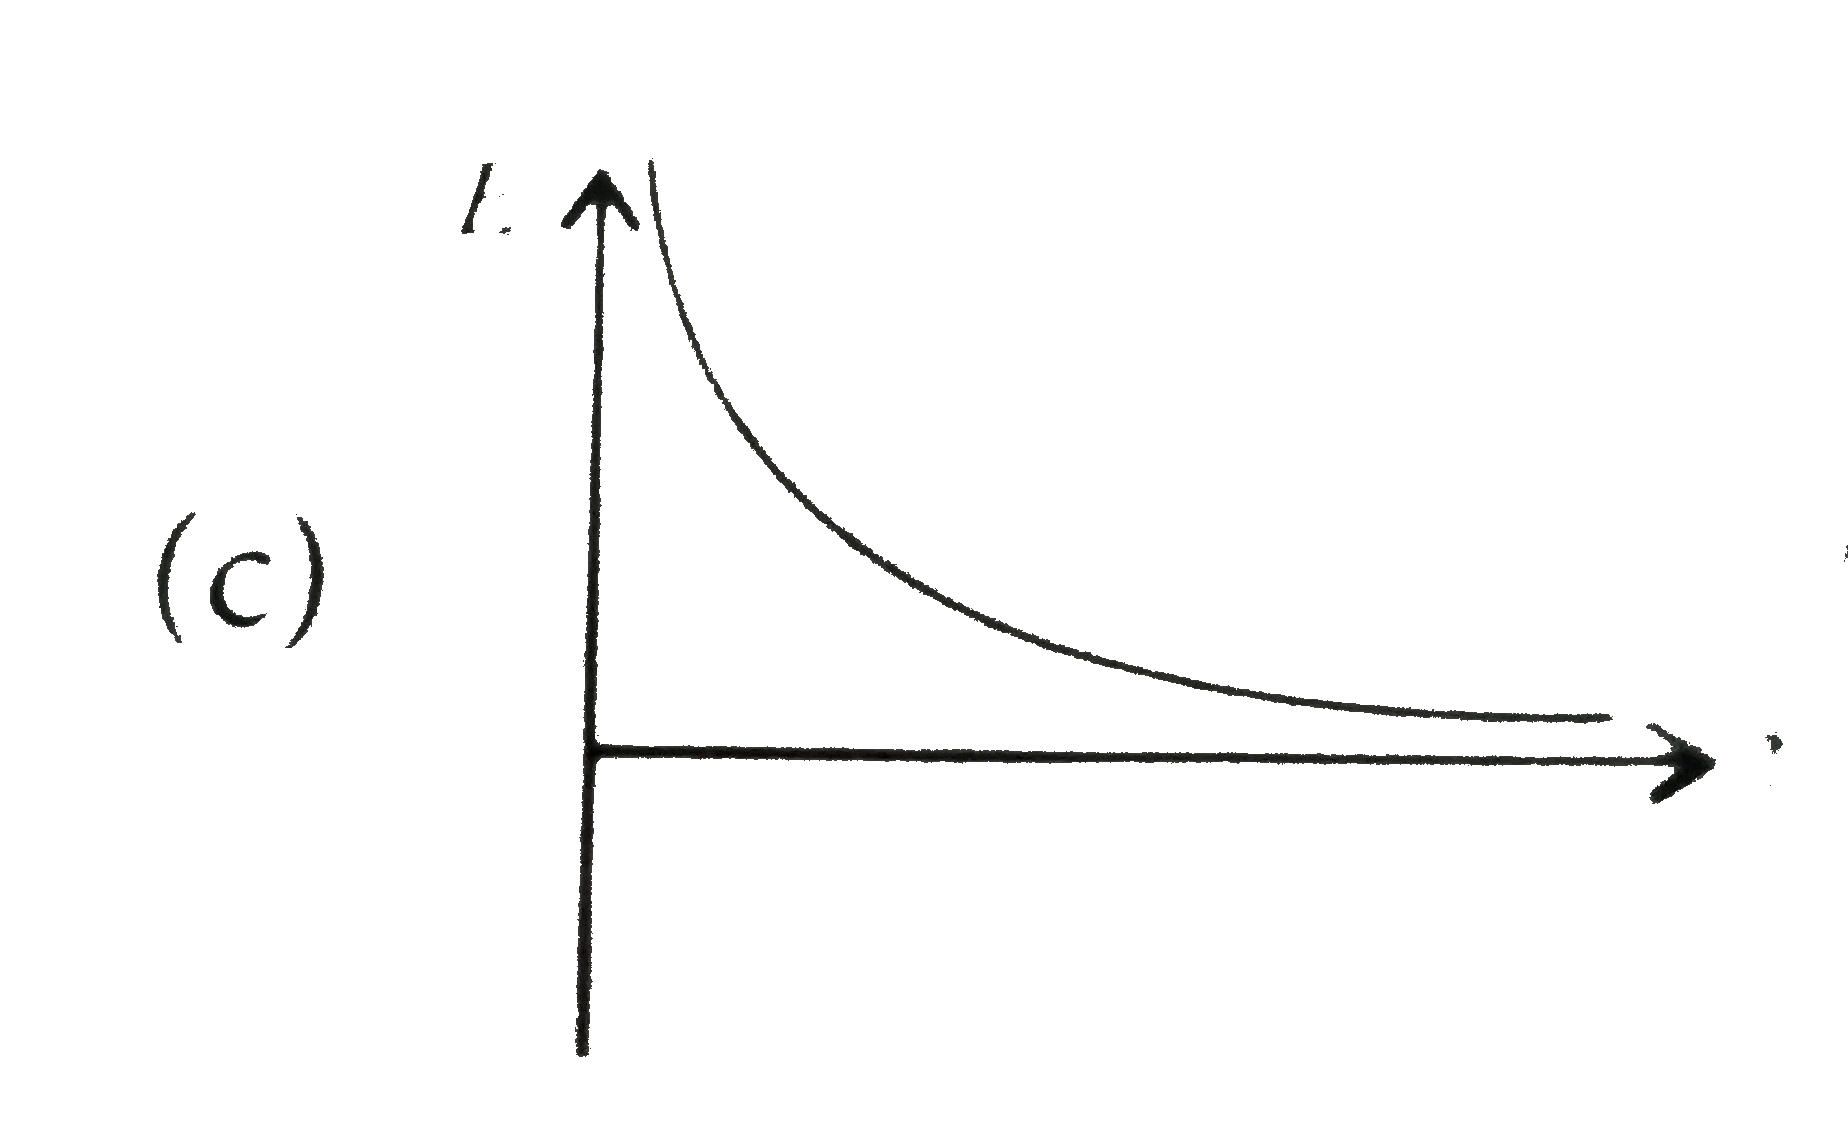 D
D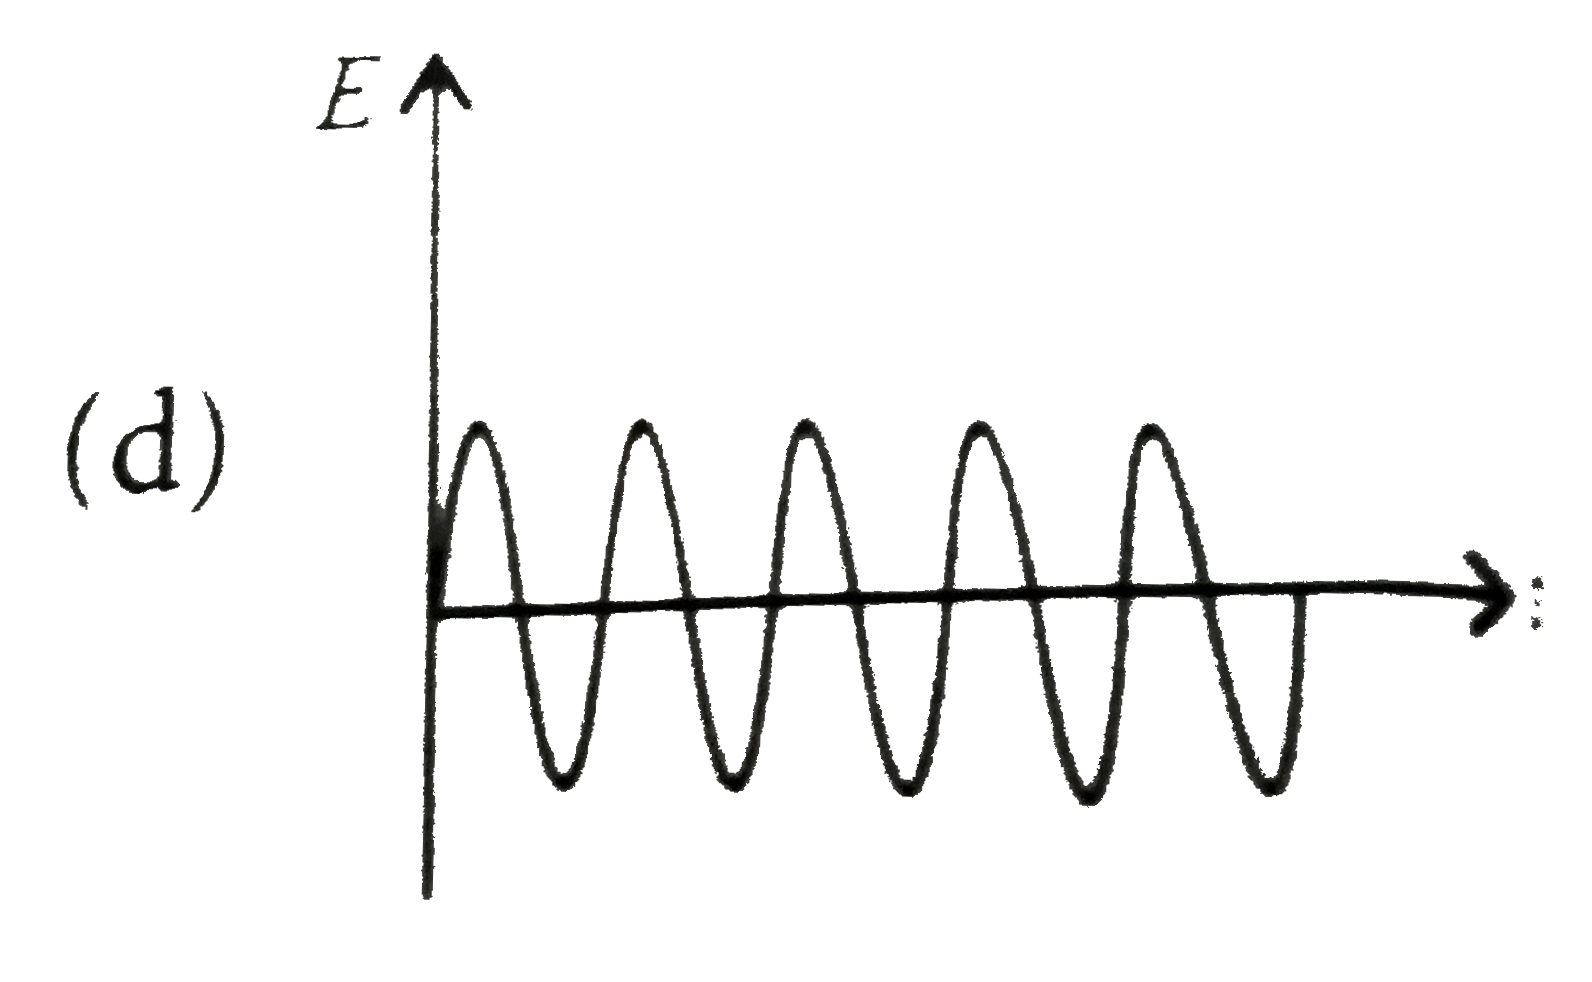
Which of the energy band diagrams shown in the figure corresponds to that of a semiconductor?
View SolutionWhich of the following statements are correct about a satellite moving around a planet in an elliptical orbit ?
View SolutionThe potential energy U(x) of a particle moving along x−axis is shown in figure. Which one of the following graphs represents the variation of kinetic energy of this particel if its total mechanical enery is E0
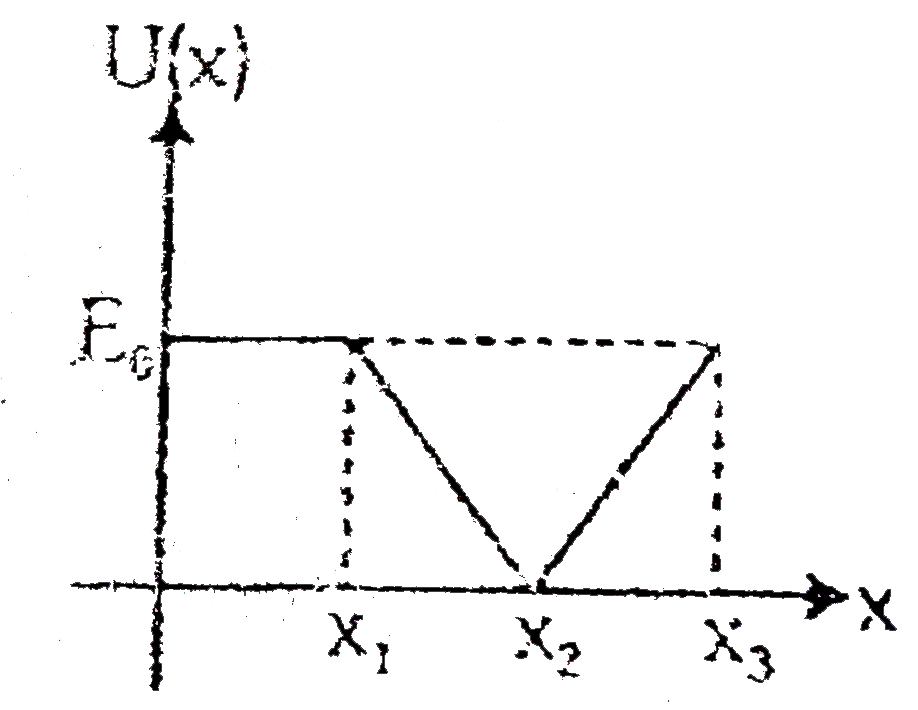 View Solution
For a satellite moving in an orbit around the earth, ratio of kinetic energy to potential energy is
View SolutionA satellite of mass m is in an elliptical orbit around the earth of mass M(M>>m) the speed of the satellite at its nearest point ot the earth (perigee) is √6GM5R where R= its closest distance to the earth it is desired to transfer this satellite into a circular orbit around the earth of radius equal its largest distance from the earth. Find the increase in its speed to be imparted at the apogee (farthest point on the elliptical orbit).
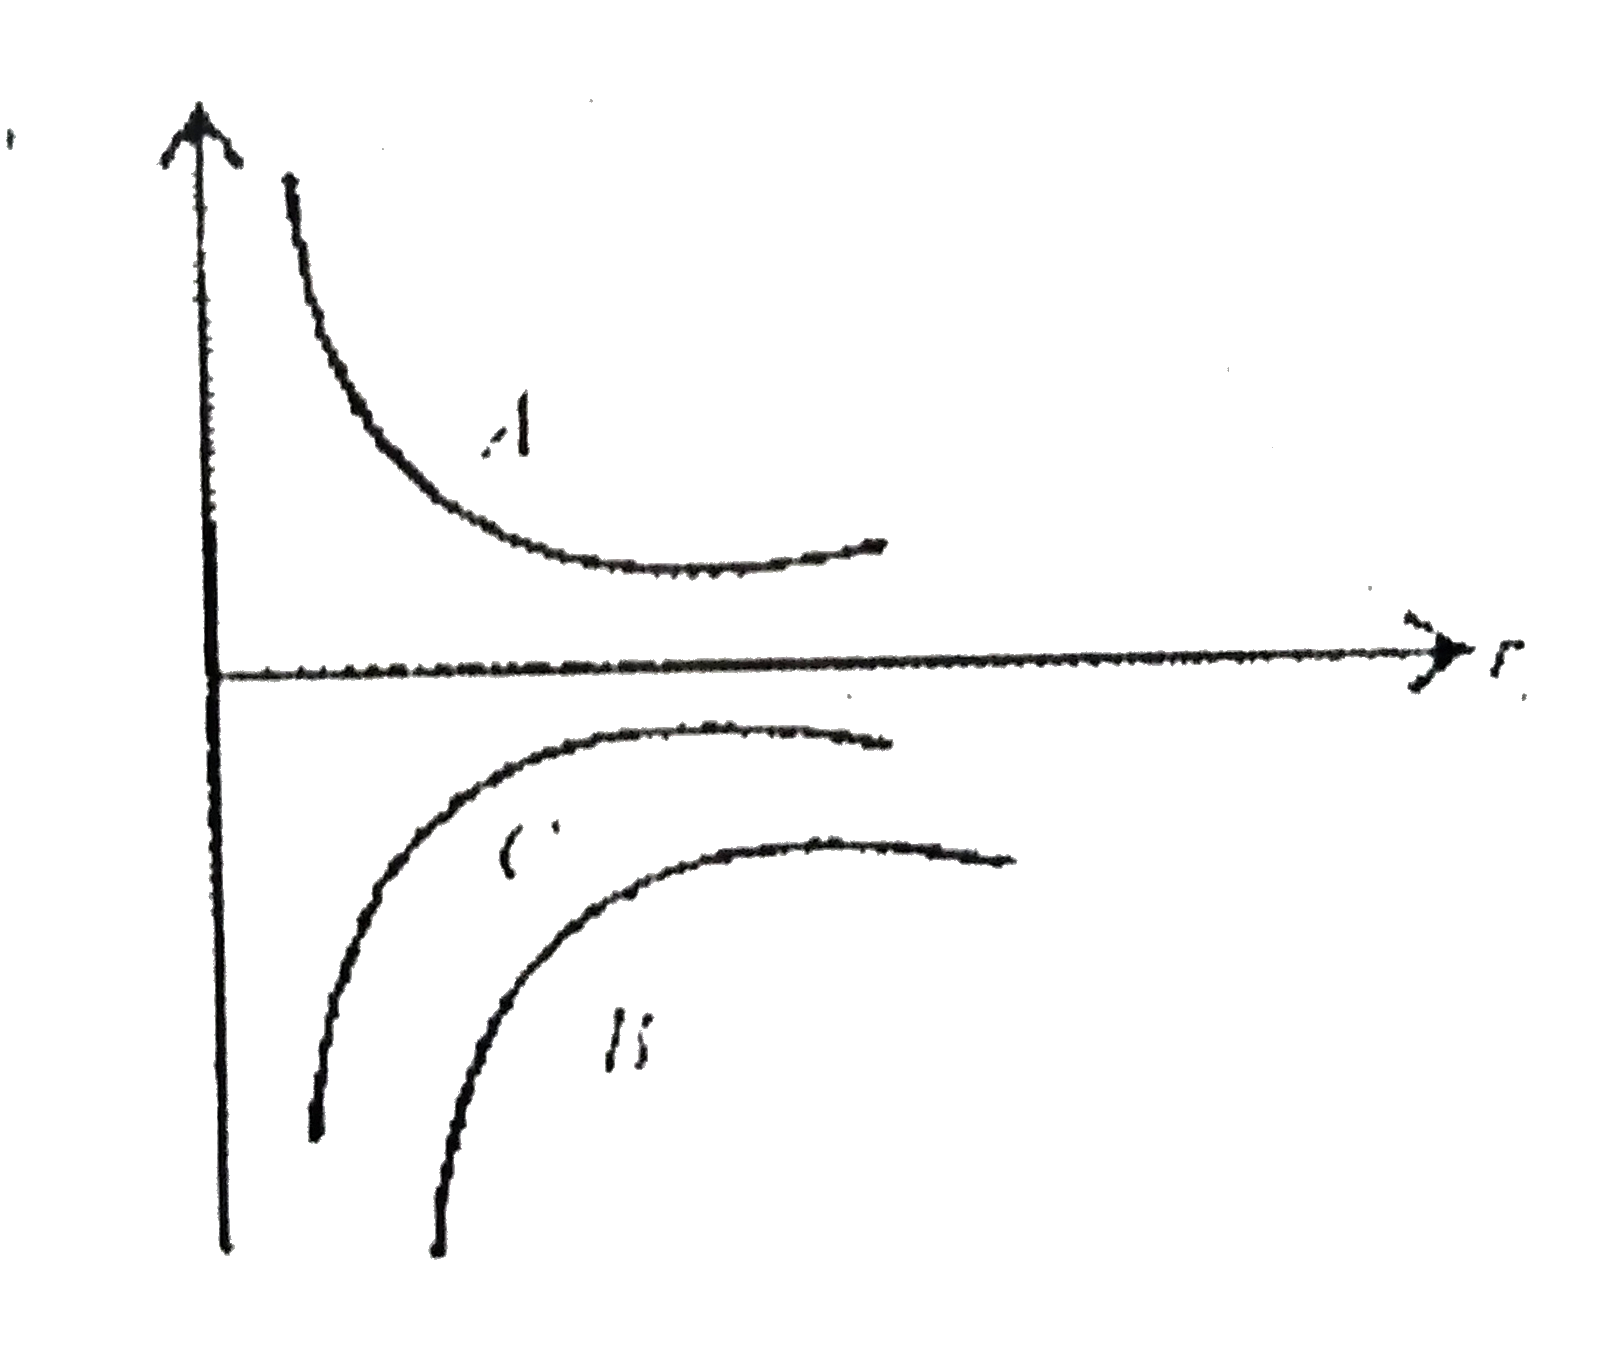
View SolutionFigure shows the variation of energy with the orbit radius r of a satellite in a circular motion. Mark the correct statement.
 View Solution
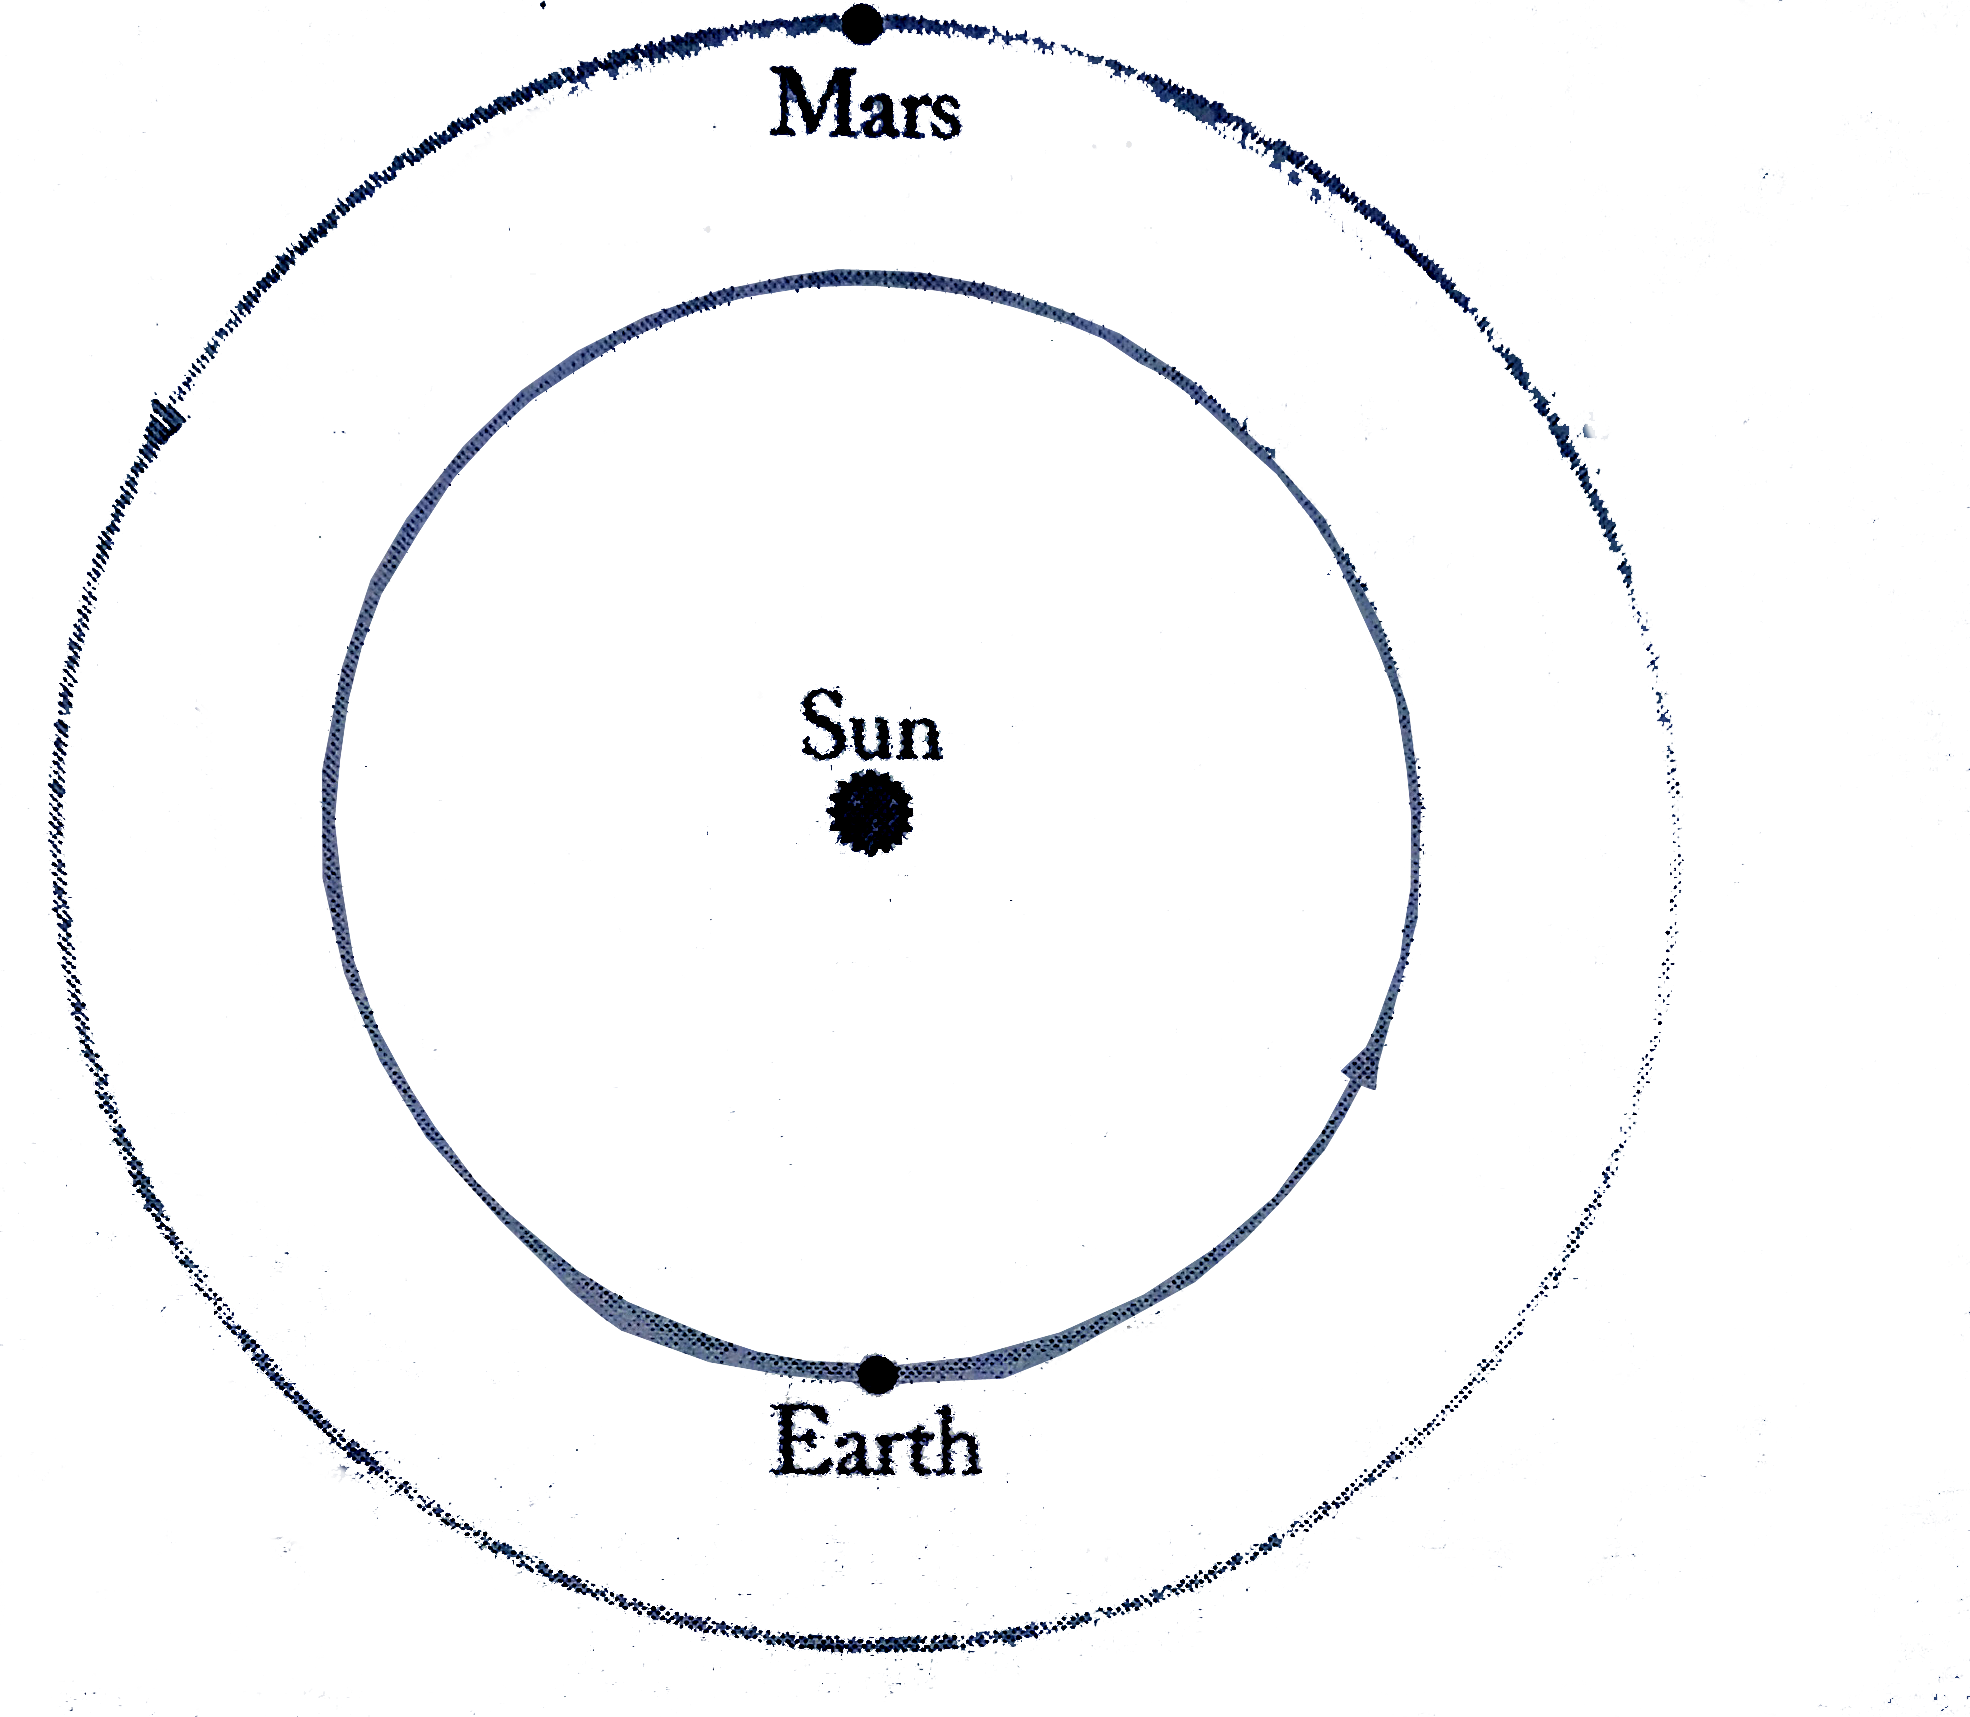
The Earth has a circular orbit of radius r and period t around the sum, Mars has a circular orbit of radius R and period T. In order to send a spacecraft from the Earth to Mars, it is convenient to launch the spacecraft inot an elliptical orbit whose perihelion coincides with the orbit of the Earth and whose aphelion coincides with the orbit of Mars, this orbit requires the least amount of energy for a trip to Mars. The time t' taken by a spacecraft to reach Mars from the Earth satisfies:
 View Solution

