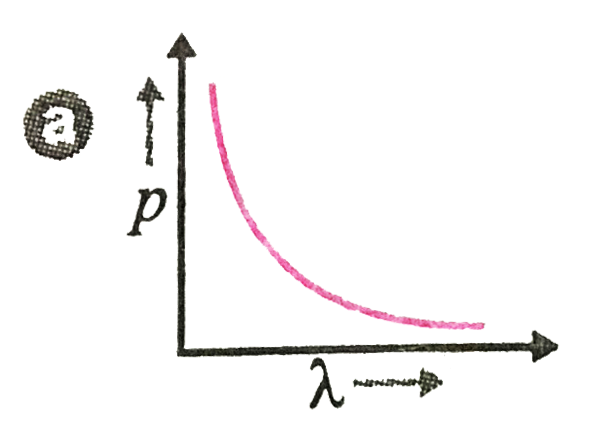
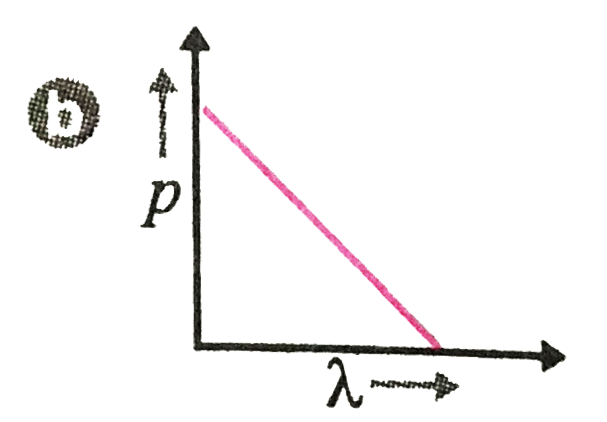
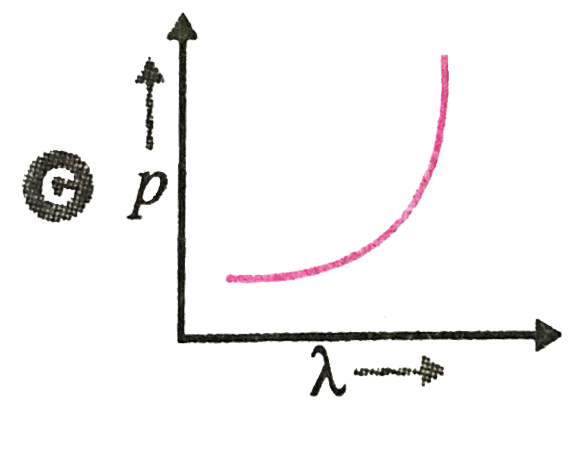
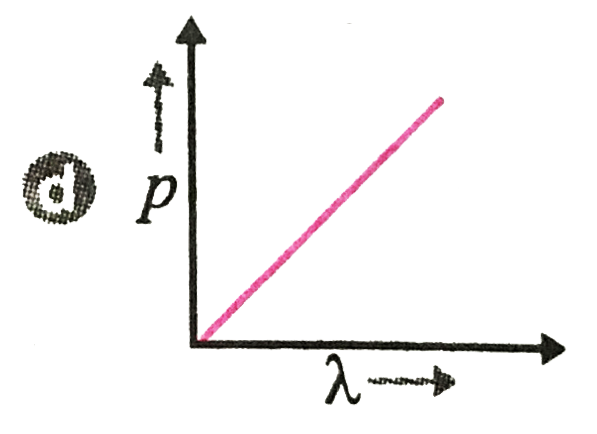
Which of the following figure represents the variation of particle momentum and the associated de - Broglie wavelength ?
A
B
C
D
Video Solution
Text Solution
The correct Answer is:a
As, p=hλ So p∝1λ, so graph between λ and p is rectangular hyperbola,
|
Topper's Solved these Questions
- DUAL NATURE OF RADIATION AND MATTERBOOK - PRADEEPCHAPTER - DUAL NATURE OF RADIATION AND MATTEREXERCISE - Value based question
1 Videos
- CURRENT ELECTRICITYBOOK - PRADEEPCHAPTER - CURRENT ELECTRICITYEXERCISE - Problems for Practice (B)
2 Videos
- ELECTROMAGNETIC INDUCTION & ALTERNATING CURRENTBOOK - PRADEEPCHAPTER - ELECTROMAGNETIC INDUCTION & ALTERNATING CURRENTEXERCISE - Multiple Choice Questions
1 Videos
Similar Questions
Knowledge Check
Which of the following figure represents the variation of particle momentum and the associated de - Broglie wavelength ?
A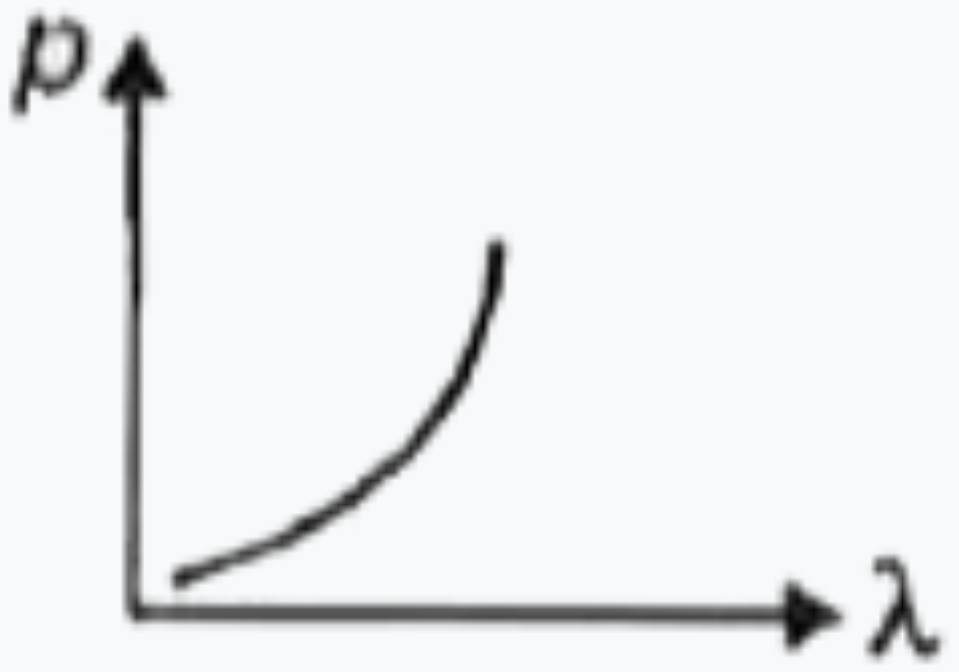 B
B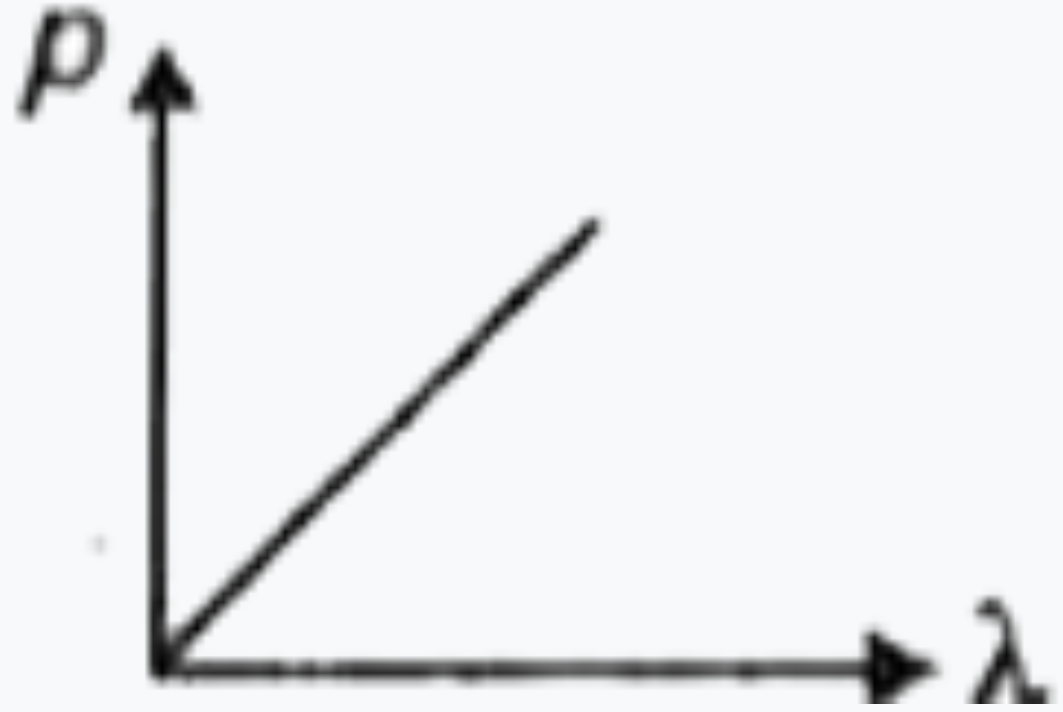 C
C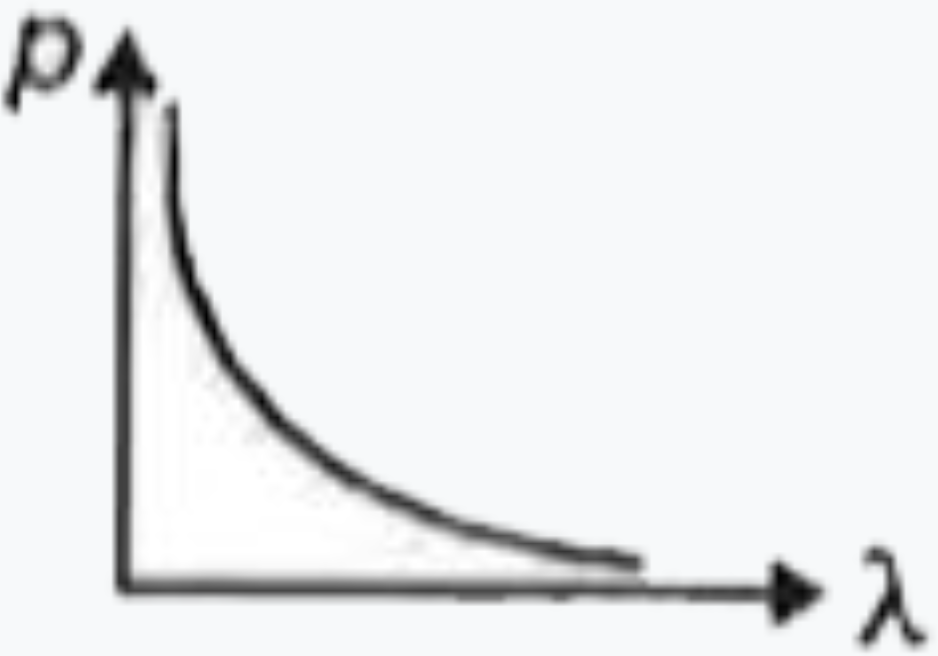 D
D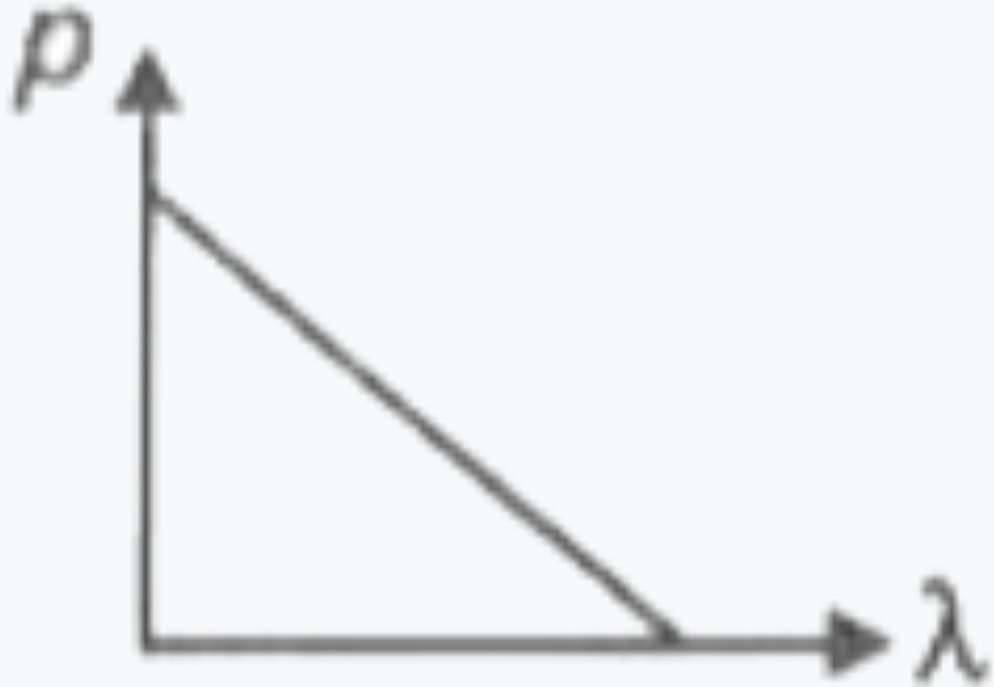
Which of the following graph represent the variation of particle momentum and associated de Broglie wavelength?
A B
B C
C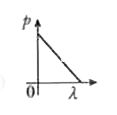 D
D
Which of the following graphs correctly represents the variation of particle momentum with associated de Broglie wavelength?
A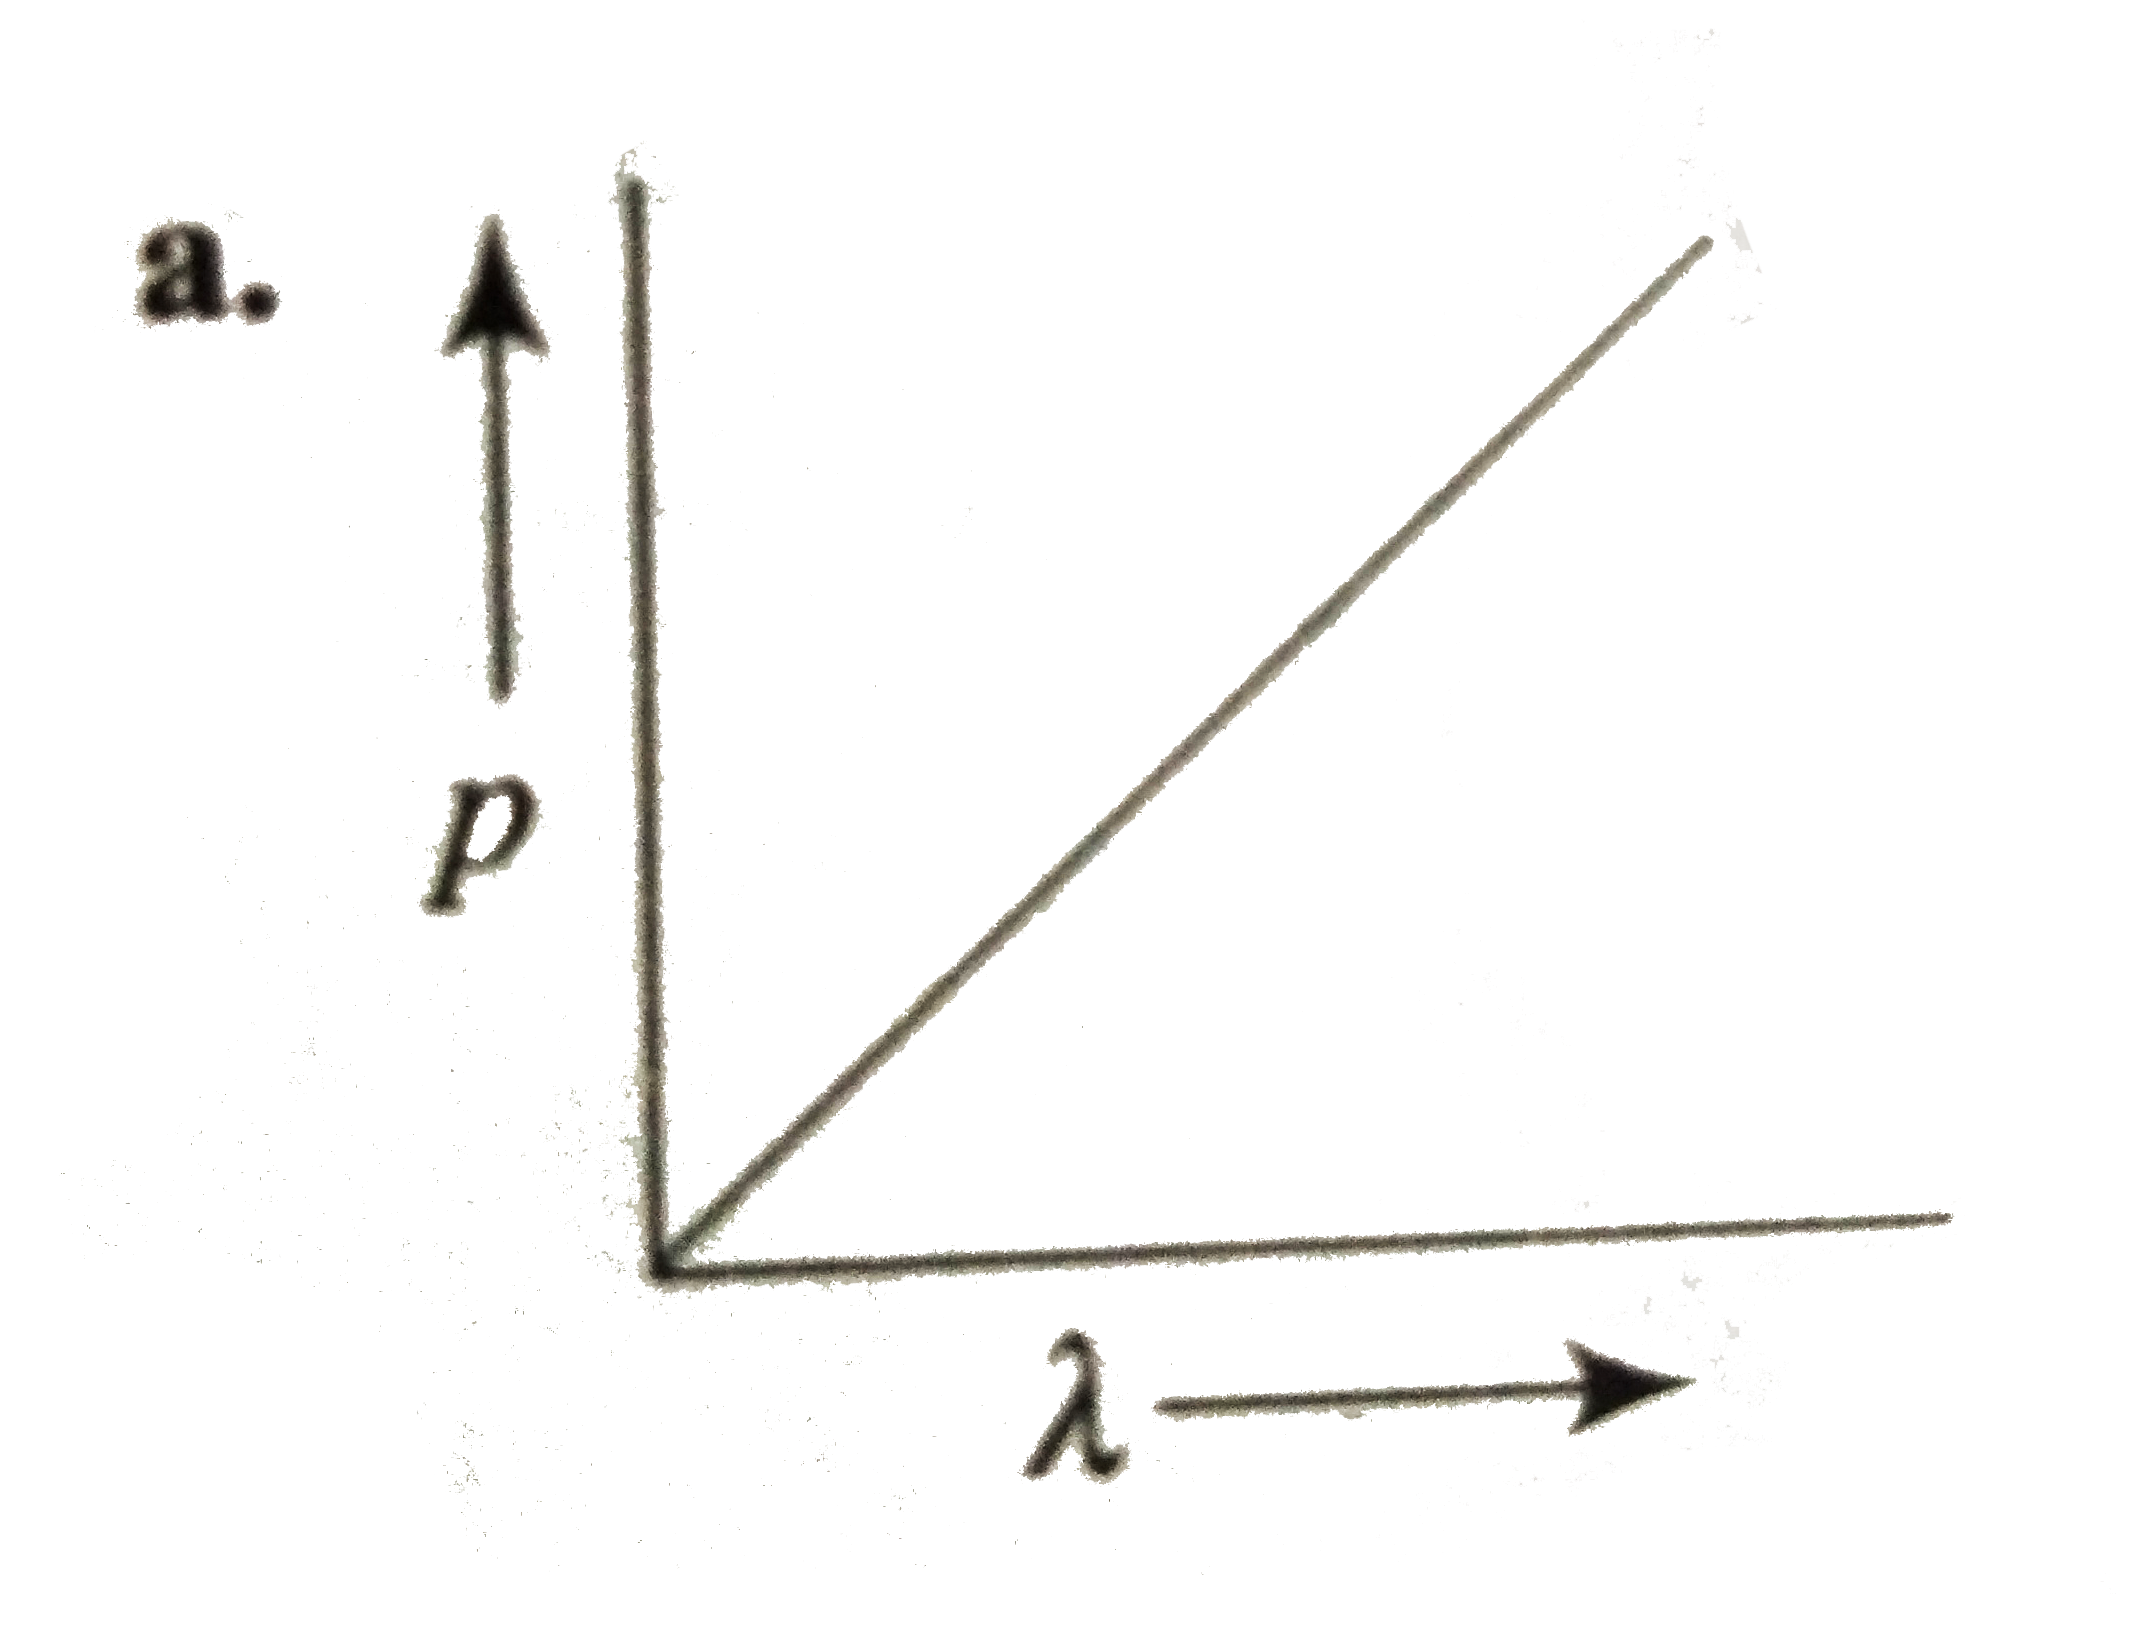 B
B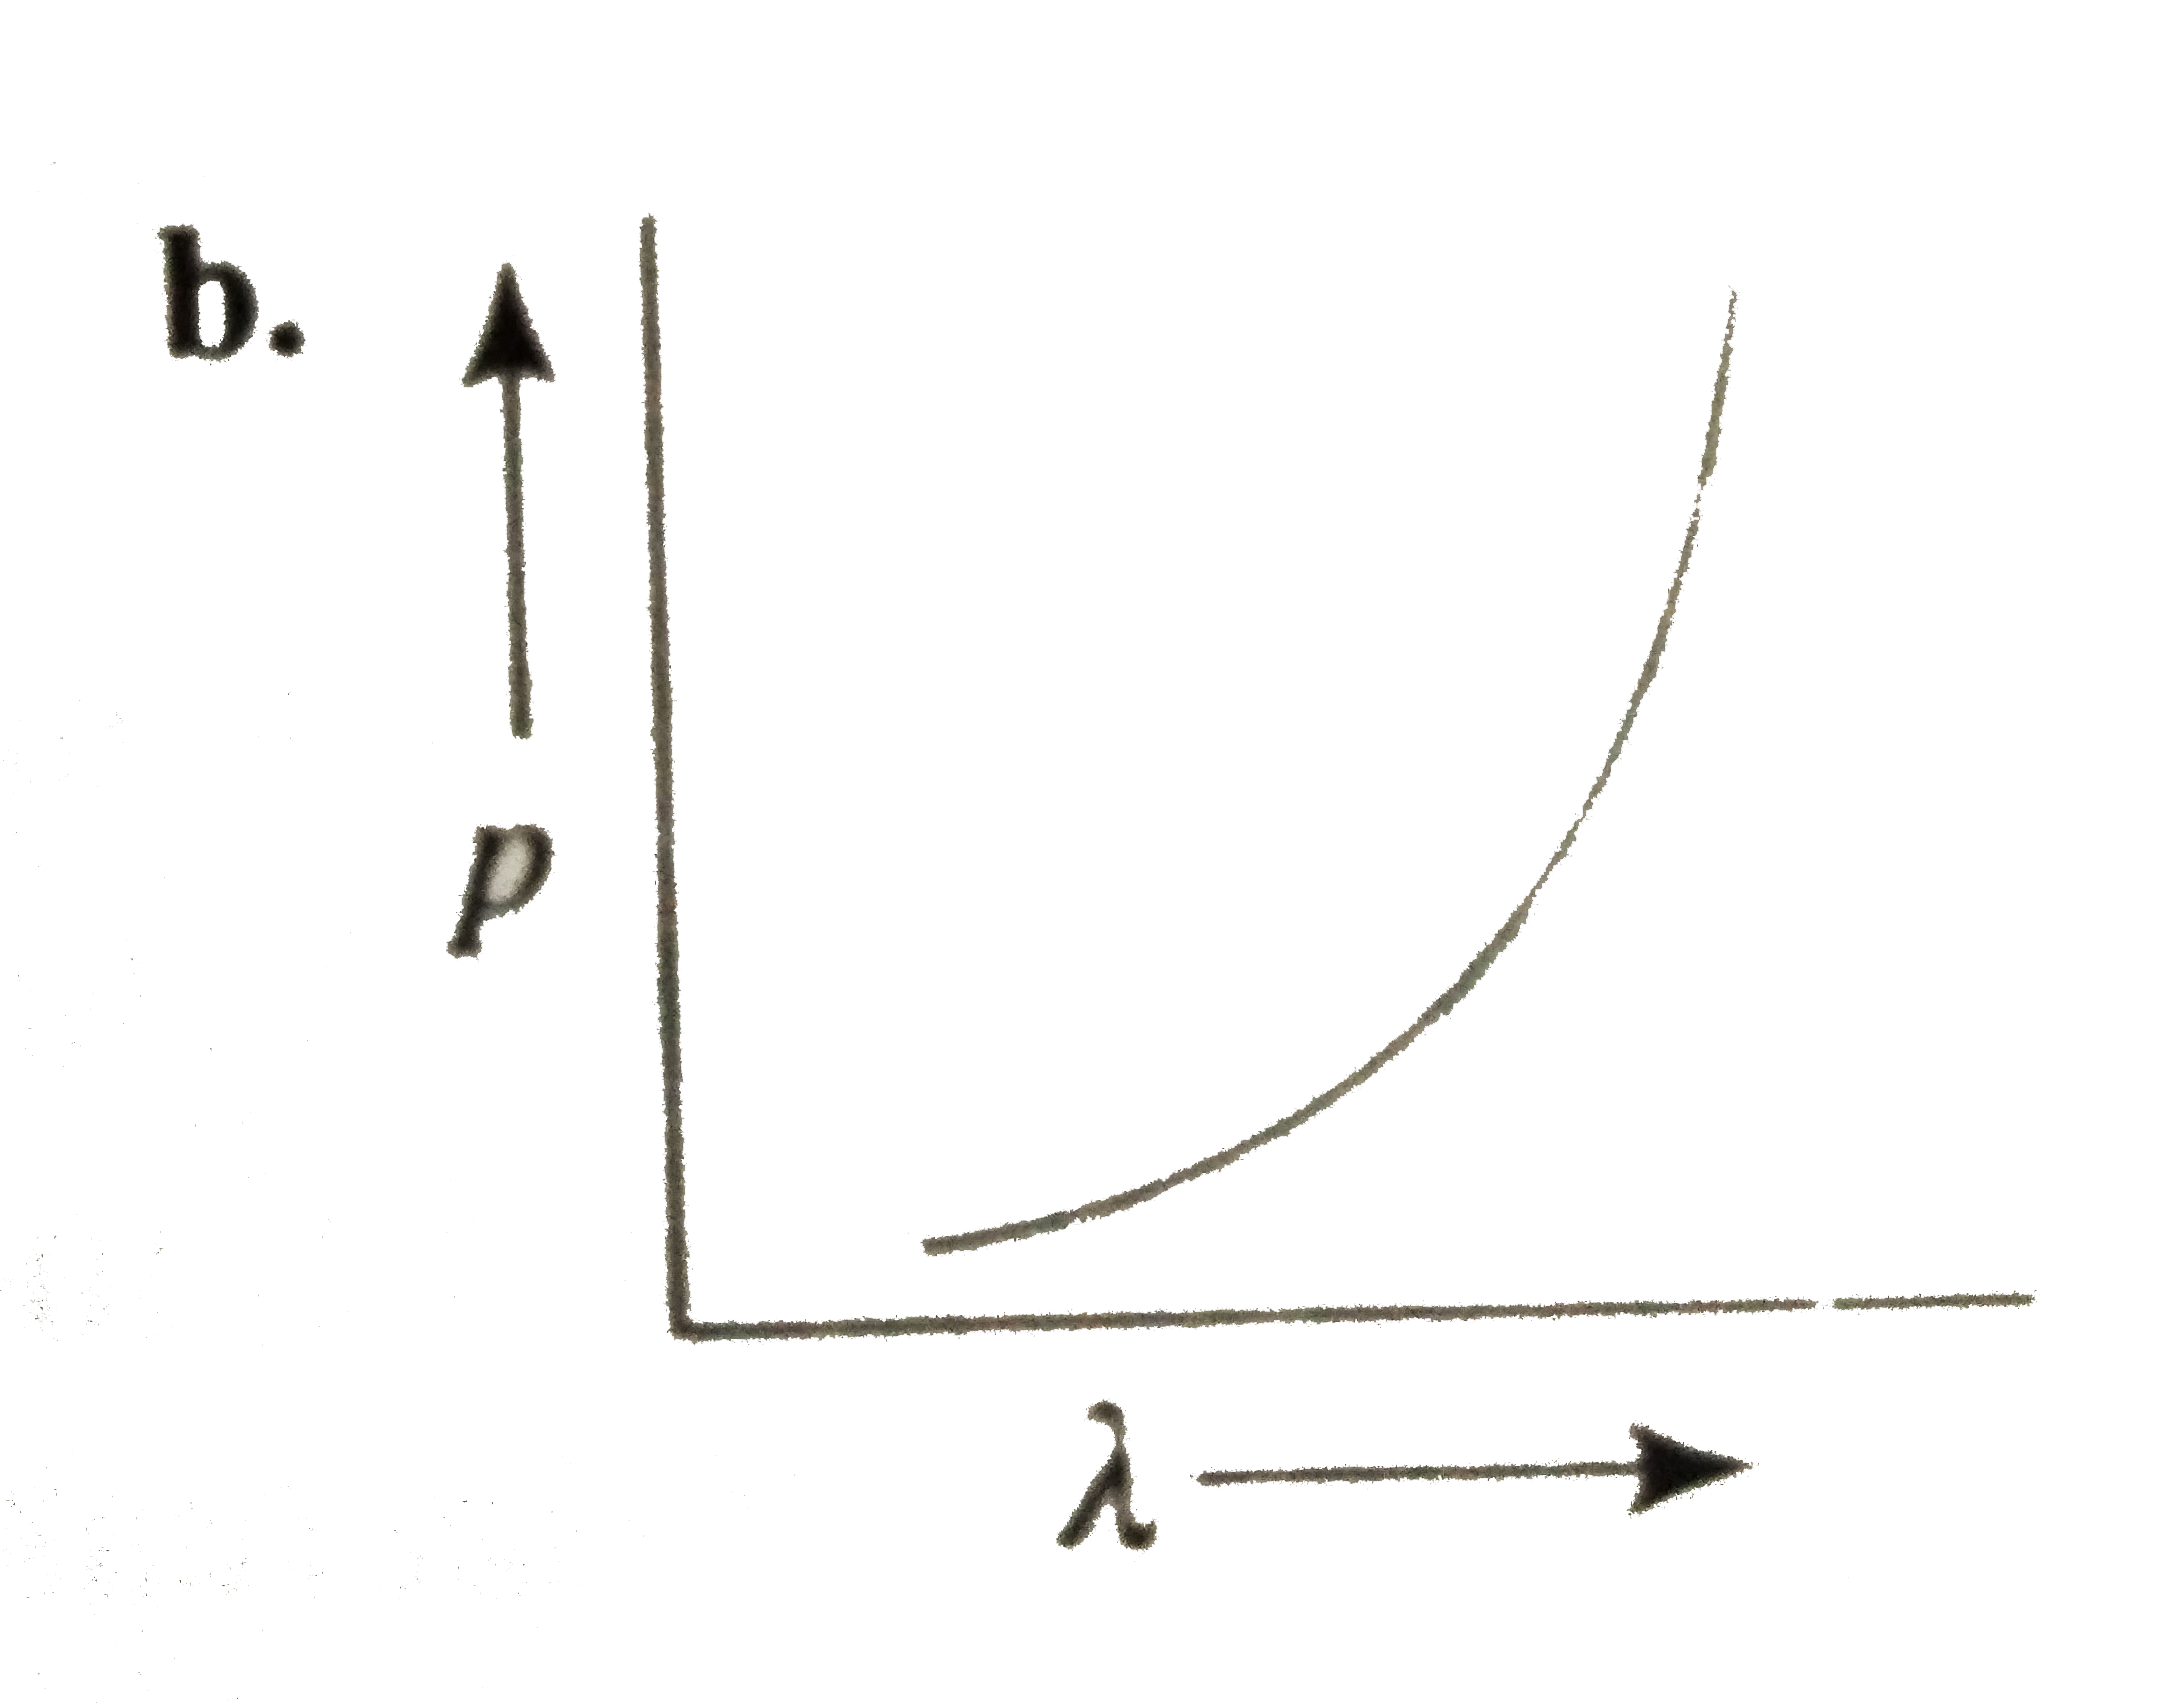 C
C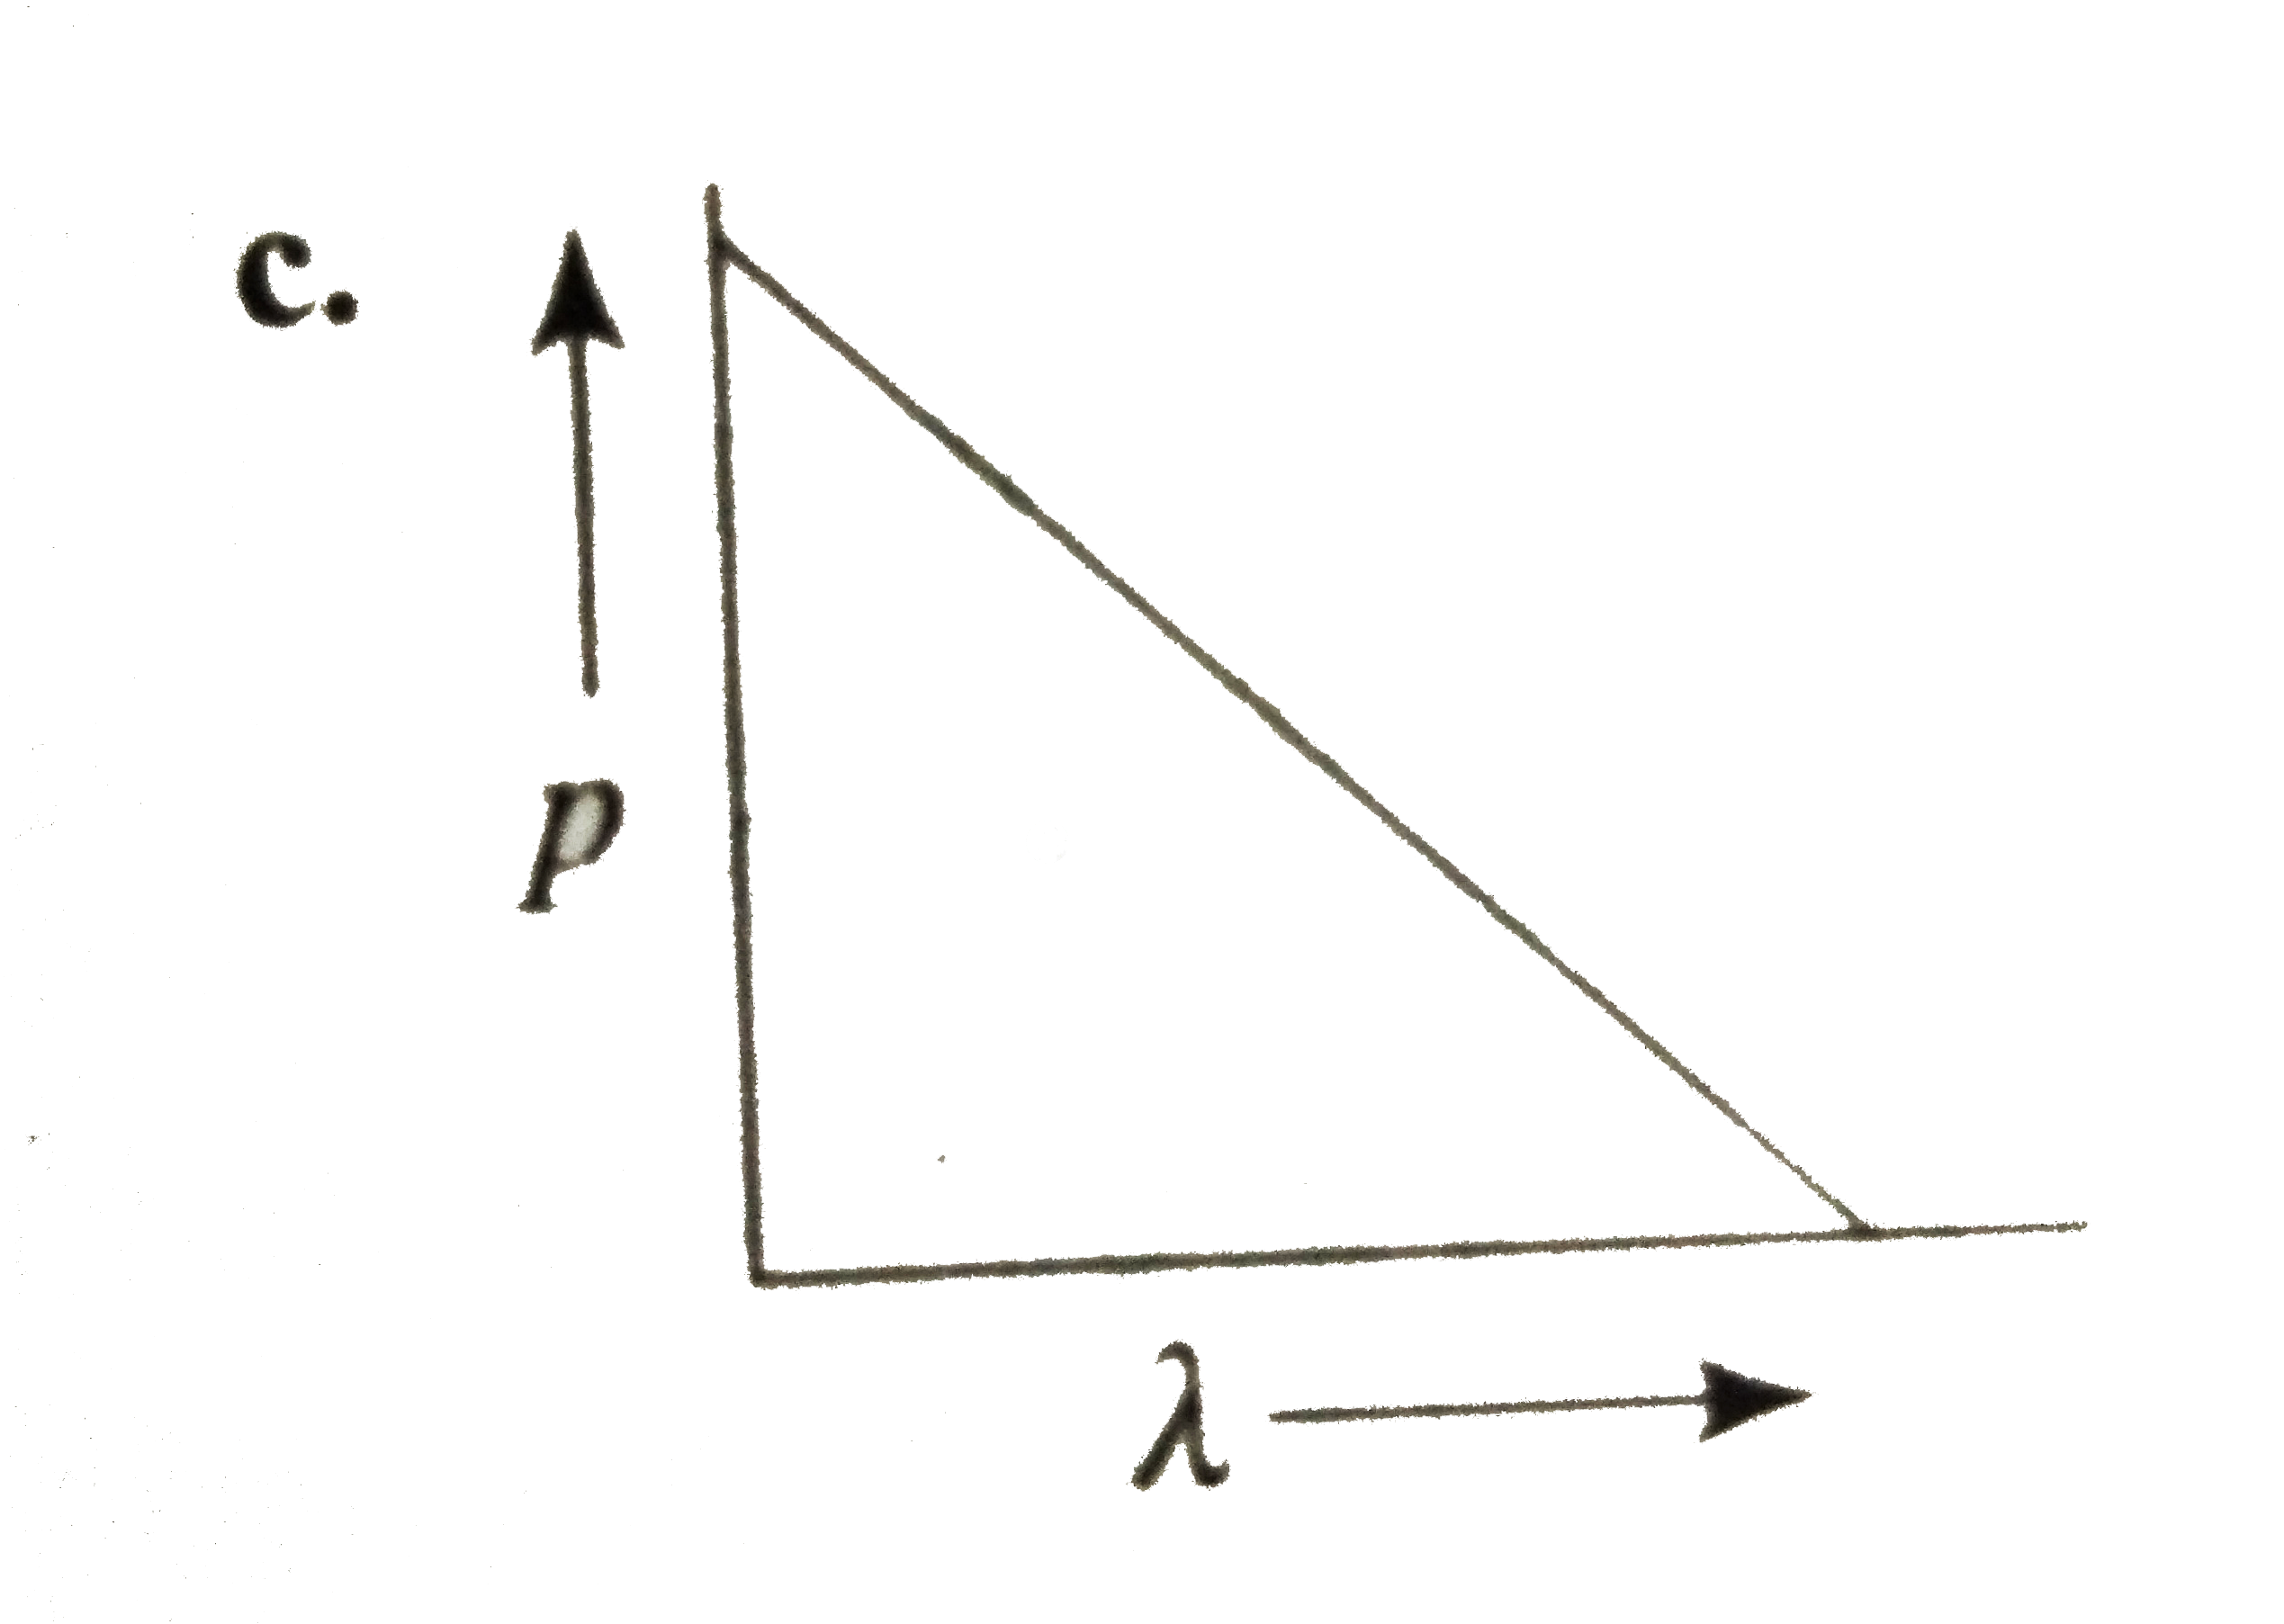 D
D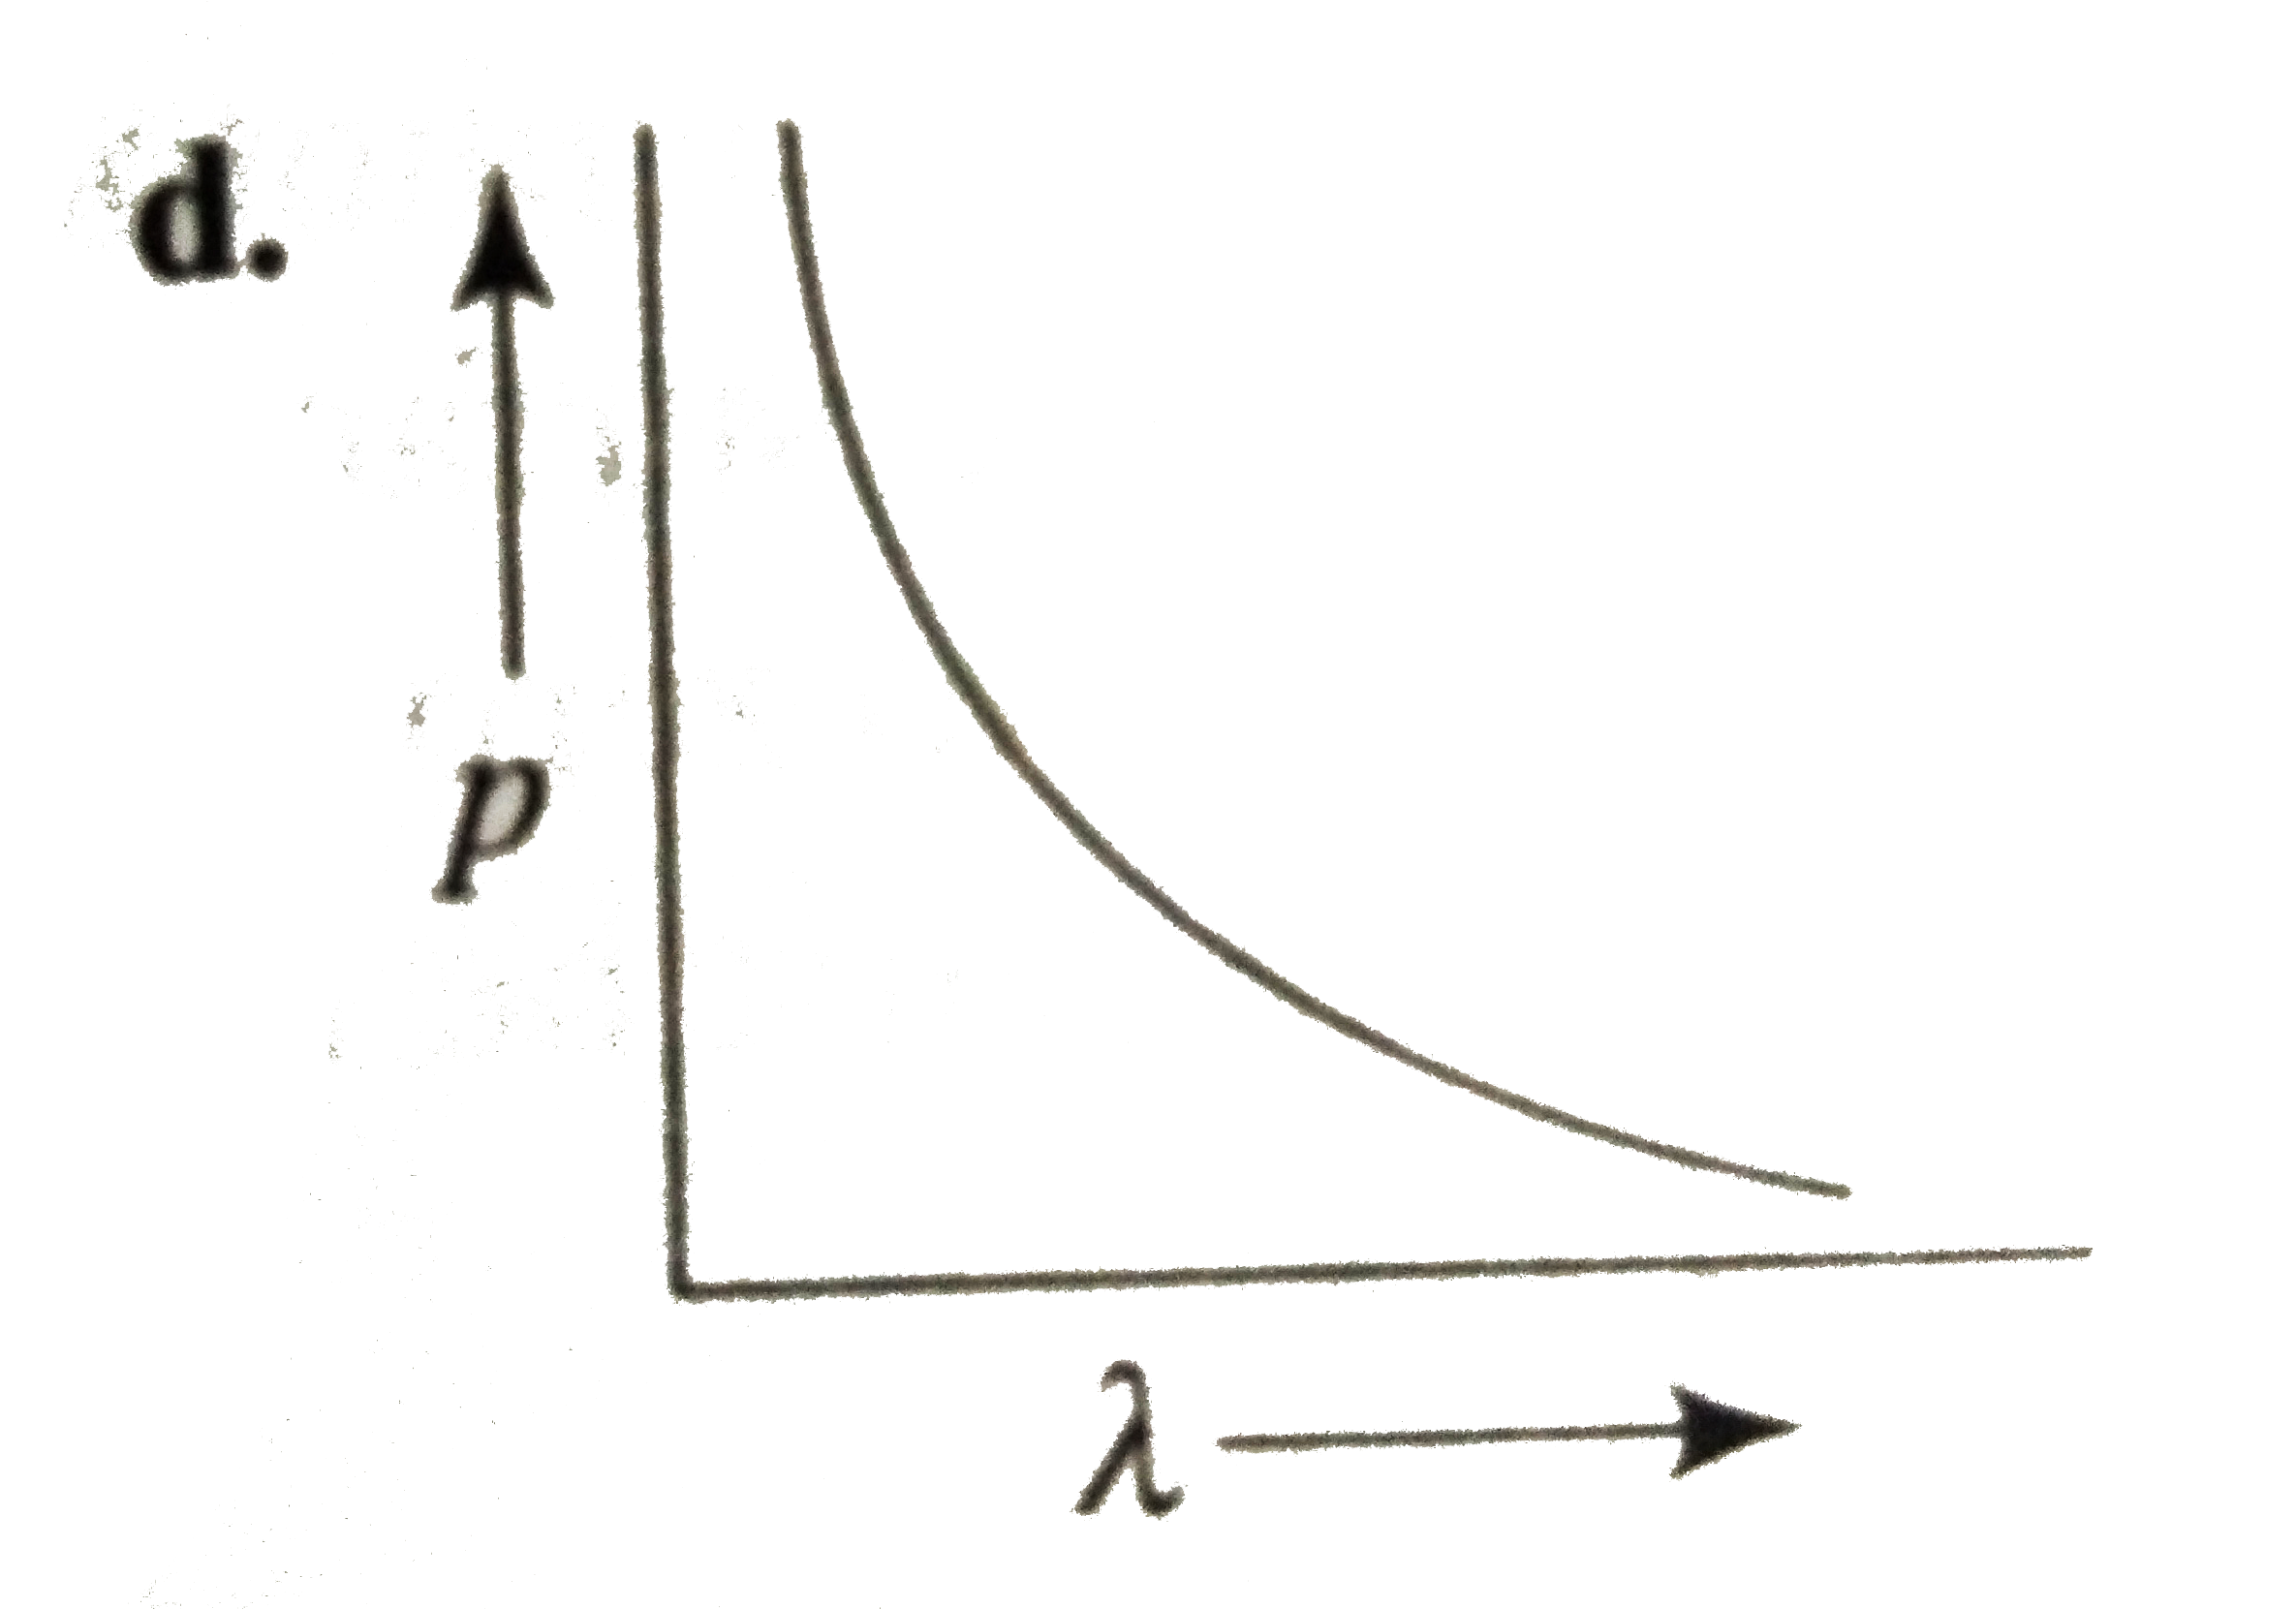
The momentum of a particle associated with de-Broglie's wavelength of 6Å is
View SolutionThe momentum of a particle having de-Broglie wavelength of 6Å
View SolutionWhich of the following particles moving with the same velocity would be associated with smallest de-Broglie wavelength?
View SolutionVeriation of momentum of perticle (p) with associated de-Broglie wavelength (λ) is shown correctly by
View SolutionIn which of the following cases the havier of the two particles has a smaller de-Broglie wavelength ? The two particles
View Solution
