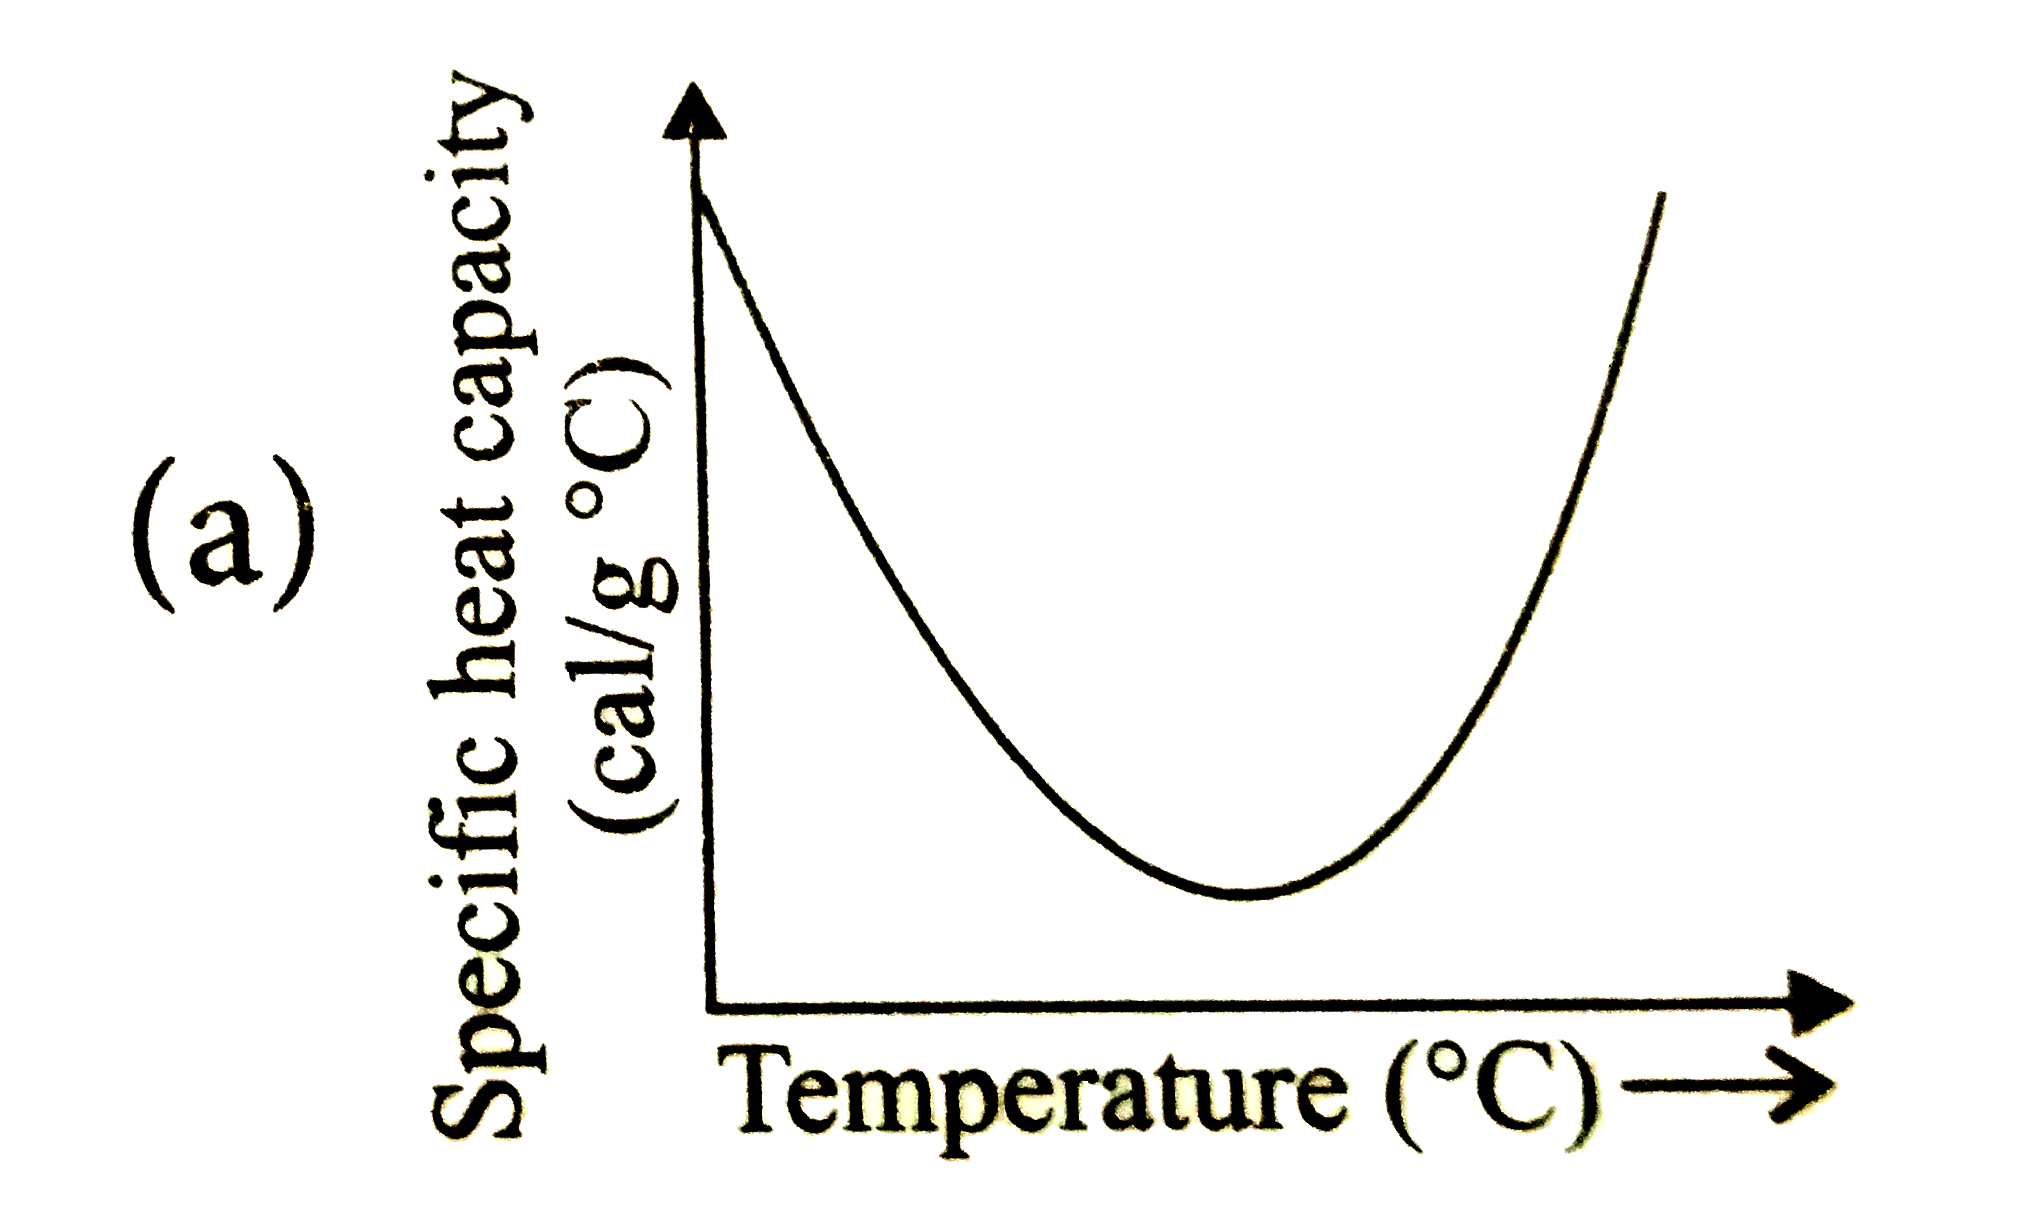
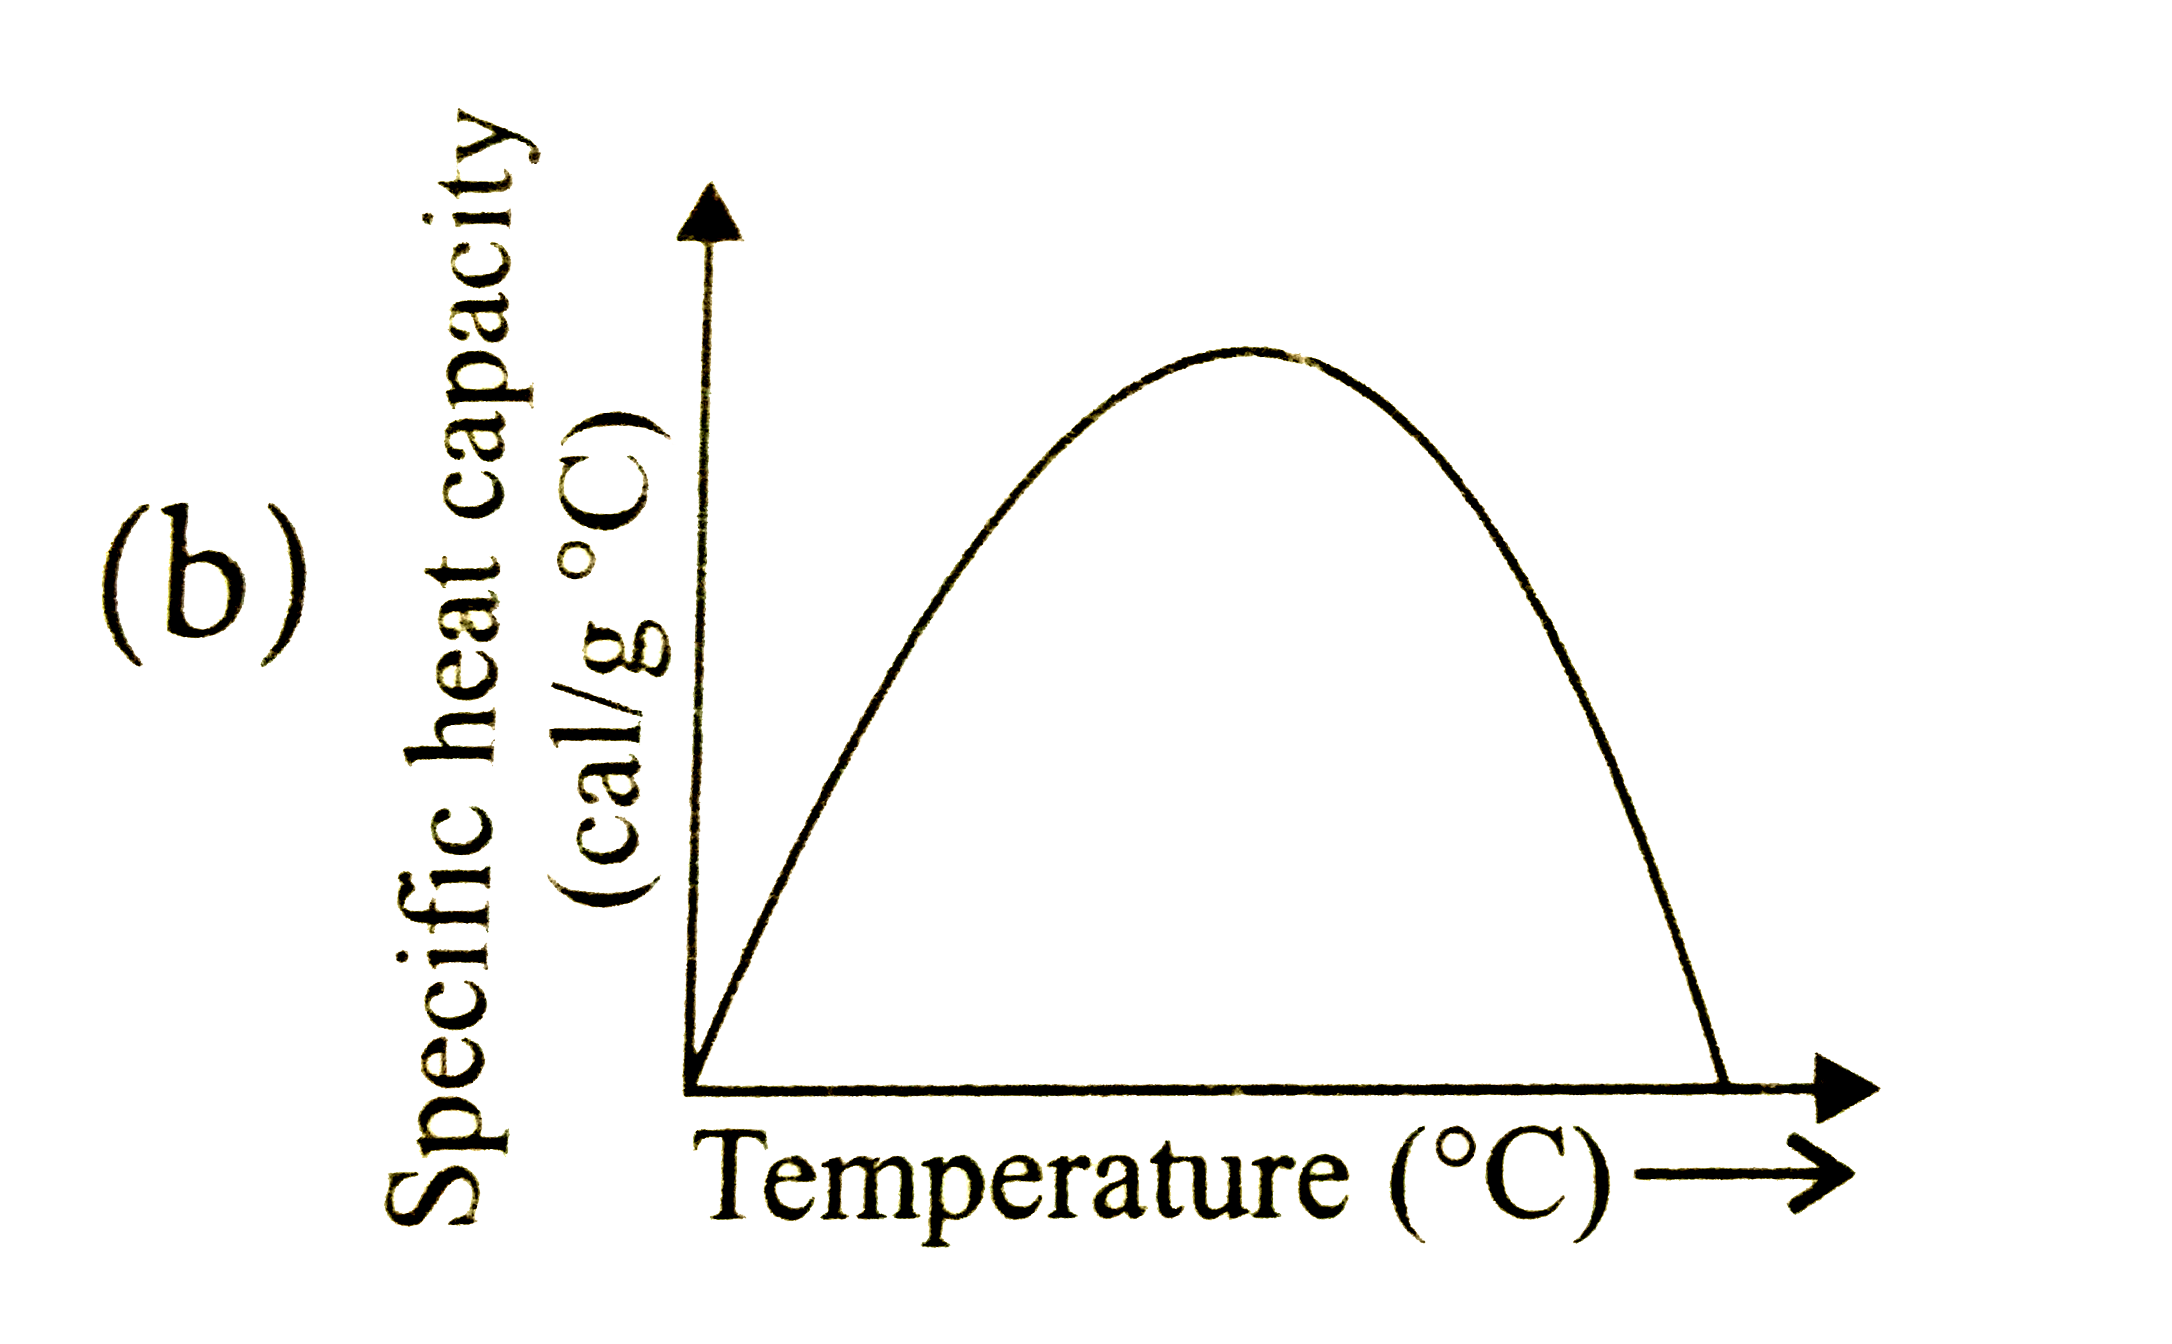
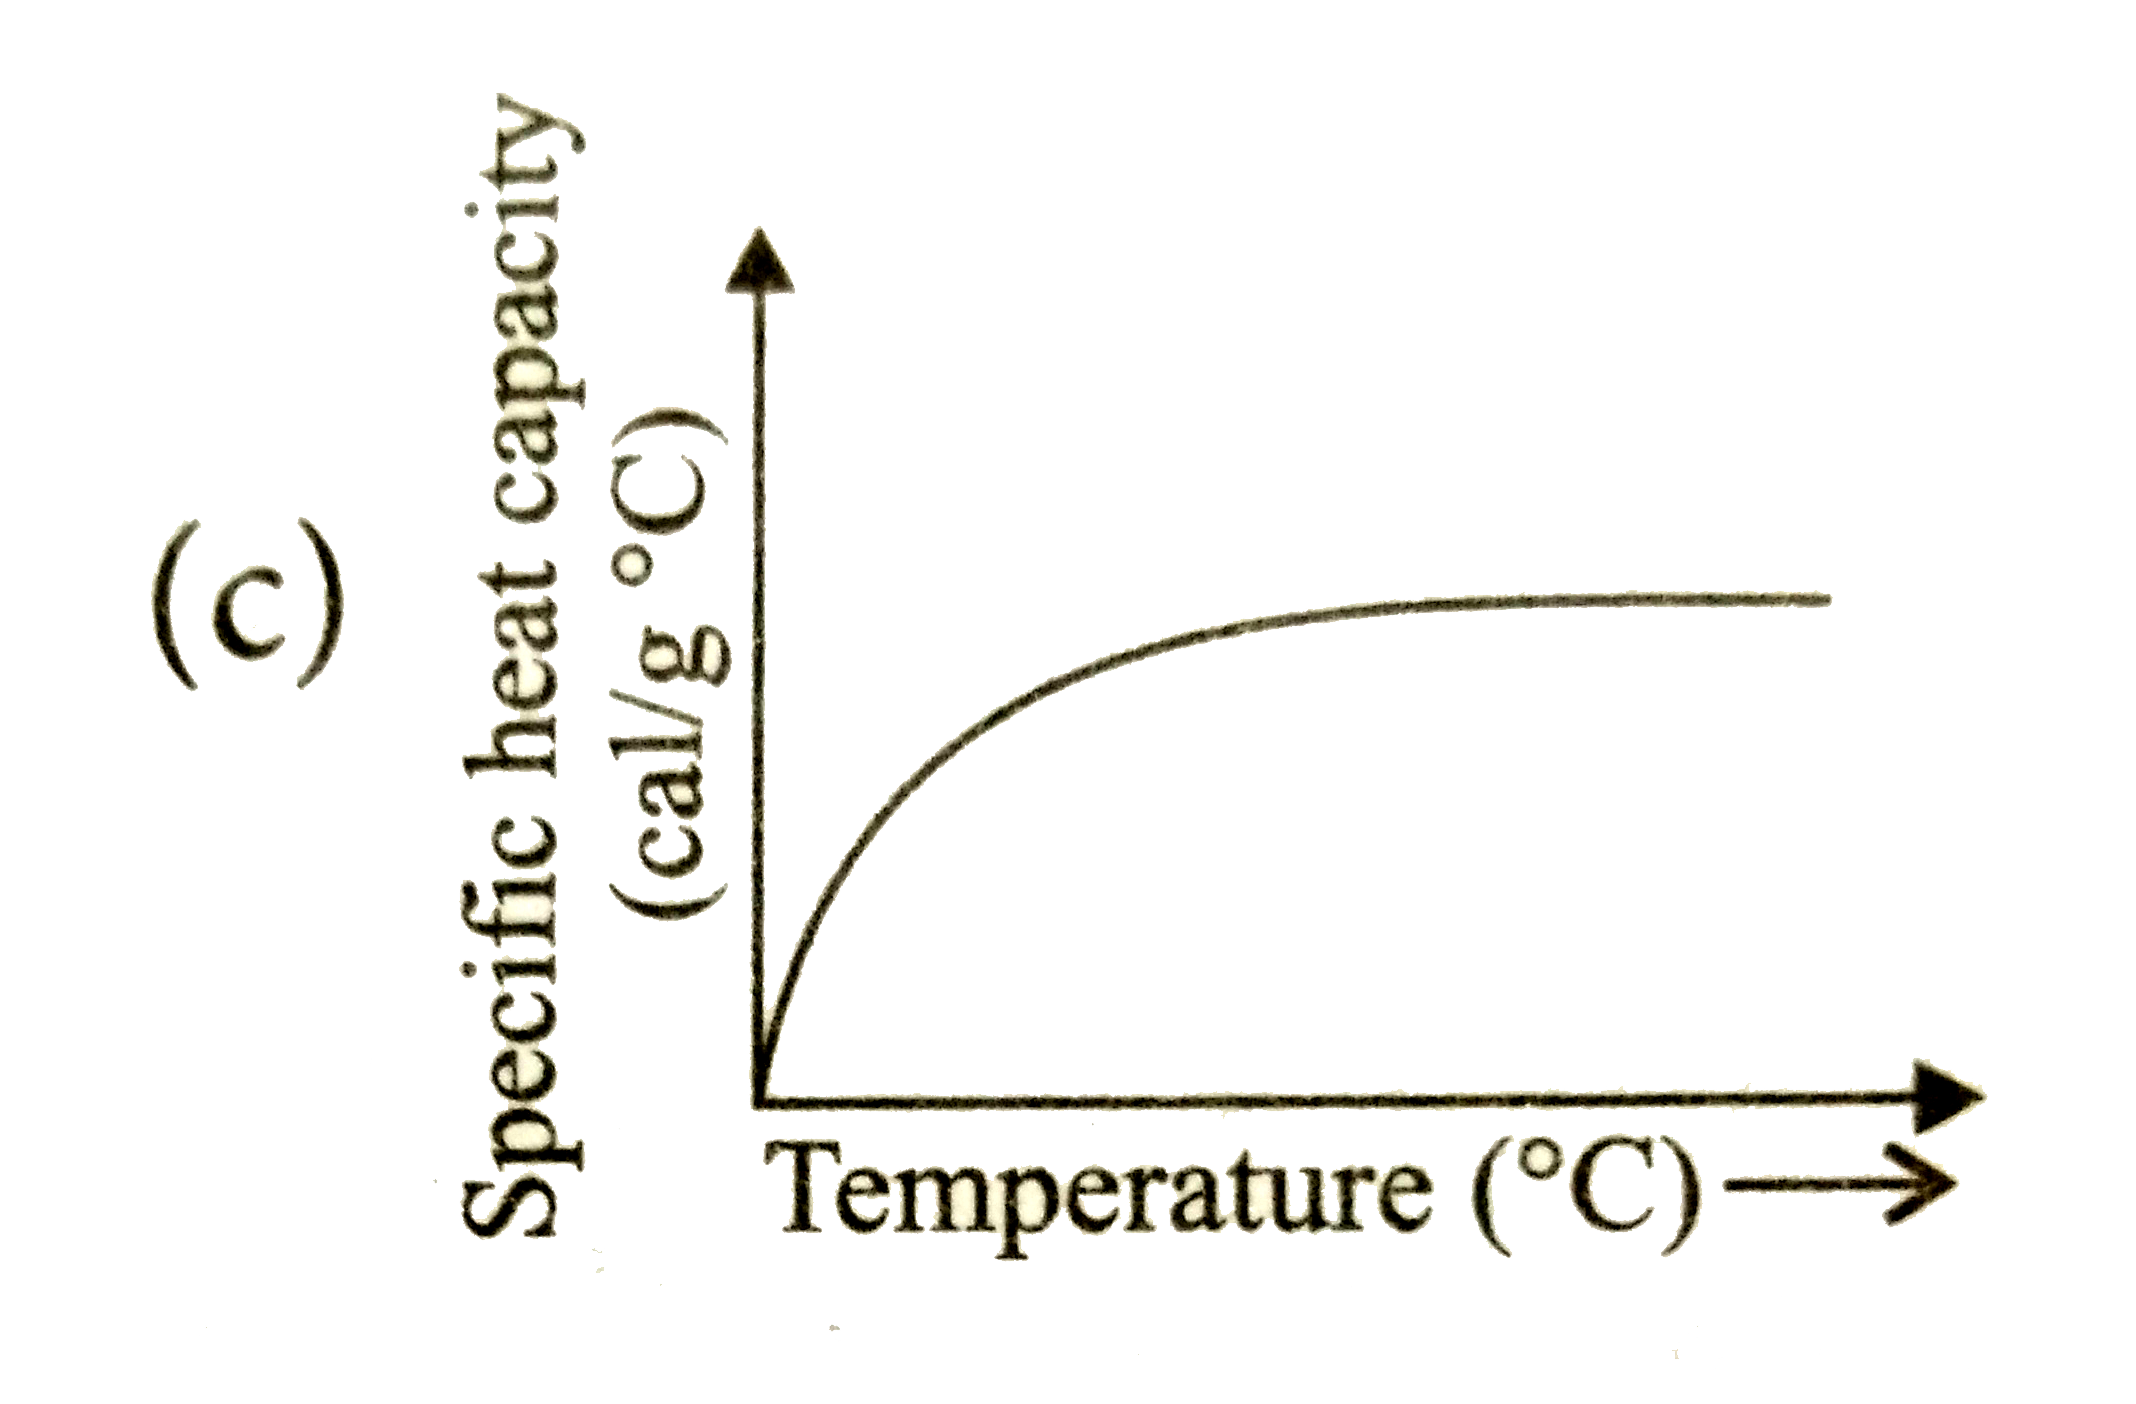
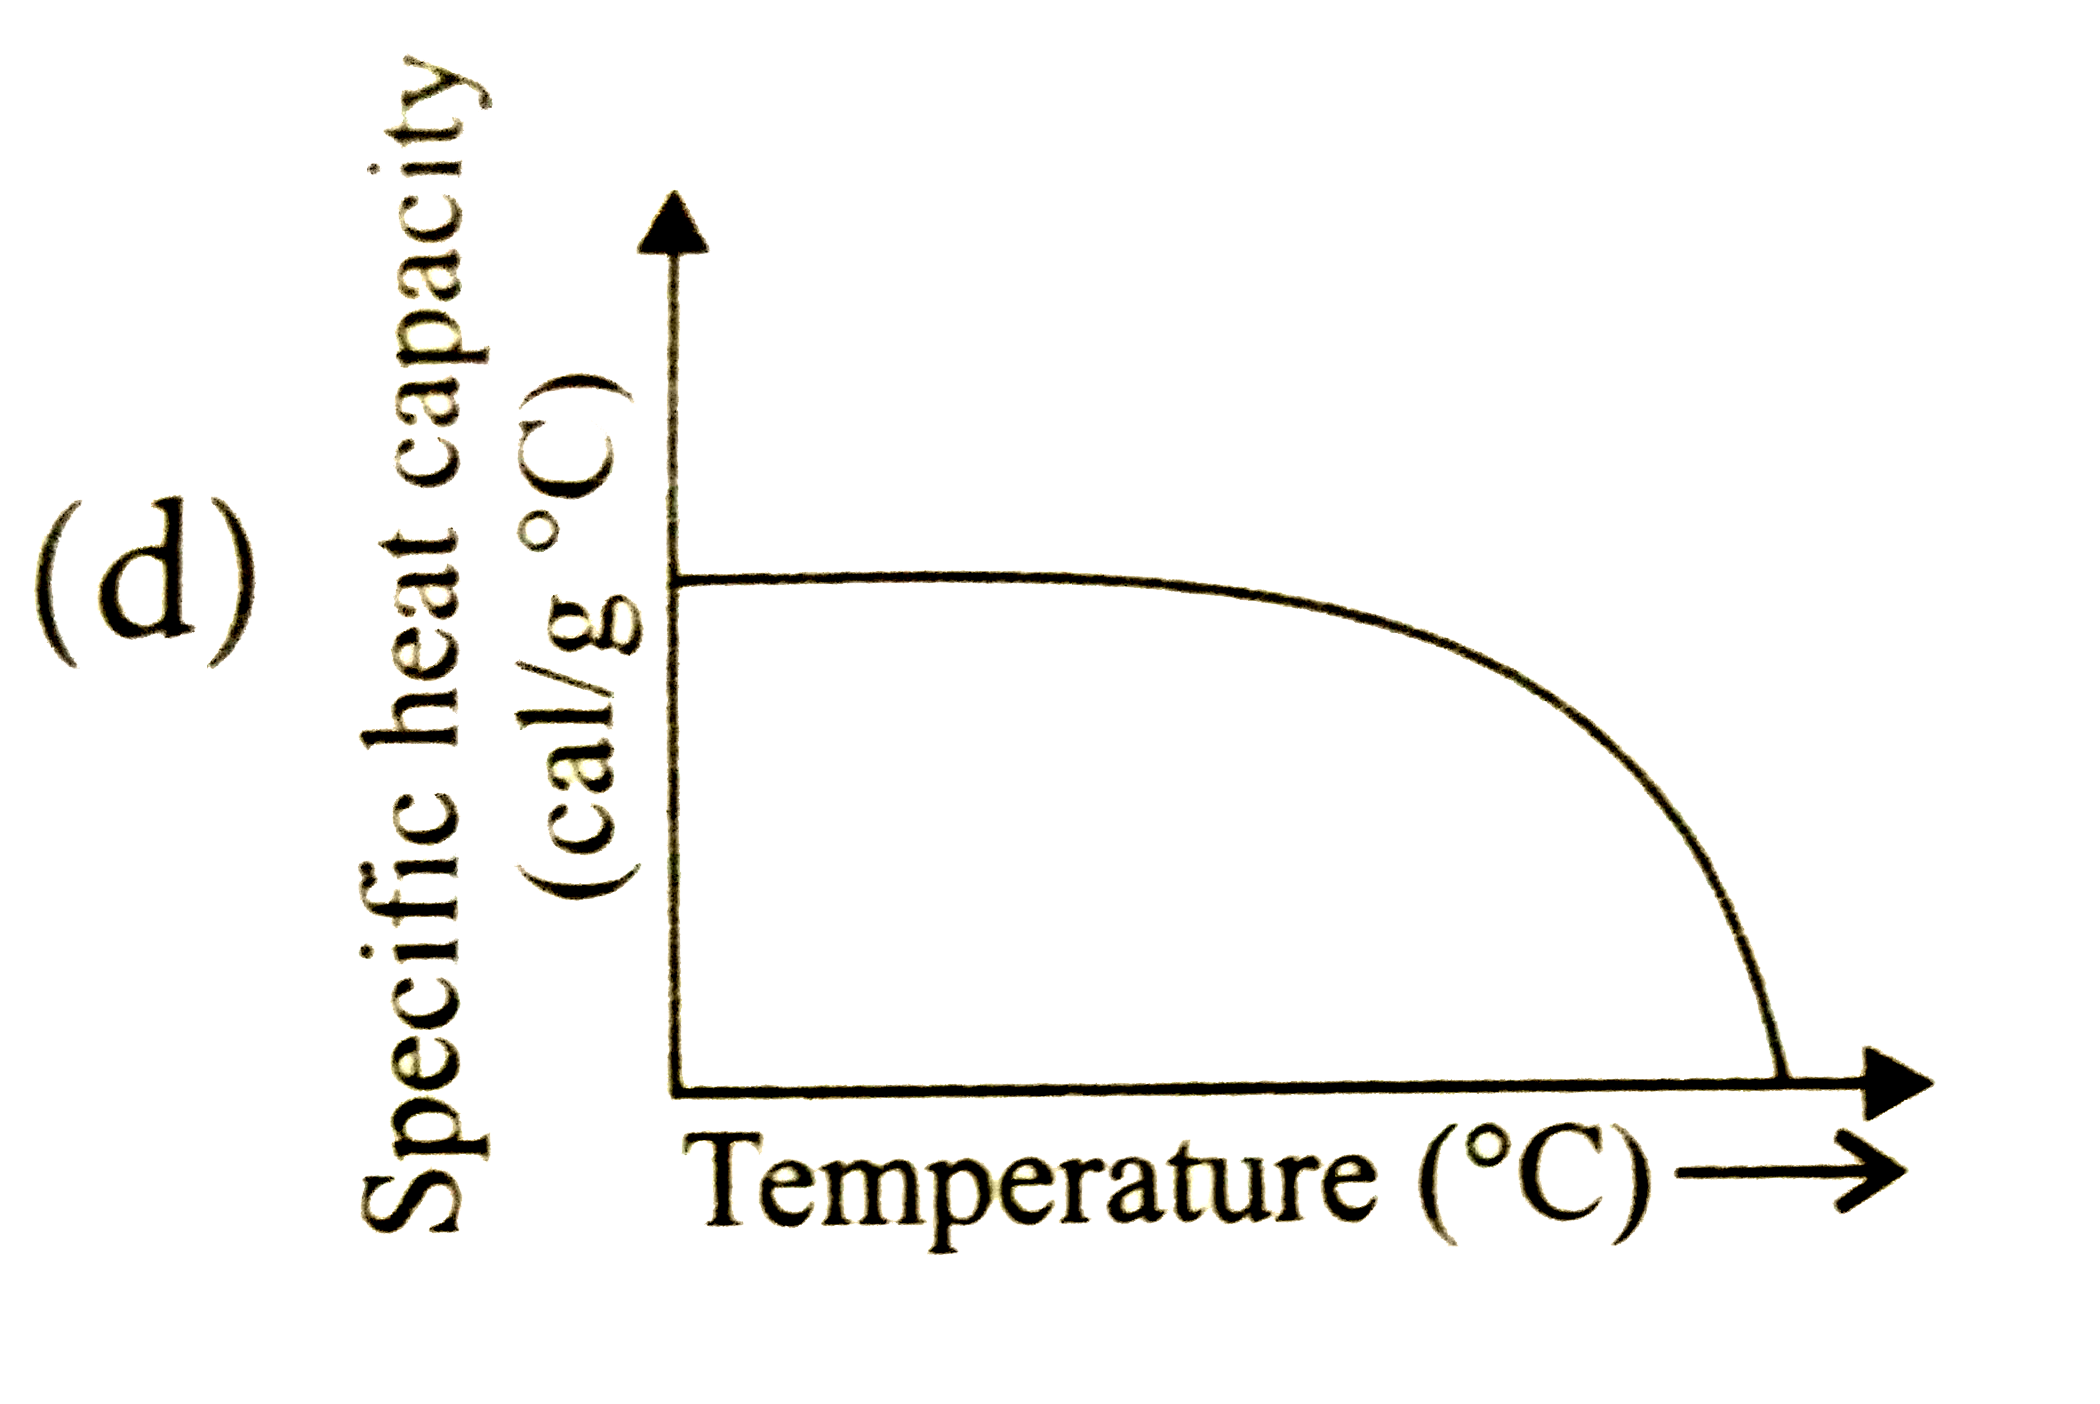
Which one of the following graphs represents the variation of surface tension of water with temperture for a small range of temperature ?
A

B

C

D

Text Solution
The correct Answer is:C
For small temperature differences , the variation in S.T with temperature is linear and is given by Tt=T0(1−αt) where TtandT0 are the surface tensions of t∘Cand0∘Candα is the temperature coefficient of S.T and the S.T decreases with increase with increase in temperature . Graph (c ) is the correct option .
|
Topper's Solved these Questions
- SURFACE TENSION BOOK - MARVEL PUBLICATIONCHAPTER - SURFACE TENSION EXERCISE - MULTIPLE CHOICE QUESTIONS . (MCQ FROM PREVIOUS EXAMS)
7 Videos
- STATIONARY WAVESBOOK - MARVEL PUBLICATIONCHAPTER - STATIONARY WAVESEXERCISE - TEST YOUR GRASP-8
20 Videos
- WAVE MOTIONBOOK - MARVEL PUBLICATIONCHAPTER - WAVE MOTIONEXERCISE - Test your grasp
15 Videos
Similar Questions
Knowledge Check
Which one of the following graphs represents variation of specific heat capacity of water with temperature?
A B
B C
C D
D
Which one of the following graphs represents variation of specific heat capacity of water with temperature?
A B
B C
C D
D
Which one of the following represents correctly the variations of surface tension with temperature θ ?
AT∝θBT∝θ−1CT∝θ2DT∝θ−2
which of the following graph represents the variation of resistivity (ρ) with temperature (T) for copper?
View SolutionWhich of the following curve represent variation of density of water with temperature best-
View SolutionWhich graph represents the variation of surface tension with temperature over small temperature ranges for water?
View Solutionwhich of the following graph represents the variation of resistivity (ρ) with temperature (T) for copper?
View SolutionWhich of the following curve represent variation of density of water with temperature best-
View Solution
