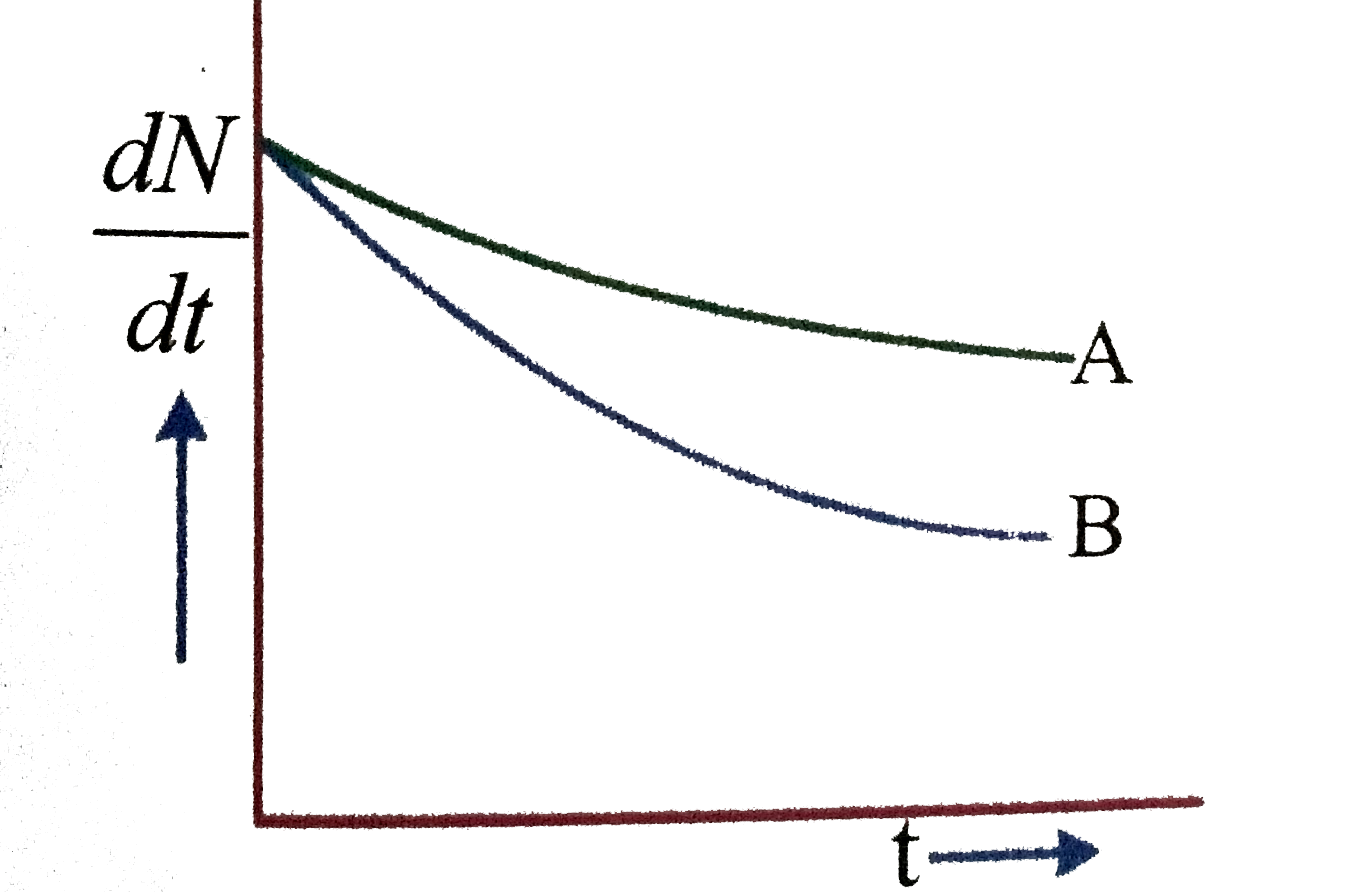
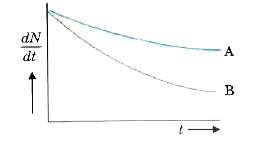
Which sample A or B, shown in Fig. 13.03, has shorter mean life ?
Sample B has shorter mean life because its decay rate is faster than that of sample A.
Topper's Solved these Questions
- NUCLEIBOOK - U-LIKE SERIESCHAPTER - NUCLEIEXERCISE - Short Answer Questions
28 Videos
- NUCLEIBOOK - U-LIKE SERIESCHAPTER - NUCLEIEXERCISE - Long Answer Question-I
22 Videos
- NUCLEIBOOK - U-LIKE SERIESCHAPTER - NUCLEIEXERCISE - Assertion -Reason Type Questions
5 Videos
- MOVING CHARGES AND MAGNETISM BOOK - U-LIKE SERIESCHAPTER - MOVING CHARGES AND MAGNETISM EXERCISE - SELF ASSESSMENT TEST (SECTION D)
1 Videos
- RAY OPTICS AND OPTICAL INSTRUMENTSBOOK - U-LIKE SERIESCHAPTER - RAY OPTICS AND OPTICAL INSTRUMENTSEXERCISE - SELF ASSESSMENT TEST (SECTION B)
3 Videos
Similar Questions
Knowledge Check
Which sample A or B shown in figure has shorter mean-life ?
 AτB<τABτB>τACτB=τADNothing can be concluded
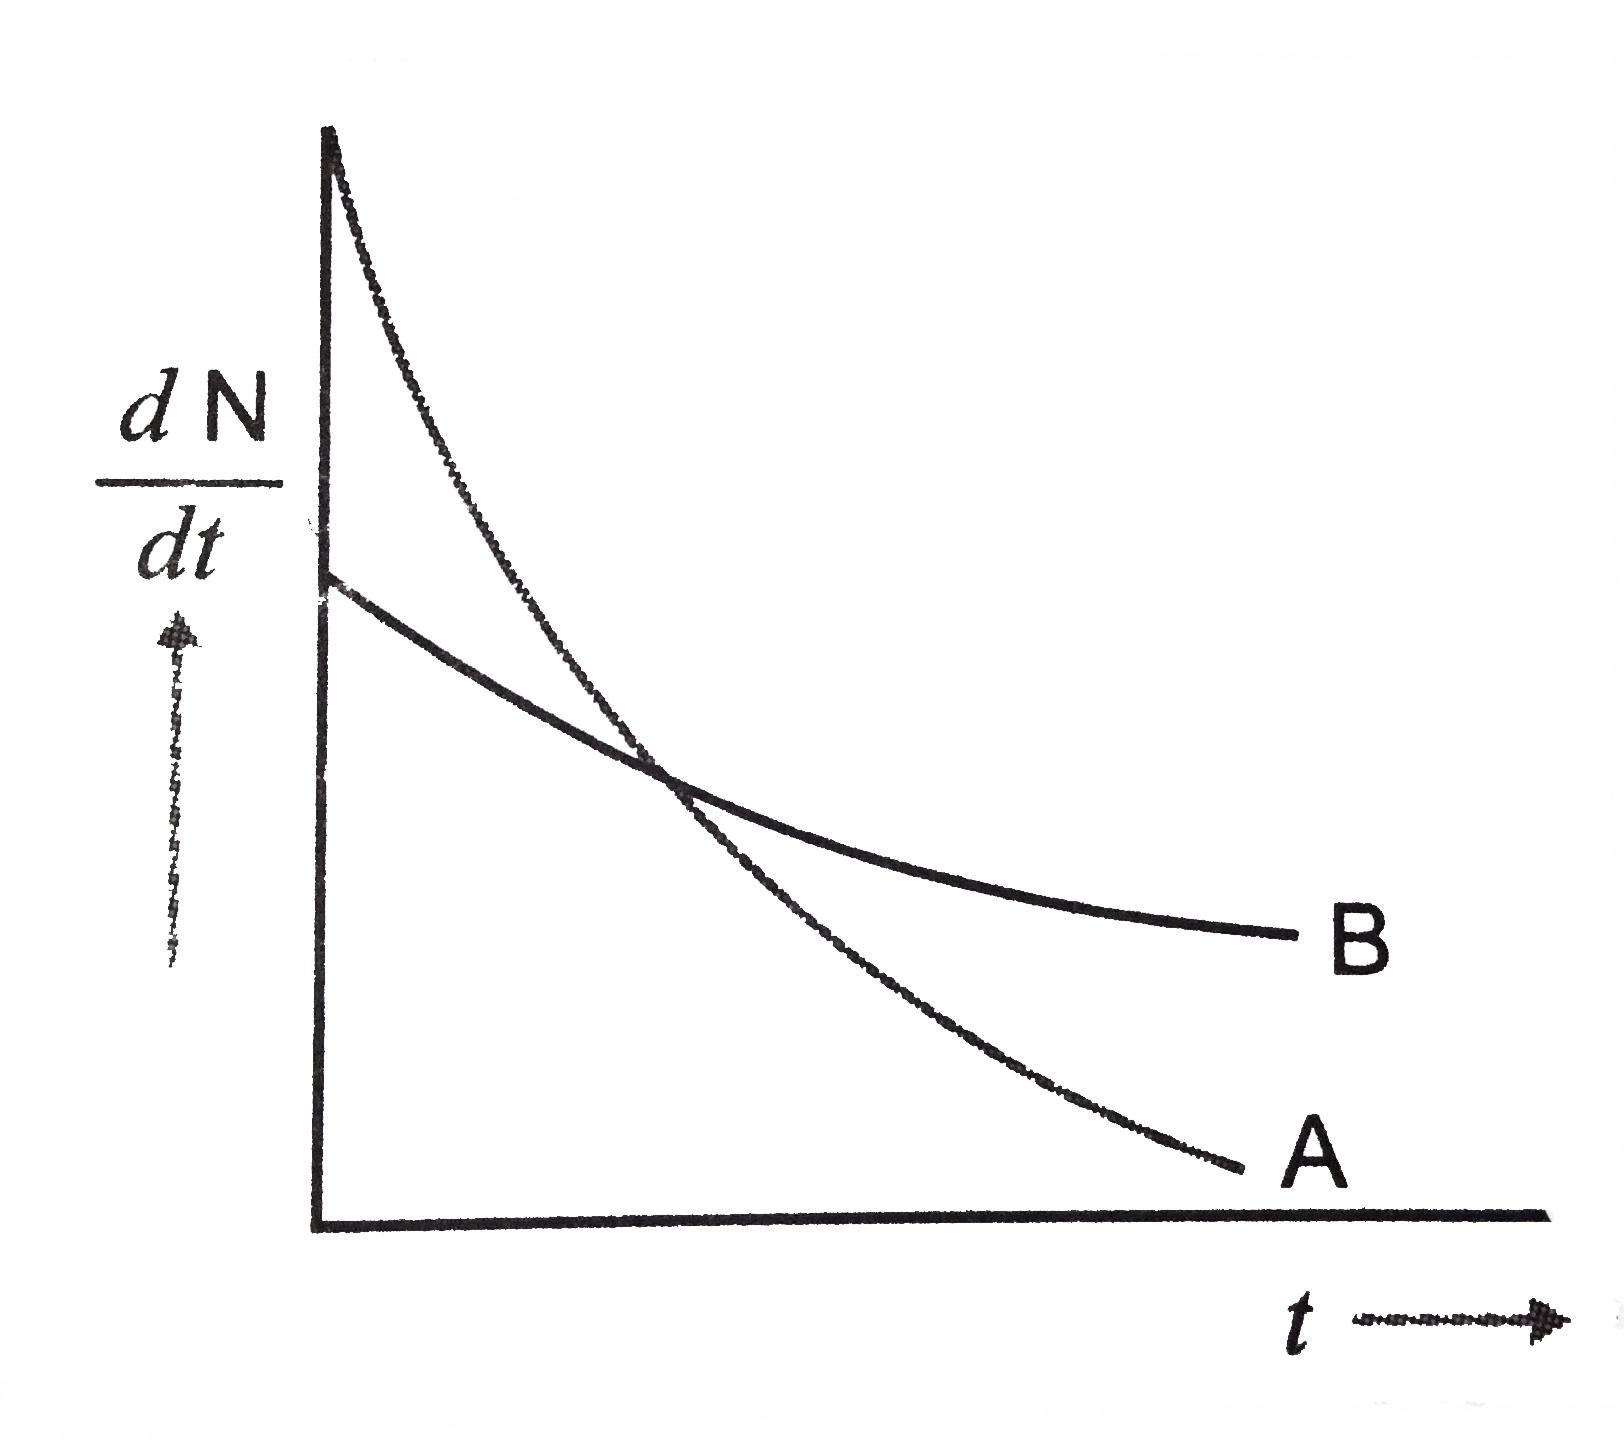
The variation of decay rate of two radioactive samples A and B with time is shown in fig.

Which of the following statements are true?ADecay constant of A is greater than that of B, hence A always decays faster than BBDecay constant of B is greater than that of A, but its decay rate is always smaller than that of ACDecay constant of A is greater than that of B, but it does not always decay faster than BDDecay constant of B is smaller than that of A but still its decay rate becomes equal to that of A at a later instantWhat percentage of the atoms in a sample will remain undecayed in a time equal to mean life ?
A1B0.63C0.5D0.37
Which sample, A or B, shown in the following figure has shorter mean life?

View SolutionThe variation of decay rate of two radioactive samples A and B with time is shown in fig.

Which of the following statements are true?
View SolutionThe variation of decay rate of two radioactive samples A and B with time is shown in fig.

Which of the following statements are true?
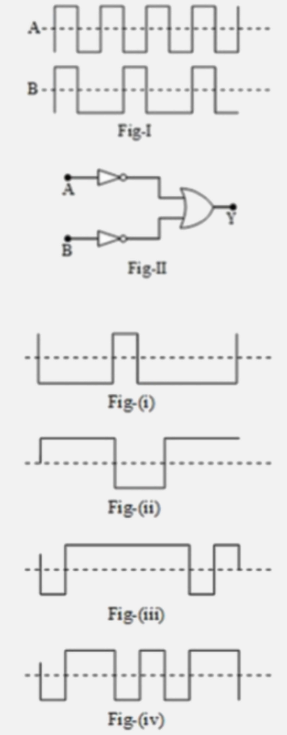
View SolutionInput waveforms A and B as shown in Fig-l are applied to the combination of gates as shown in Fig-ll. Which of the waveforms shown in Fig.(i) to (iv) correctly represents the output waveform?

View SolutionAs radioactive substances undergo continuous decay, number of nuclei in a sample goes on decreasing. The time interval in which number of nuclei in a sample is reduced to half of its initial value is the half-life of the sample. The half-life is related to the decay constant by the relation.
T1/2=0.693λ
The average life of a sample is expressed by the relation
τ=1λ
If the half-life of a radioactive sample is 138.6 days, then mean life of the sample is
View Solution
