A bulb manufacturing company tests the bulbs produced by four different machines. The following graph gives the number of bulbs tested that are produced by each machine and the number that are found to be defective.
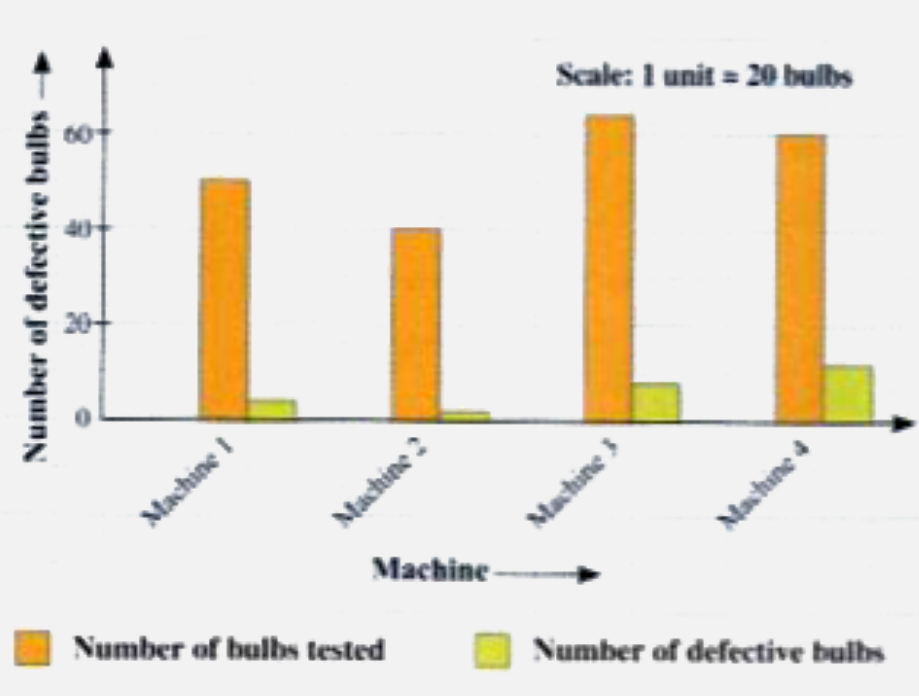
Read the graph and answer the following.
What percentage of bulbs produced by each of the four machines is defective
The correct Answer is:Machine 1:8%; Machine 2:5% Machine 3:12 % Machine 4:20%
Step by step video & image solution for A bulb manufacturing company tests the bulbs produced by four different machines. The following graph gives the number of bulbs tested that are produced by each machine and the number that are found to be defective. Read the graph and answer the following. What percentage of bulbs produced by each of the four machines is defective by Maths experts to help you in doubts & scoring excellent marks in Class 7 exams.
Updated on:21/07/2023Topper's Solved these Questions
- DATA HANDLING AND MEASURES OF CENTRAL TENDENCYBOOK - ICSECHAPTER - DATA HANDLING AND MEASURES OF CENTRAL TENDENCYEXERCISE - REVISION EXERCISE
39 Videos
- DATA HANDLING AND MEASURES OF CENTRAL TENDENCYBOOK - ICSECHAPTER - DATA HANDLING AND MEASURES OF CENTRAL TENDENCYEXERCISE - WARM-UP EXERCISE
5 Videos
- DATA HANDLING AND MEASURES OF CENTRAL TENDENCYBOOK - ICSECHAPTER - DATA HANDLING AND MEASURES OF CENTRAL TENDENCYEXERCISE - EXERCIES 18.1
37 Videos
- CONSTRUCTIONS BOOK - ICSECHAPTER - CONSTRUCTIONS EXERCISE - REVISION EXERCISE
12 Videos
- DATA HANDLING BOOK - ICSECHAPTER - DATA HANDLING EXERCISE - EXERCISE 24D
13 Videos
Similar Questions
A bulb manufacturing company tests the bulbs produced by four different machines. The following graph gives the number of bulbs tested that are produced by each machine and the number that are found to be defective.
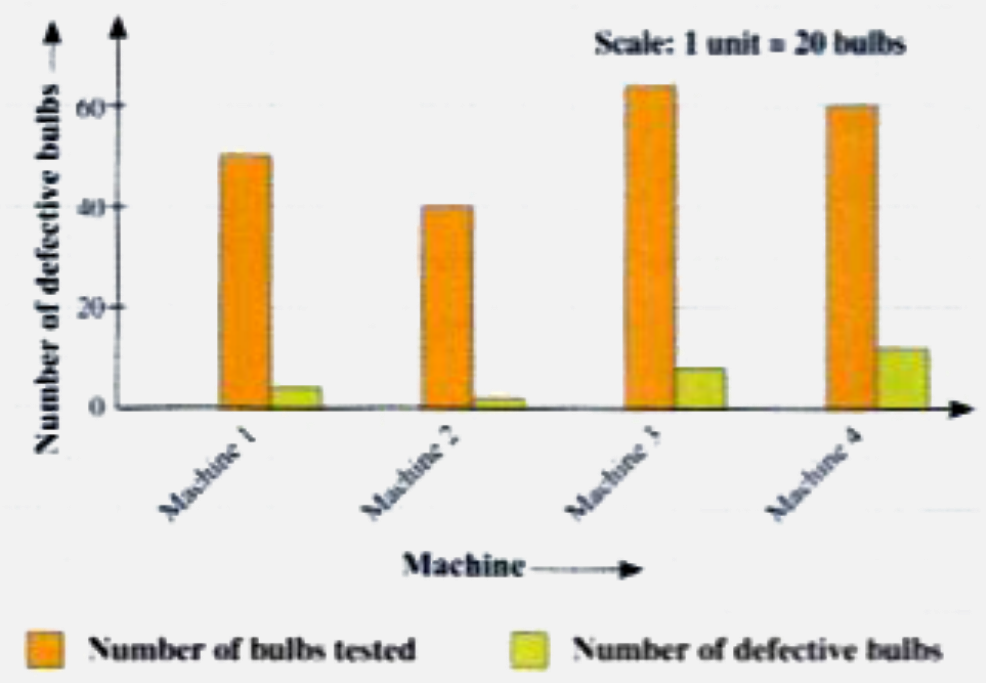
Read the graph and answer the following.
Which is the best machine?
View SolutionA bulb manufacturing company tests the bulbs produced by four different machines. The following graph gives the number of bulbs tested that are produced by each machine and the number that are found to be defective.

Read the graph and answer the following.
Which is the worst machined?
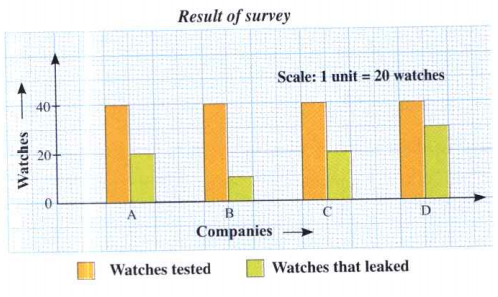
View SolutionThe following graph shows the result of a survey to test water resistant watches made by four different companies. Read the graph and answer the following question.
Which company has the best watches?
View SolutionThe following graph shows the result of a survey to test water resistant watches made by four different companies. Read the graph and answer the following question.
Which company has the worst watches?

View SolutionThe following are the number of electric bulbs purchased for alodging house during the first four months of a year
View SolutionThe persentage of ammonia produced from nitrogen and hydrogen under conditions of temperature and pressure is given in the graph
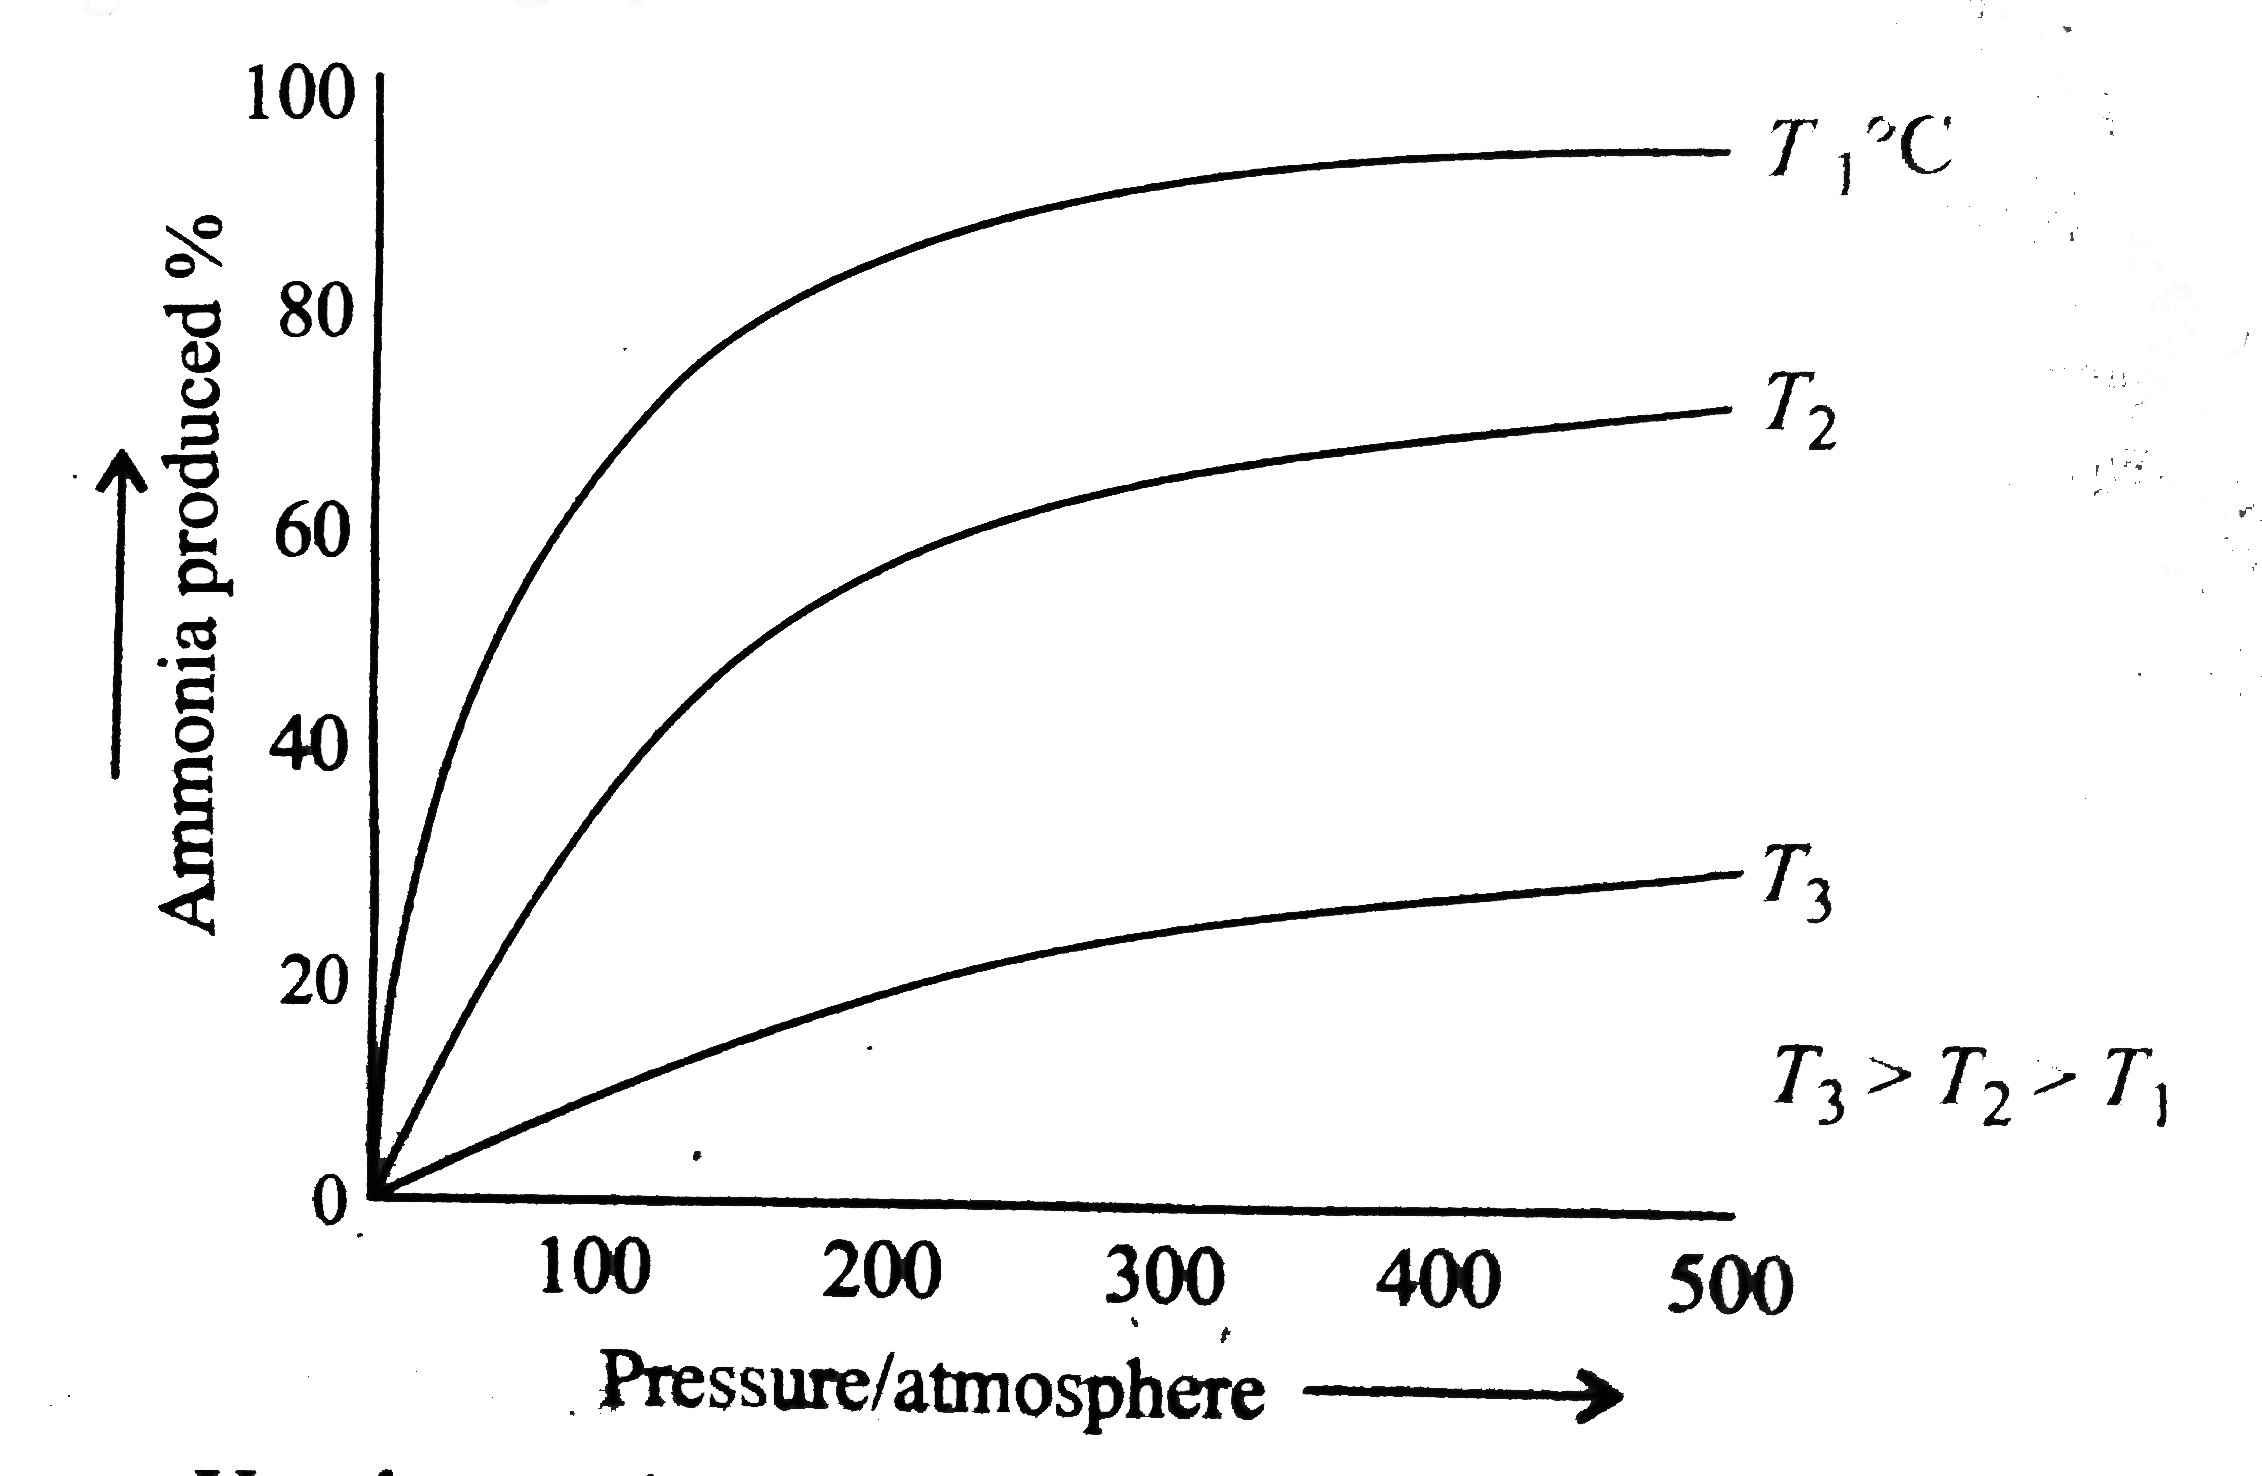
Use the graph answering the following questions:
What happens to the percentage of ammonia produced when the pressure is increased?
View SolutionThe persentage of ammonia produced from nitrogen and hydrogen under conditions of temperature and pressure is given in the graph
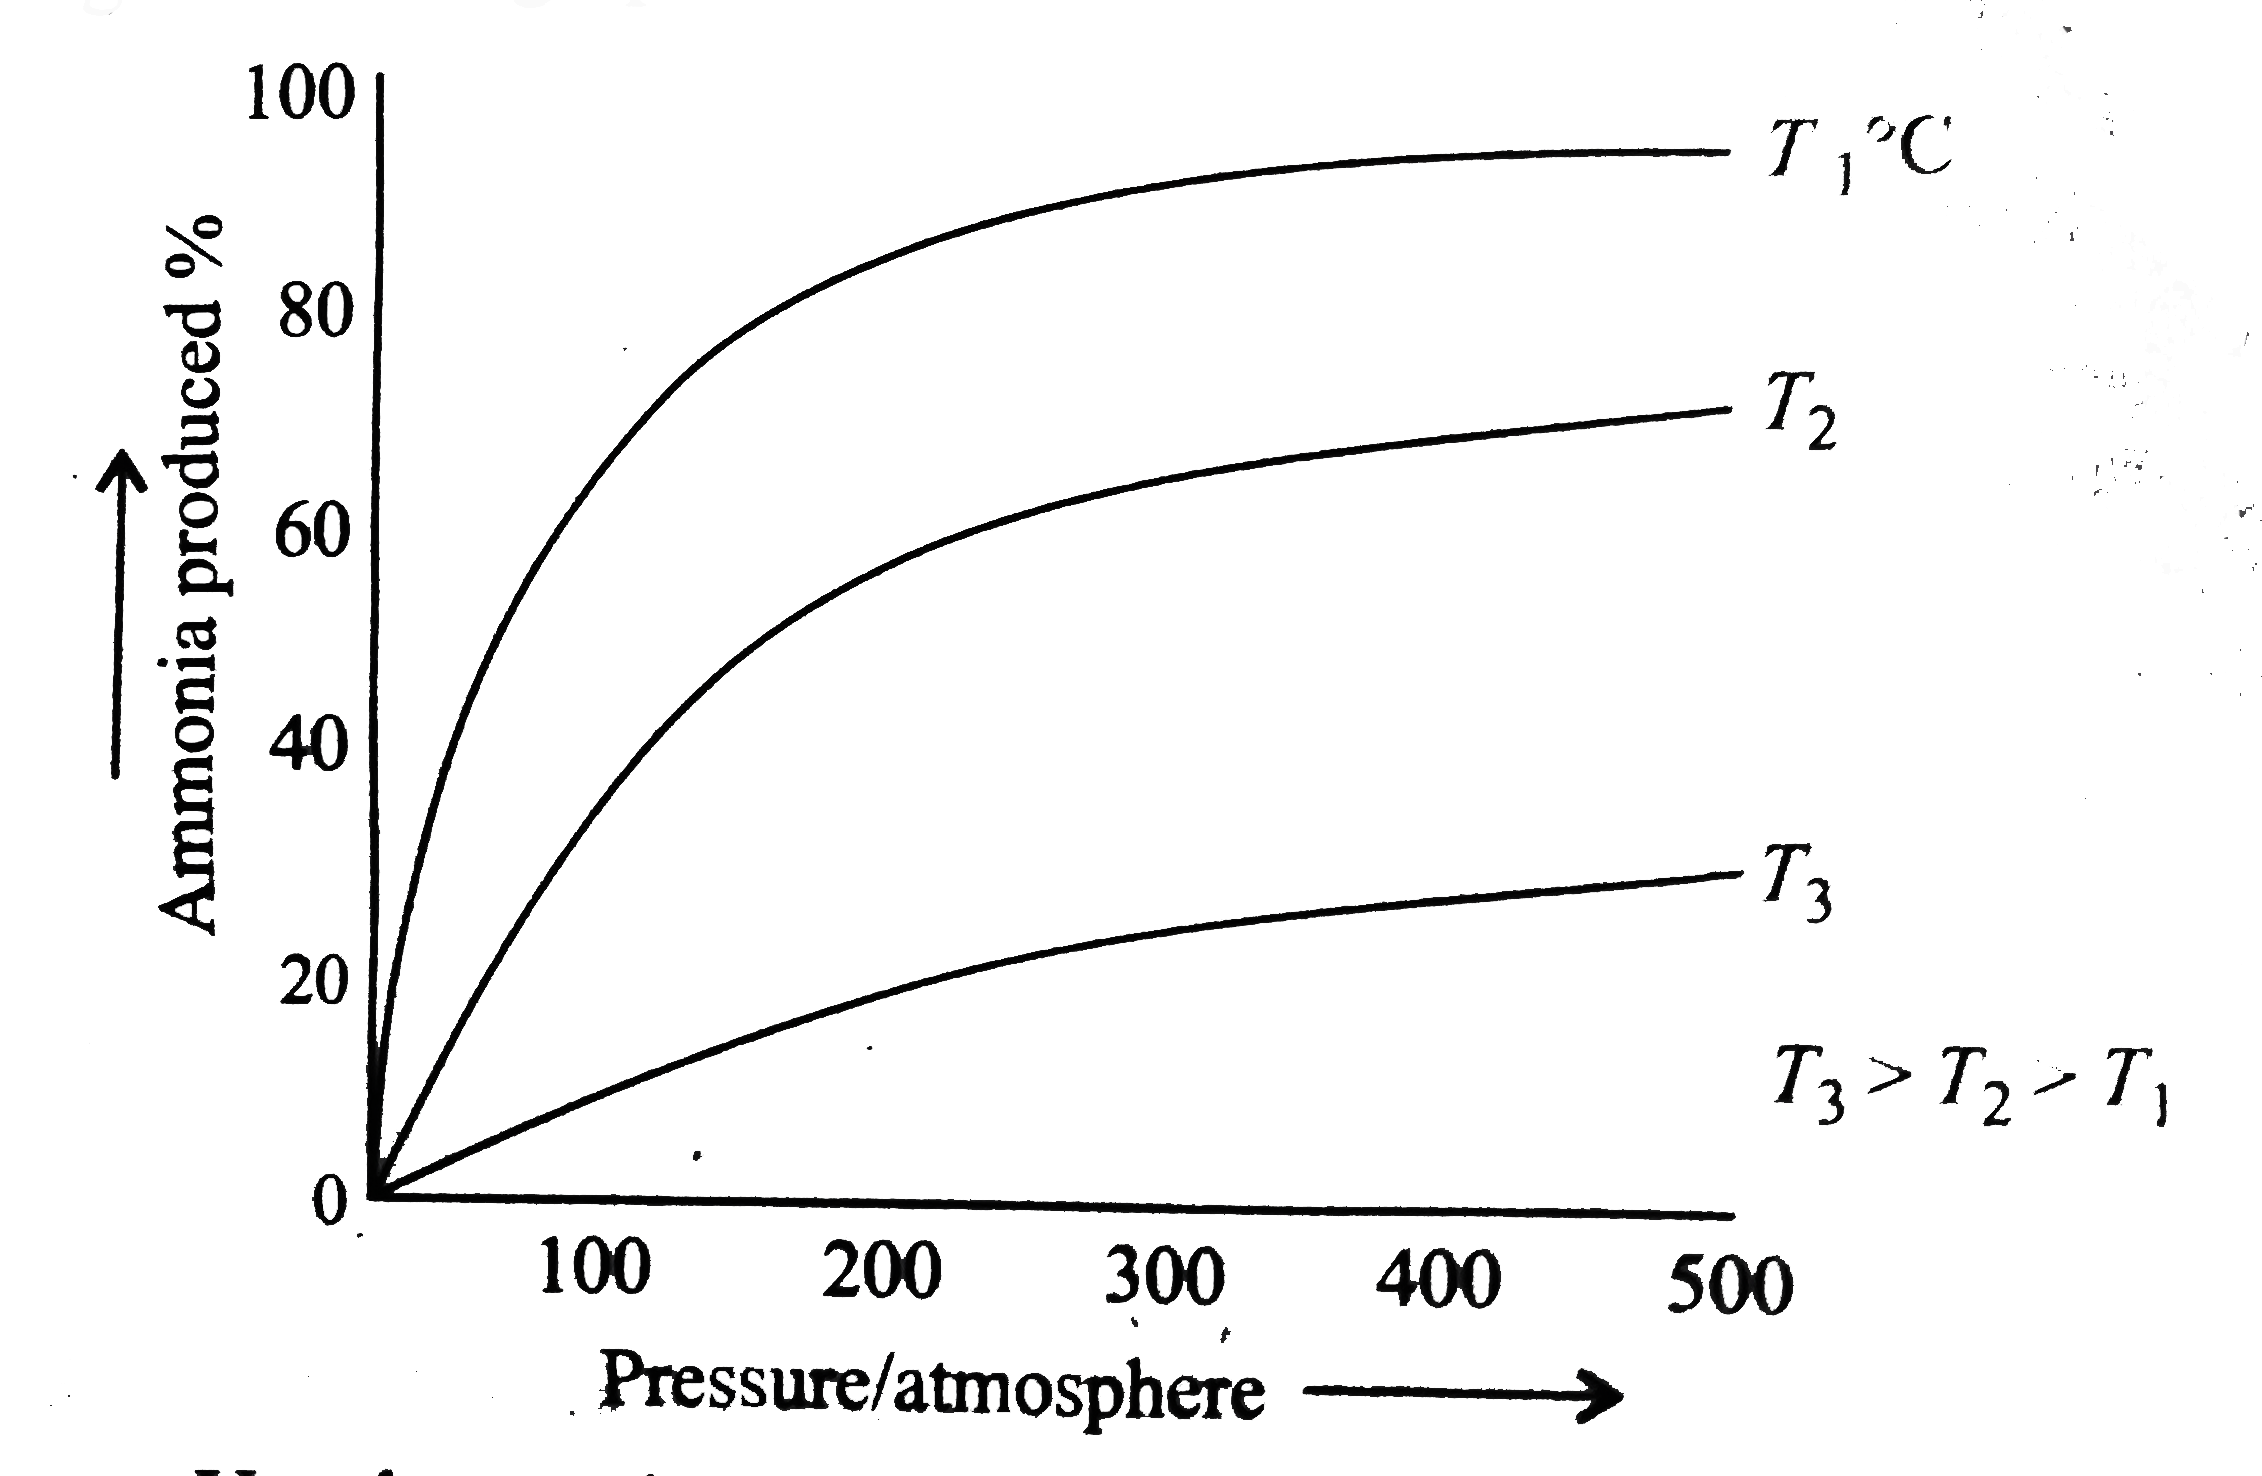
Use the graph answering the following questions:
What happens to the percentage of ammonia produced when the temperature is increased
View Solution10% of the bulbs produced in a factory are of red colour and 2% are red and defective. If one bulb is picked at random, determine the probability of its being defective if it red.
View SolutionOver the past 200 working days, the number of defective parts produced by a machine is given is given in the followig table.

Determine the probability that tomorrow's output will have
View SolutionThe persentage of ammonia produced from nitrogen and hydrogen under conditions of temperature and pressure is given in the graph
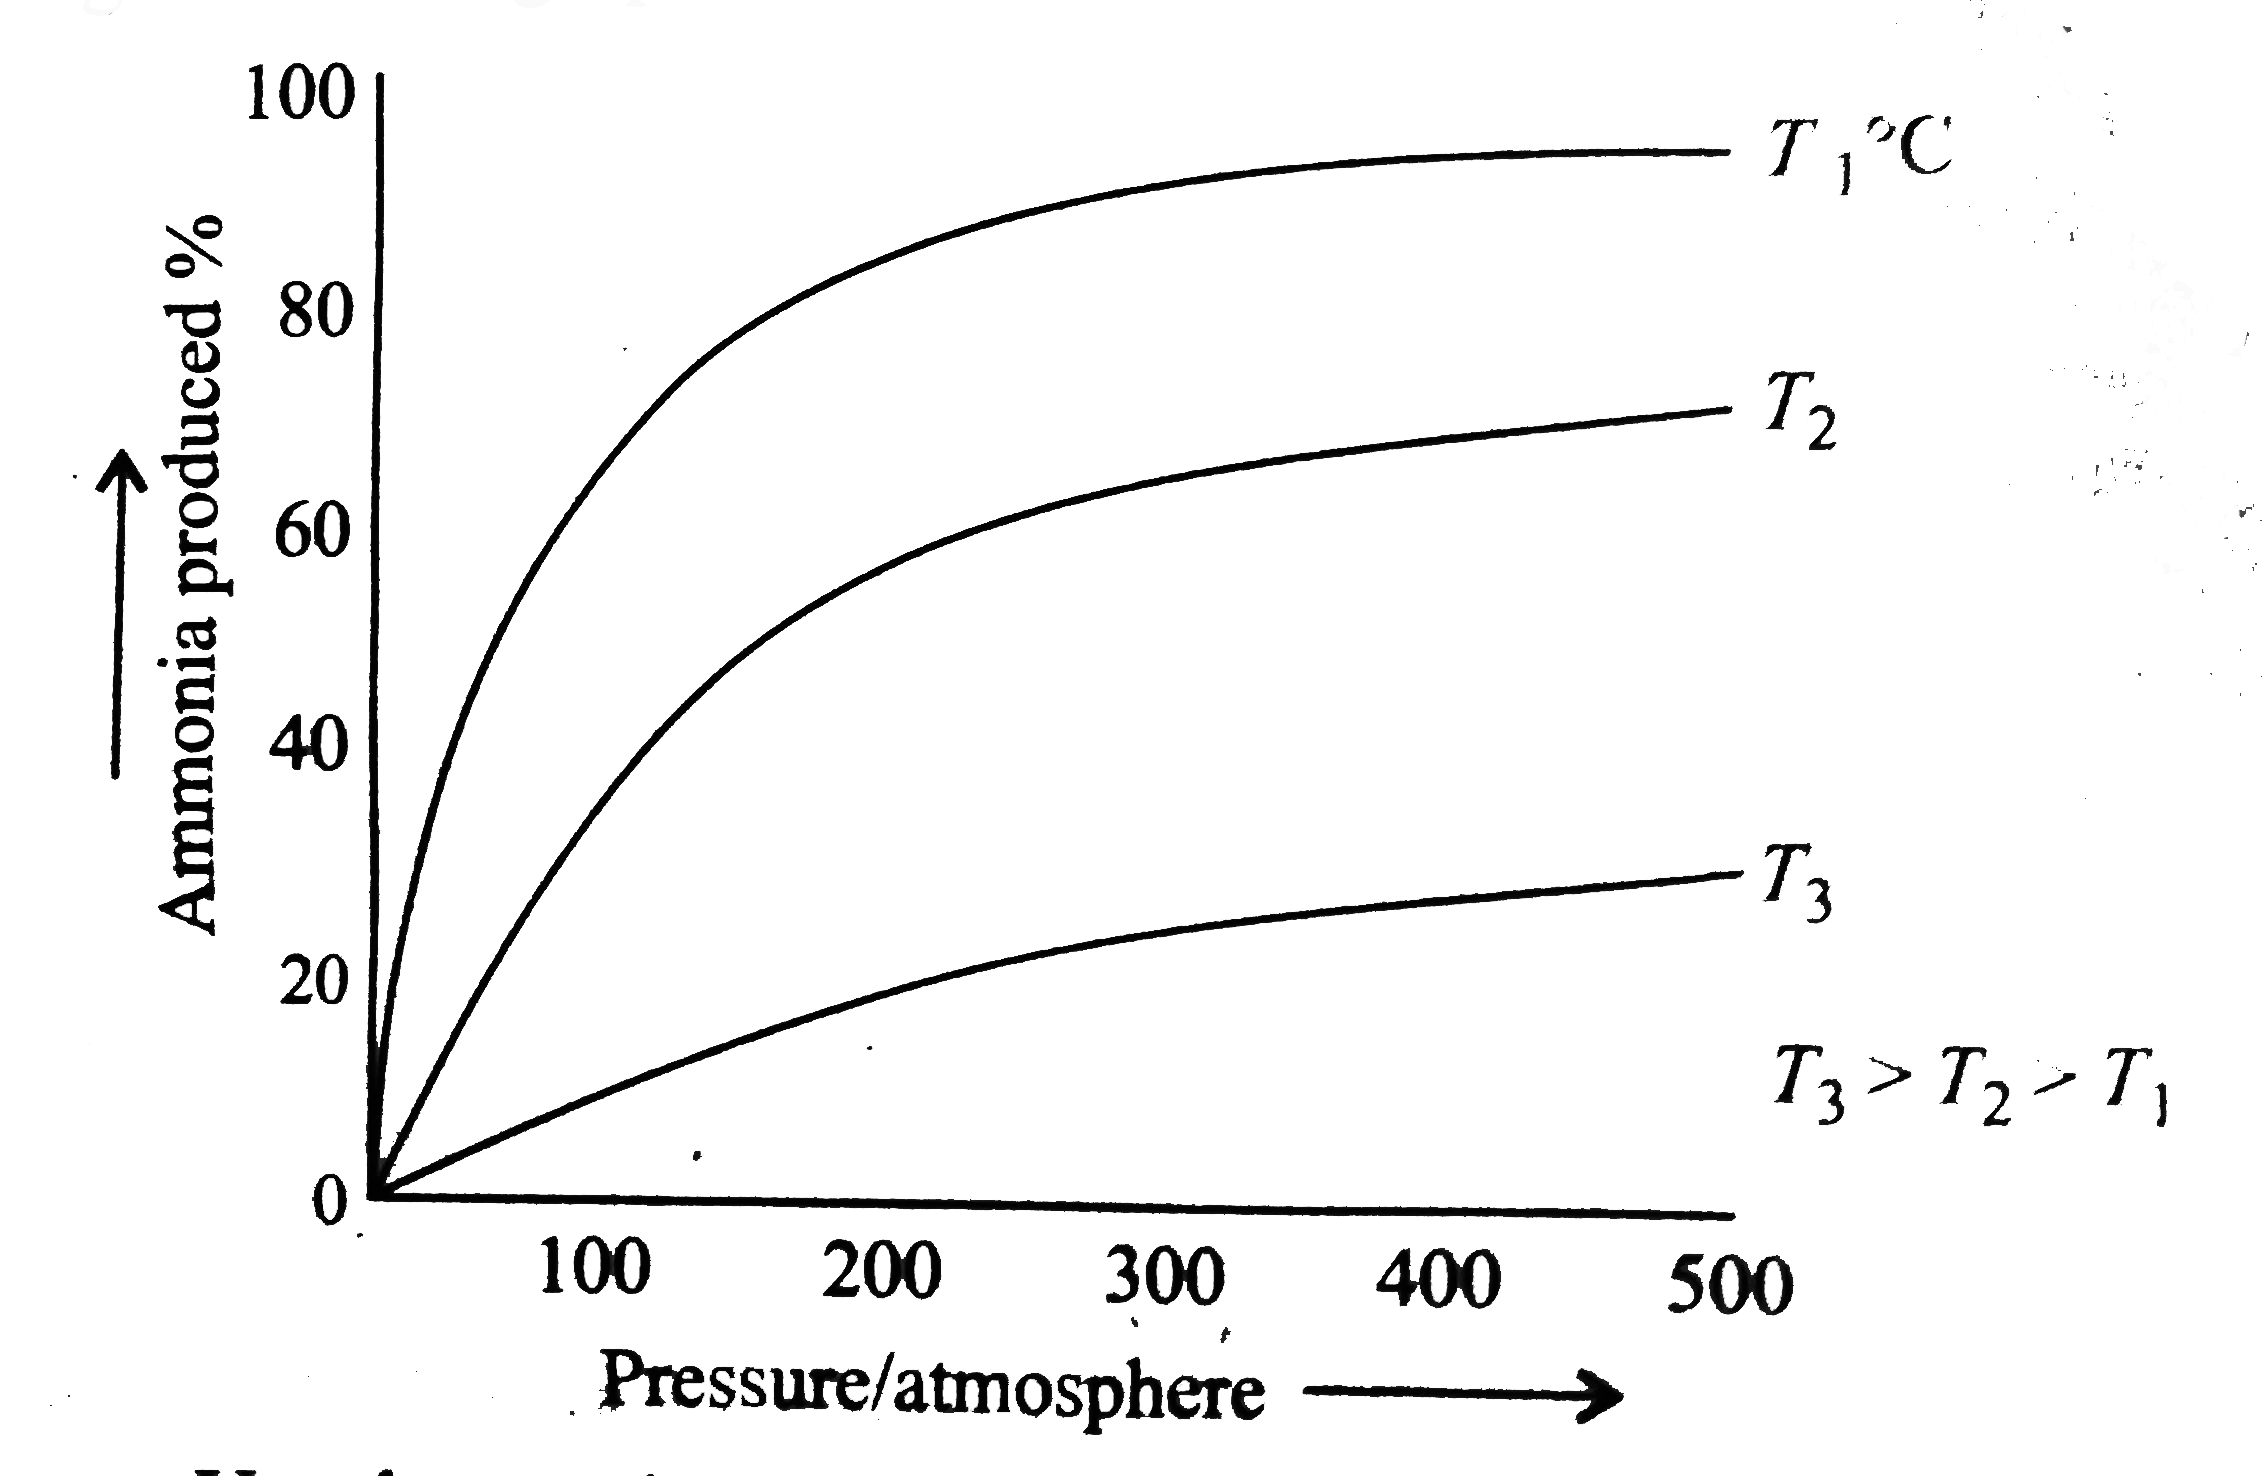
Use the graph answering the following questions:
What conditions of pressure produce the highest percentage of ammonia?
View Solution
