The following are the number of electric bulbs purchased for alodging house during the first four months of a year
To solve the problem of creating a pictograph based on the number of electric bulbs purchased for a lodging house during the first four months of the year, follow these steps:
1. Collect Data:
- Gather the number of bulbs purchased for each month:
- January: 20 bulbs
- February: 26 bulbs
- March: 30 bulbs
- April: 34 bulbs
2. Determine the Symbol Representation:
- Decide how to represent the data visually. In this case, we will use:
- 1 full bulb symbol (●) to represent 10 bulbs.
- A half bulb symbol (◐) to represent any remaining bulbs less than 10.
3. Create a Table:
- Set up a table with two columns: one for the months and one for the pictograph.
- The first column will list the months (January, February, March, April).
- The second column will contain the pictograph symbols.
4. Draw the Pictograph:
- For each month, convert the number of bulbs into the pictograph:
- January: 20 bulbs = 2 full bulbs (●●)
- February: 26 bulbs = 2 full bulbs and 1 half bulb (●●◐)
- March: 30 bulbs = 3 full bulbs (●●●)
- April: 34 bulbs = 3 full bulbs and 1 half bulb (●●●◐)
5. Final Table:
- Your final table with the pictograph will look like this:
| Month | Pictograph |
|-----------|--------------|
| January | ●● |
| February | ●●◐ |
| March | ●●● |
| April | ●●●◐ |
- Gather the number of bulbs purchased for each month:
- January: 20 bulbs
- February: 26 bulbs
- March: 30 bulbs
- April: 34 bulbs
- Decide how to represent the data visually. In this case, we will use:
- 1 full bulb symbol (●) to represent 10 bulbs.
- A half bulb symbol (◐) to represent any remaining bulbs less than 10.
- Set up a table with two columns: one for the months and one for the pictograph.
- The first column will list the months (January, February, March, April).
- The second column will contain the pictograph symbols.
- For each month, convert the number of bulbs into the pictograph:
- January: 20 bulbs = 2 full bulbs (●●)
- February: 26 bulbs = 2 full bulbs and 1 half bulb (●●◐)
- March: 30 bulbs = 3 full bulbs (●●●)
- April: 34 bulbs = 3 full bulbs and 1 half bulb (●●●◐)
- Your final table with the pictograph will look like this:
|-----------|--------------|
| January | ●● |
| February | ●●◐ |
| March | ●●● |
| April | ●●●◐ |
Topper's Solved these Questions
- DATA HANDLINGBOOK - NCERT ENGLISHCHAPTER - DATA HANDLINGEXERCISE - EXERCISE 9.3
3 Videos
- DATA HANDLINGBOOK - NCERT ENGLISHCHAPTER - DATA HANDLINGEXERCISE - EXERCISE 9.4
4 Videos
- DATA HANDLINGBOOK - NCERT ENGLISHCHAPTER - DATA HANDLINGEXERCISE - EXERCISE 9.1
7 Videos
- BASIC GEOMETRICAL IDEASBOOK - NCERT ENGLISHCHAPTER - BASIC GEOMETRICAL IDEASEXERCISE - EXERCISE 4.6
4 Videos
- DECIMALSBOOK - NCERT ENGLISHCHAPTER - DECIMALSEXERCISE - EXERCISE 8.3
2 Videos
Similar Questions
Write the following sets in set builder form :
B = {all months of a year}
View SolutionA bulb manufacturing company tests the bulbs produced by four different machines. The following graph gives the number of bulbs tested that are produced by each machine and the number that are found to be defective.
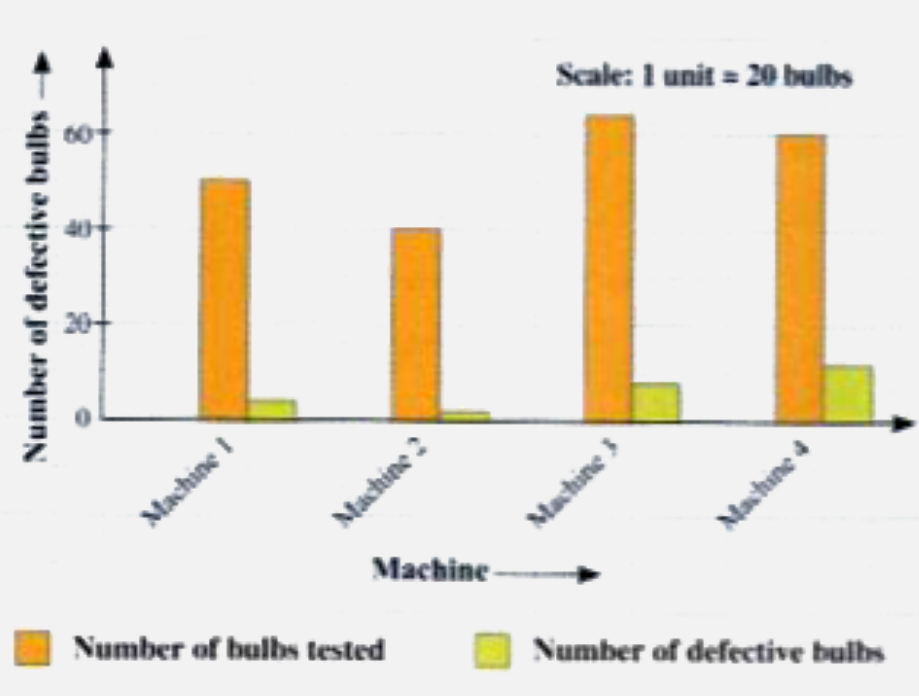
Read the graph and answer the following.
What percentage of bulbs produced by each of the four machines is defective
View Solution
Knowledge Check
The graph below shows the number of people visiting a museum during the first 5 months of the year . How many people need to visit the museum during june for the mean of the first 6 months to equal to mean of the first 5 months ?
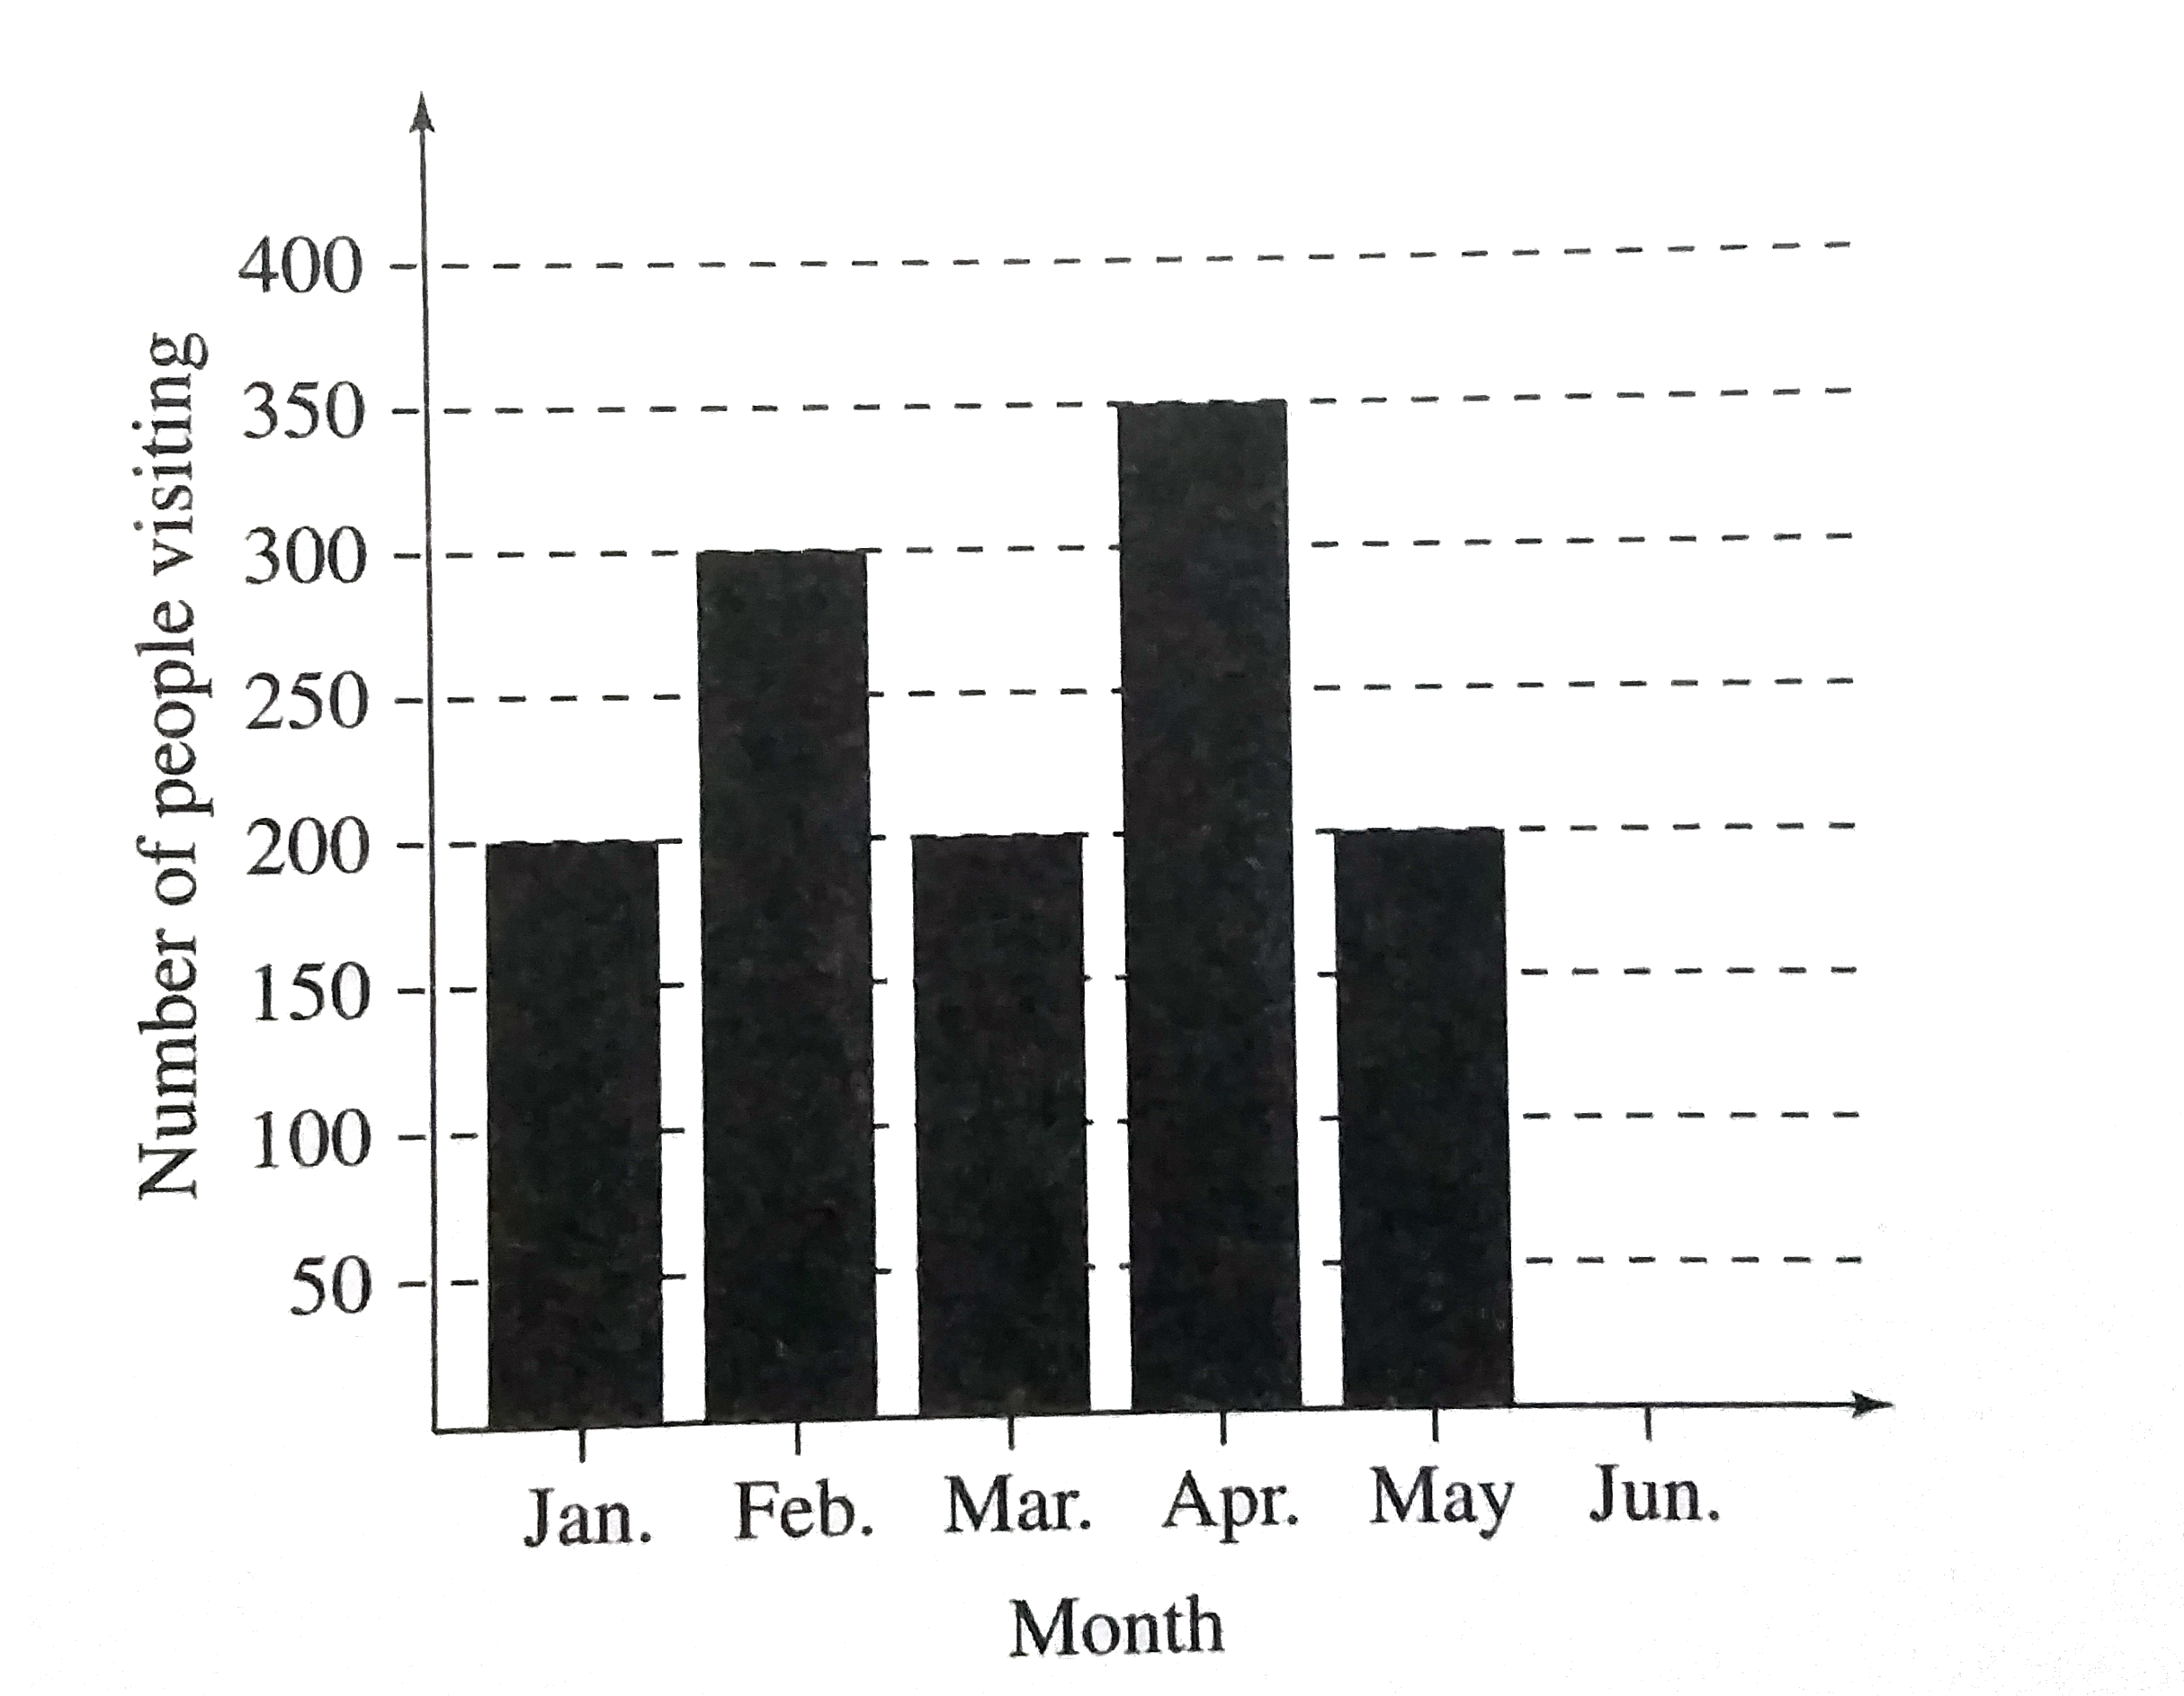 A0B200C250D500
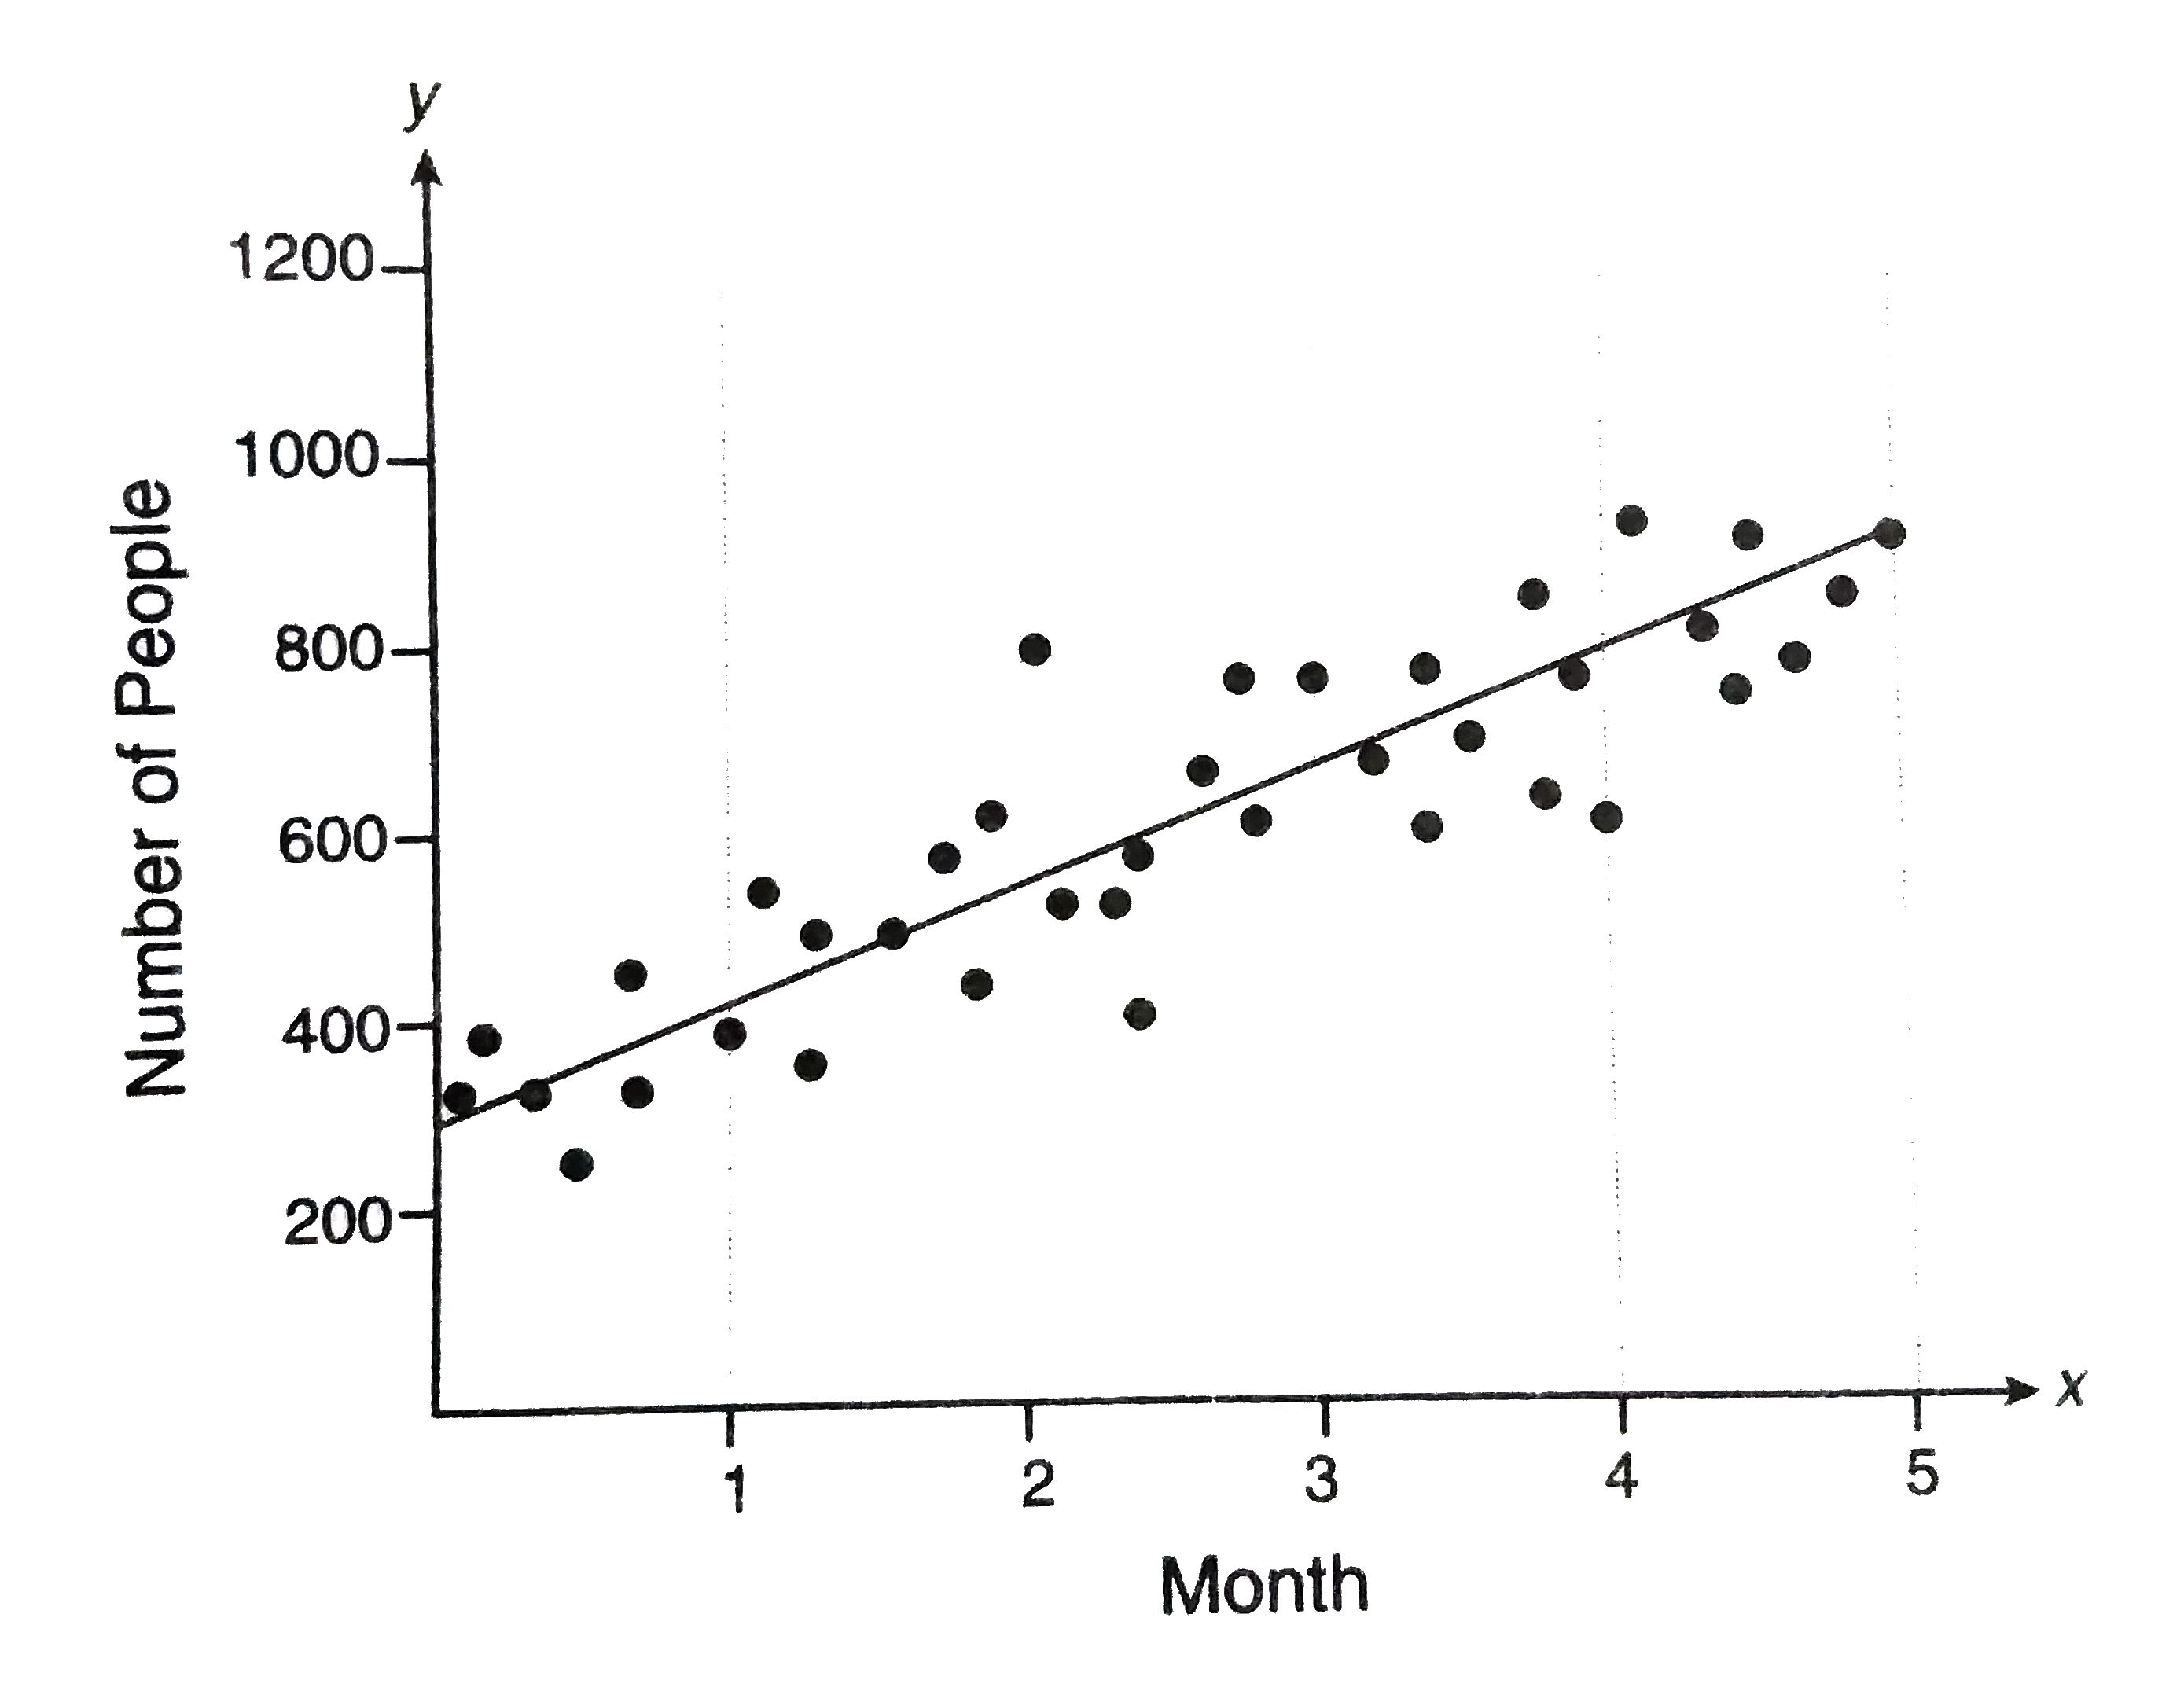
A new fitness class was started at several fitness clubs owned by the same company. The scatterplot shows the total number of people attending the class during the first five months in which the class was offered. The line of best fit is drawn.
Q. During the five-month period, the average increase in the number of people attending the class per month is closest to which of the following?A80B100C120D140The following chart shows the cost of one Roku streaming device at a discount store during each of the first 6 months of the year.

The percent decrease in the cost of the device from January to June was closest toA12%B40%C50%D60%
A bulb manufacturing company tests the bulbs produced by four different machines. The following graph gives the number of bulbs tested that are produced by each machine and the number that are found to be defective.
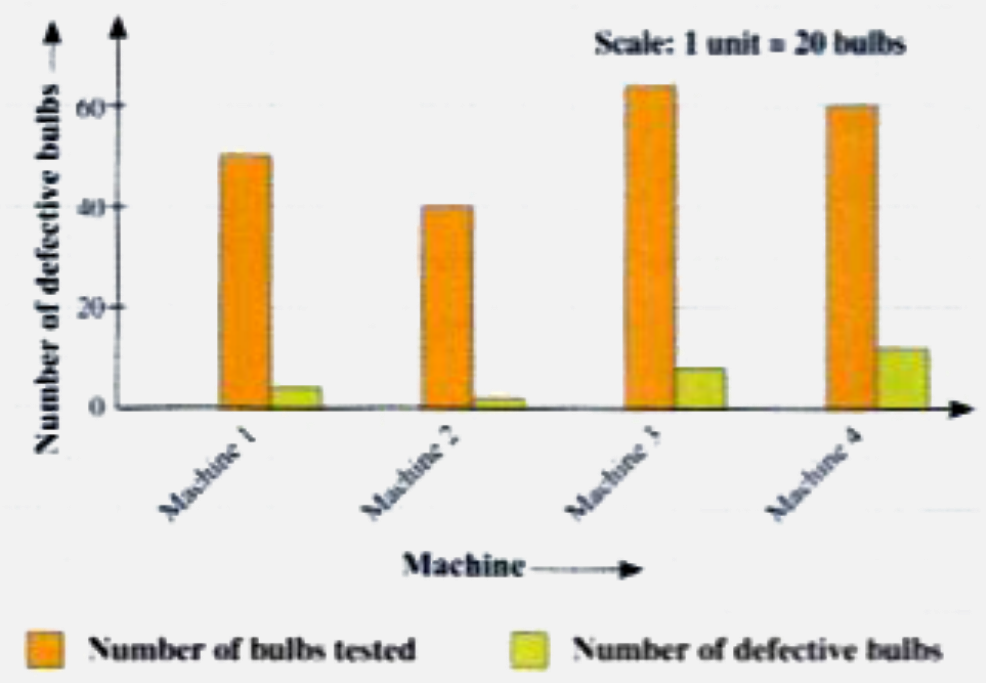
Read the graph and answer the following.
Which is the worst machined?
View SolutionA bulb manufacturing company tests the bulbs produced by four different machines. The following graph gives the number of bulbs tested that are produced by each machine and the number that are found to be defective.

Read the graph and answer the following.
Which is the best machine?
View SolutionChampa went to a 'Sale' to purchase some pants and skirts. When her friends asked her how many of each she had bought, she answered, The number of skirts is two less than twice the number of pants purchased. Also, the number of skirts is four less than four times the number of pants purchased. Help her friends to find how many pants and skirts Champa bought.
View SolutionThe following table gives the number of households in USA during 2000-2014.
The following charts give the distribution of households based on the numbers of children for the years 2000 and 2014.

The following charts give the distribution based on the number of childre for the year 2000 and 2014.
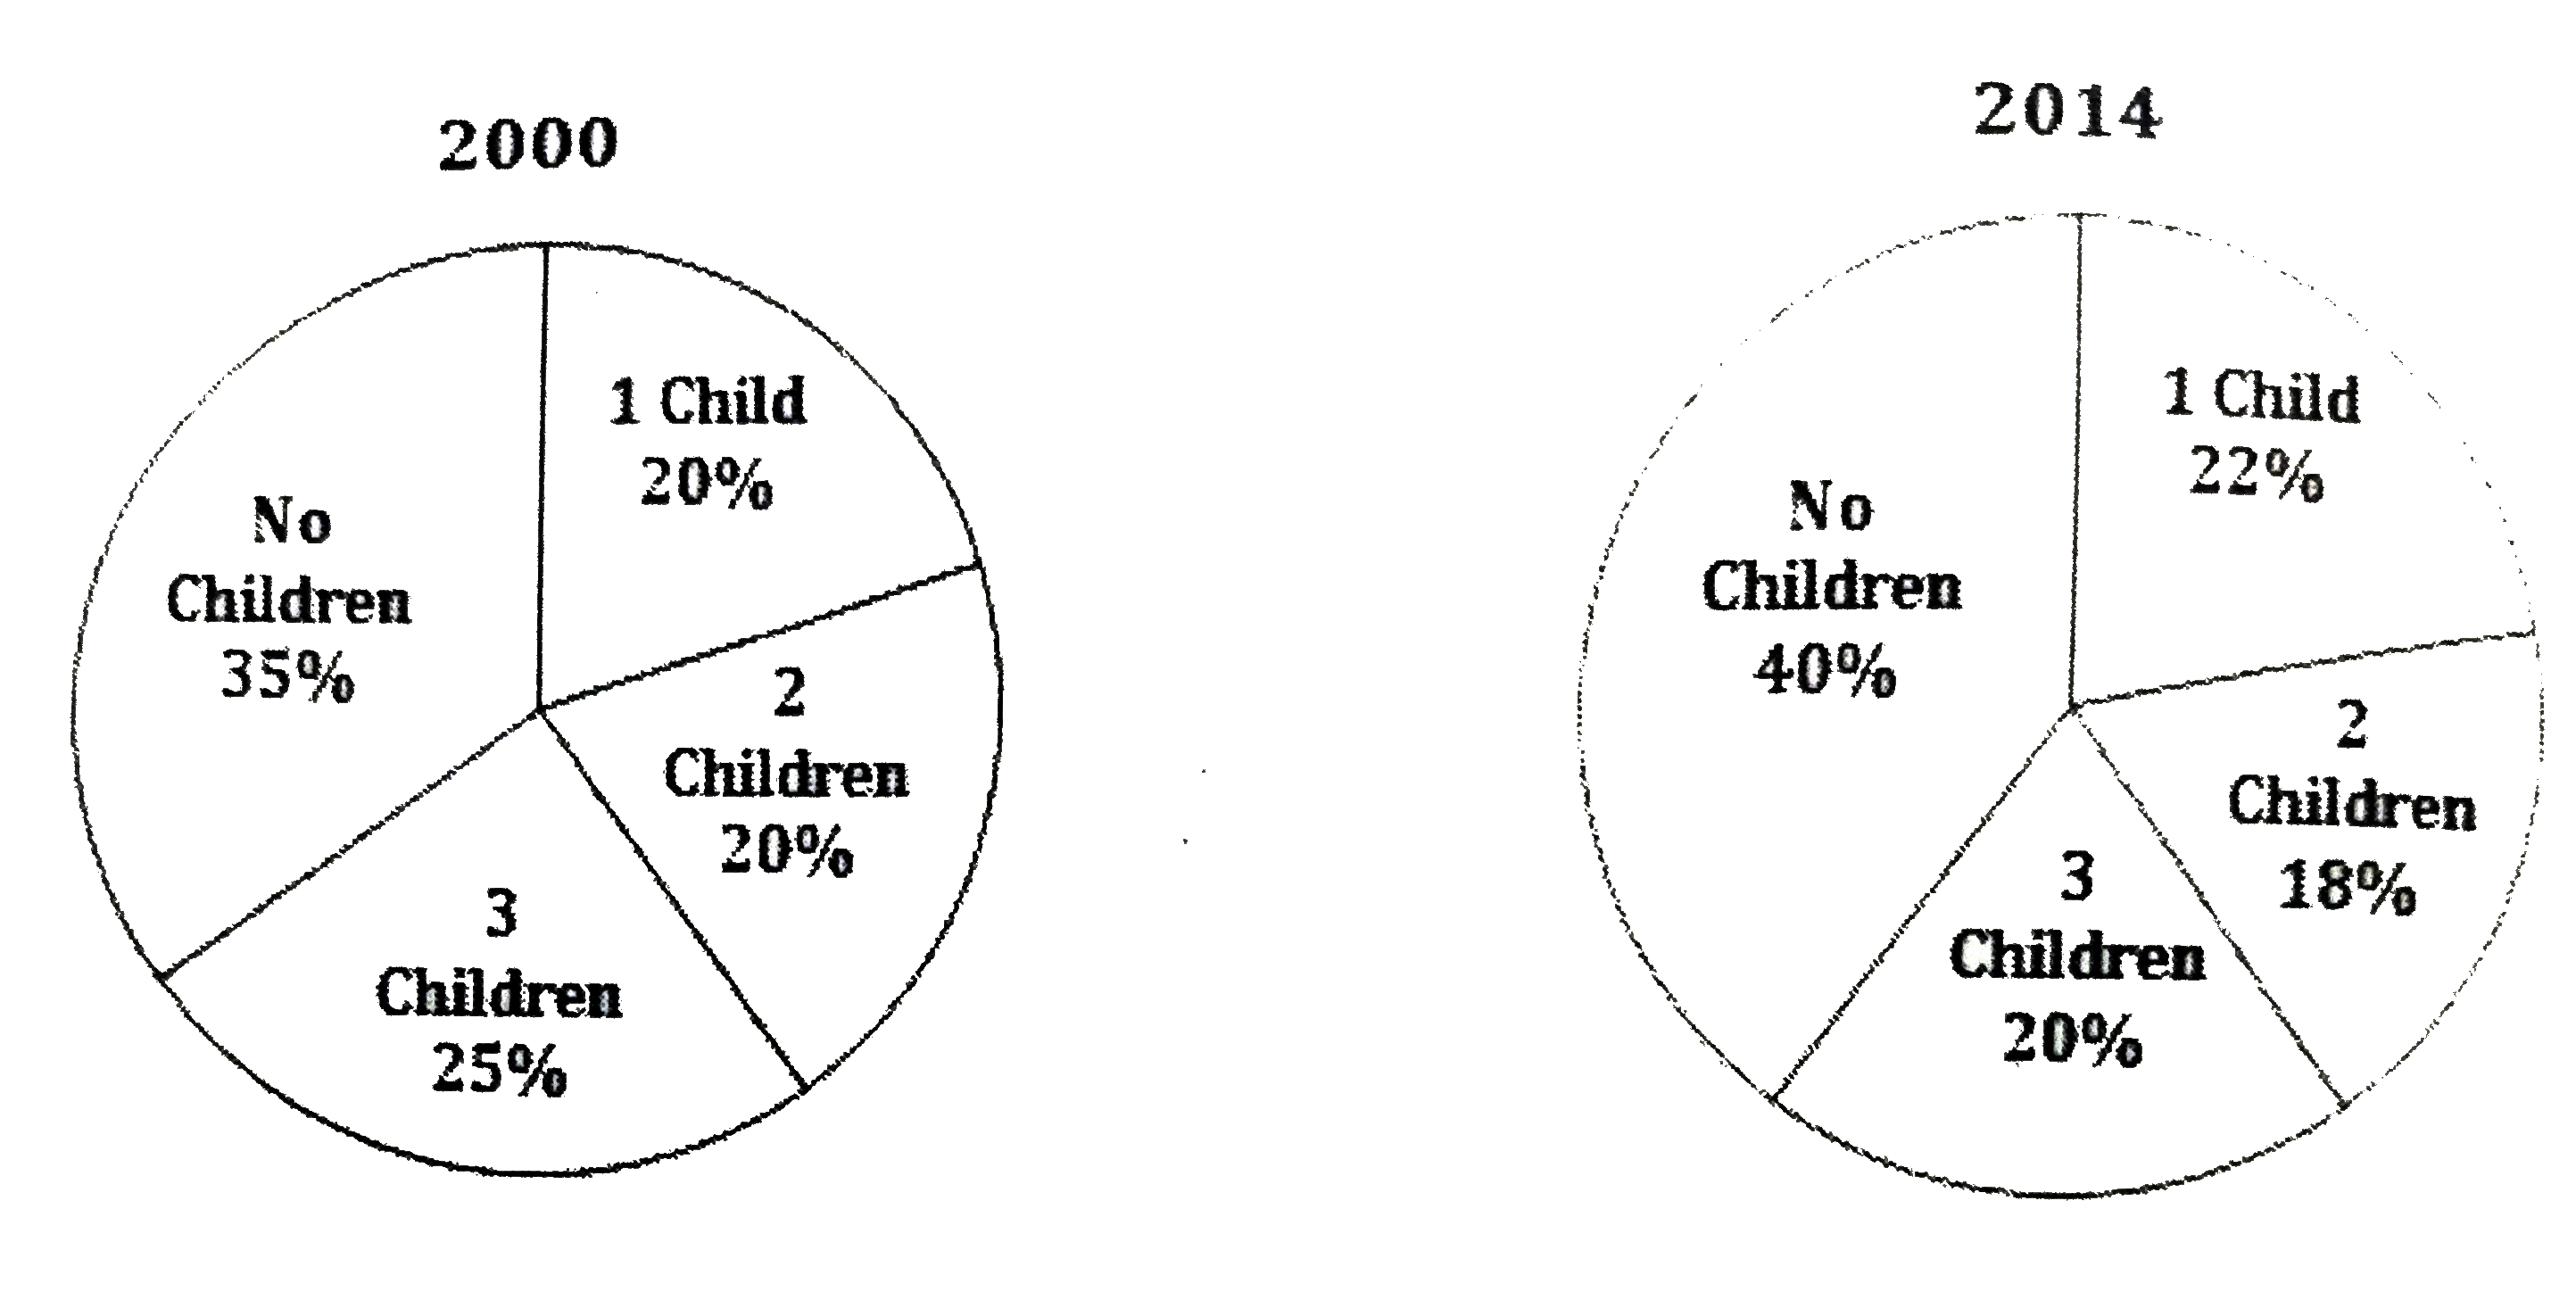
In the above problem, how many additional children were born in that year ?
View SolutionThe following table gives the number of households in USA during 2000-2014.
The following charts give the distribution of households based on the numbers of children for the years 2000 and 2014.

The following charts give the distribution based on the number of childre for the year 2000 and 2014.
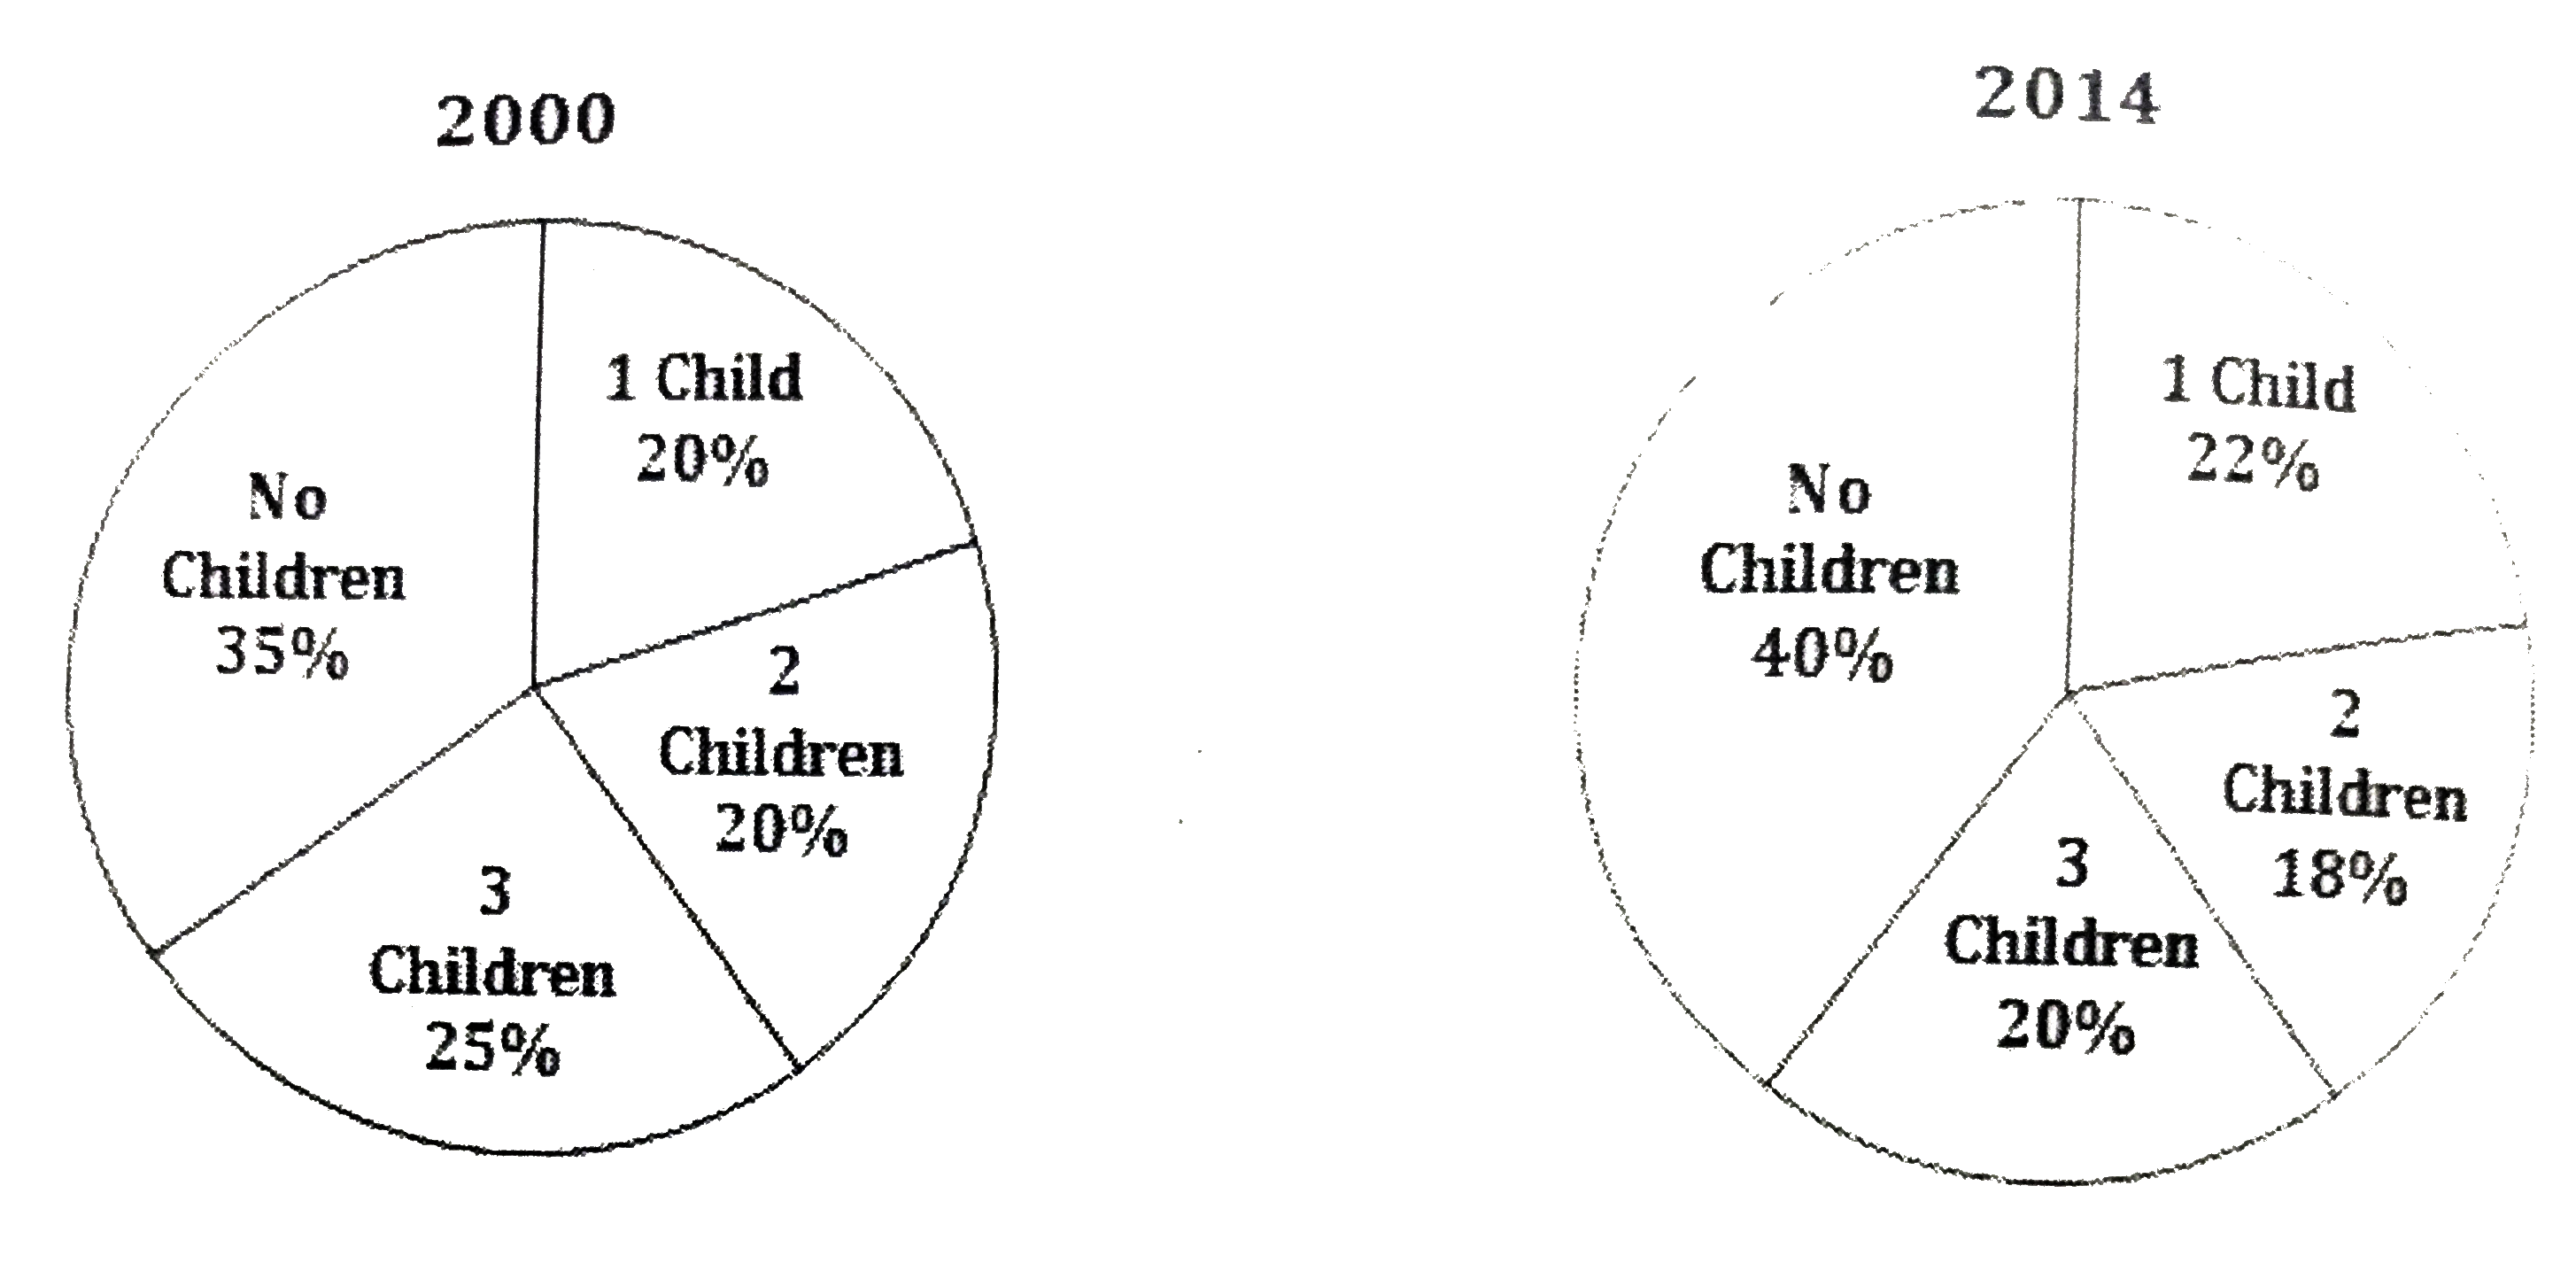
What is the total number of children in 2014?
View Solution
