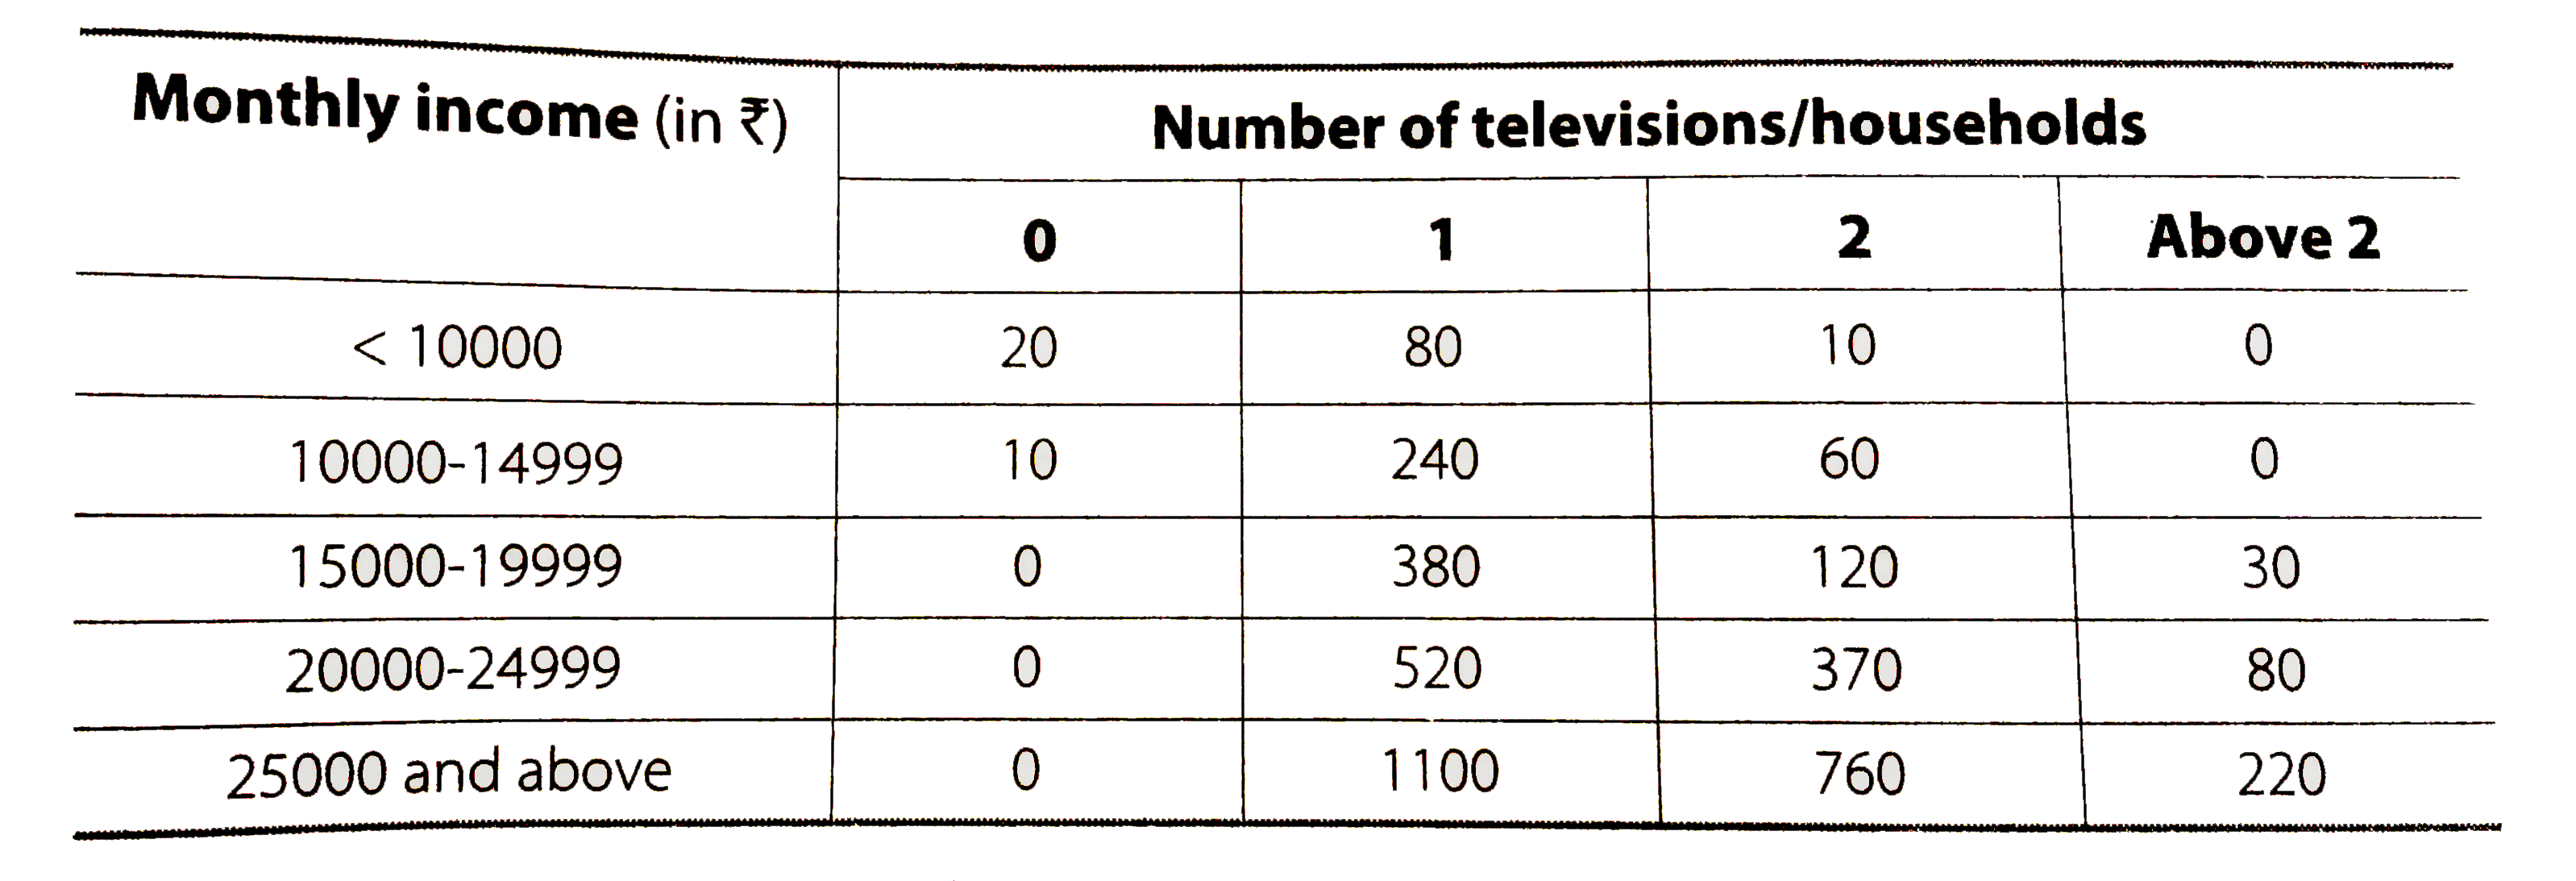
A company selected 4000 households at random and surveyed them to find out a relationship between income level and the number of televisions sets in a home. The information, so obtained is listed in the following table.

Find the probability
i) of a household earning Rs 10000- Rs 14999 per year and having exactly one television.
ii) of a household earning Rs 25000 and more per year owning 2 televisions.
iii) of a household not having any television.
The total number of the households selected by the company.
n(S)=4000
i) Number of households earning Rs 10000 - Rs 14999 per year and having exactly one television, n(E1)=240
∴ Required probability =n(E1)n(ES)=2404000=6100=350=0.06
Hence, the probability of a household earning Rs 1000 - Rs 14999 per year owning 2 televisions, n(E2)=760
Required probability = n(E2)n(S)=7604000
=0.19
Hence, the probability of a household earning Rs 25000 and more per year owning 2 televisions is 0.19.
Hence, the probability of a household earning Rs 25000 and more per year owning 2 televisions is 0.19.
iii) Number of households not having any televisions, n(E3)=30
∴ Required probability=n(E3)n(S)=304000=3400
Hence, the probability of a household not having any television is 3/400.
Topper's Solved these Questions
- STATISTICS AND PROBABILITYBOOK - NCERT EXEMPLAR ENGLISHCHAPTER - STATISTICS AND PROBABILITYEXERCISE - LONG ANSWER TYPE QUESTIONS
12 Videos
- STATISTICS AND PROBABILITYBOOK - NCERT EXEMPLAR ENGLISHCHAPTER - STATISTICS AND PROBABILITYEXERCISE - VERY SHORT ANSWER TYPES QUESTIONS
10 Videos
- QUADRILATERALS BOOK - NCERT EXEMPLAR ENGLISHCHAPTER - QUADRILATERALS EXERCISE - LONG ANSWER TYPE QUESTIONS
18 Videos
- TRIANGLESBOOK - NCERT EXEMPLAR ENGLISHCHAPTER - TRIANGLESEXERCISE - LONG ANSWER TYPE QUESTIONS
21 Videos
Similar Questions
A company selected 2400 families at random and survey them to determine a relationship between income level and the number of vehicles in a home. The information gathered is listed in the table below: If a family is chosen, find the probability that the family is: (i) earning Rs.10000-13000 per month and owning exactly 2 vehicles. (ii) earning Rs. 16000 or more per month and owning exactly 1 vehicle (iii) Earning less than Rs. 7000 per month and does not own any vehicle. (iv) earning Rs.13000-16000 per month and owning more than 2 vehicle. (v) owning not more than 1 vehicle. (vi) owning at least one vehicle.
View SolutionAn organisation selected 2400 families at random and surveyed them to determine relationship between income level and the number of vechicles in a family. The information gathered is listed in the table below:

Suppose a family is chosen. Find the probability that the family chosen is :
(i) earning Rs. 10000-13000 per month and owning exactly 2 vehicles.
(ii) earning Rs. 16000 or more per month and owning exactly 1 vehicle.
(iii) earning less than Rs. 7000 per month and does not own any vehicle.
View SolutionA company selected 2400 families at random and survey them to determine a relationship between income level and the number of vehicles in a home. The information gathered is listed in the table below: Monthly income (in Rs.) Vehicles per family 0 1 2 Above 2 Less than 7000 10 160 25 0 7000-10000 0 305 27 2 10000-13000 1 535 29 1 13000-16000 2 469 29 25 16000 or more 1 579 82 88 If a family is chosen, find the probability that the family is: earning Rs. 10000-13000 per month and owning exactly 2 vehicles. earning Rs. 16000 or more per month and owning exactly 1 vehicles. Earning less than Rs. 7000 per month and does not own any vehicle. Earning Rs. 13000-16000 per month and owning more than 2 vehicle. owning not more than 1 vehicle owning at least one vehicle.
View SolutionAn insurance company selected 2000 drivers at random (i.e., without any preference of one driver over another) in a particular city to find a relationship between age and accidents. The data obtained are given in the following table: Find the probabilities of the following events for a driver chosen at random from the city: (i) The driver being in the age group 18−29 years and having exactly 3 accidents in one year. (ii) The driver being in the age group of 30−50 year and having one or more accidents in a year. (iii) The number of drivers having no accidents in one year
View SolutionFrom the following data calculate the percentage of employees who earn more than Rs. 120.96 per day.

View SolutionA survey conducted on 20 households in a locality by a group of students resulted in the following frequency table for the number of family members in a household:Find the mode of this data.
View Solution8 men or 6 women earn Rs. 960 in one day.
One day's earning of a woman.
View SolutionThe standard household voltage for an Indian home
View SolutionA mand earns Rs 75000 in 5 months
In hwo many months willhe earn Rs 45000
View SolutionA dealer purchased 125 colour television sets. If the cost of each set is Rs. 19820, determine the cost of all sets together.
View Solution
