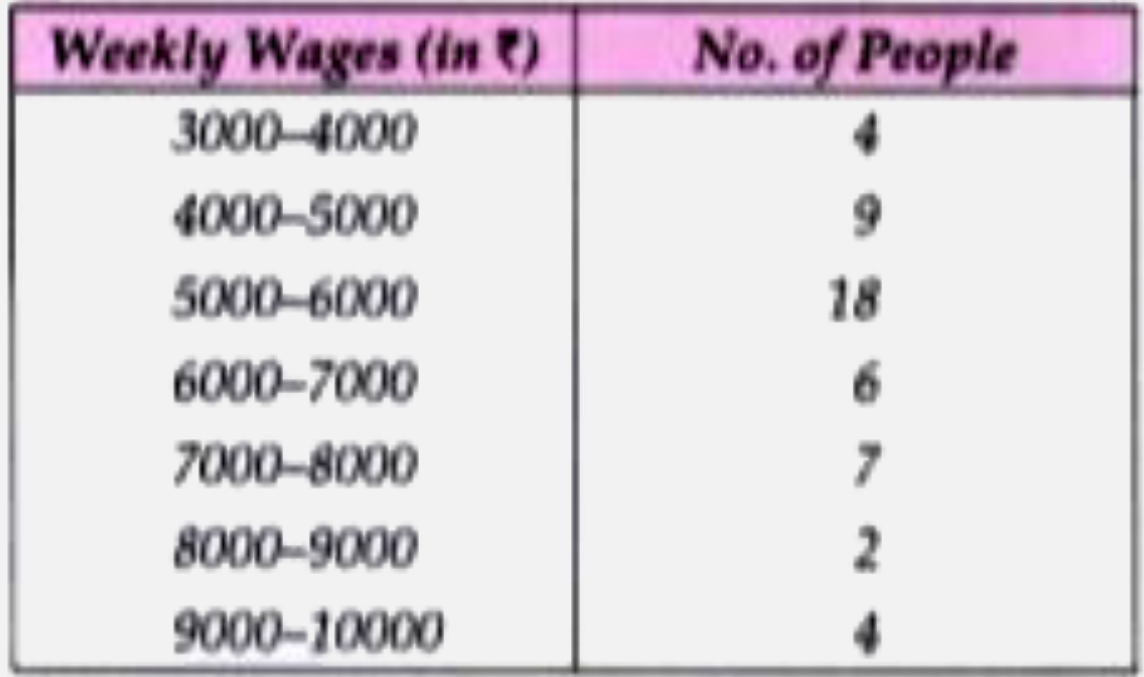
A Mathematics aptitude test of 50 students was recorded as follows:

Draw a histogram for the above data using a graph paper and locate the mode:
The correct Answer is:82 (app)
Step by step video & image solution for A Mathematics aptitude test of 50 students was recorded as follows: Draw a histogram for the above data using a graph paper and locate the mode: by Maths experts to help you in doubts & scoring excellent marks in Class 10 exams.
Updated on:21/07/2023Topper's Solved these Questions
- MEASURES OF CENTRAL TENDENCY (MEAN, MEDIAN, QUARTILES AND MODE)BOOK - ICSECHAPTER - MEASURES OF CENTRAL TENDENCY (MEAN, MEDIAN, QUARTILES AND MODE)EXERCISE - EXERCISE 24 (D)
8 Videos
- MATRICESBOOK - ICSECHAPTER - MATRICESEXERCISE - Exercise 9D
25 Videos
- MIXED PRACTICE BOOK - ICSECHAPTER - MIXED PRACTICE EXERCISE - SET B
52 Videos
Similar Questions
Draw a histogram for the following data:

View SolutionDraw a histogram for the following data:

View SolutionDraw a histogram for the following data:

View SolutionDraw a histogram for the following data:

View SolutionDraw a histogram for the following data :

View SolutionDraw a Histogram for the data, using a graph paper:

Estimate the mode from the graph.
View SolutionDraw a histogram from the following data:

View Solution(Use a graph paper for this question). The daily pocket expenses of 200 students in a school are given below:

Draw a histogram representing the above distribution and estimate the mode from the graph.
View SolutionDaily absence from a school during three weeks is recorded as follows :

Draw a graph , illustrating the above data . Calculate the 5 - days moving average and plot them on the same graph .
View SolutionDraw a bar graph from the following data:

View Solution
