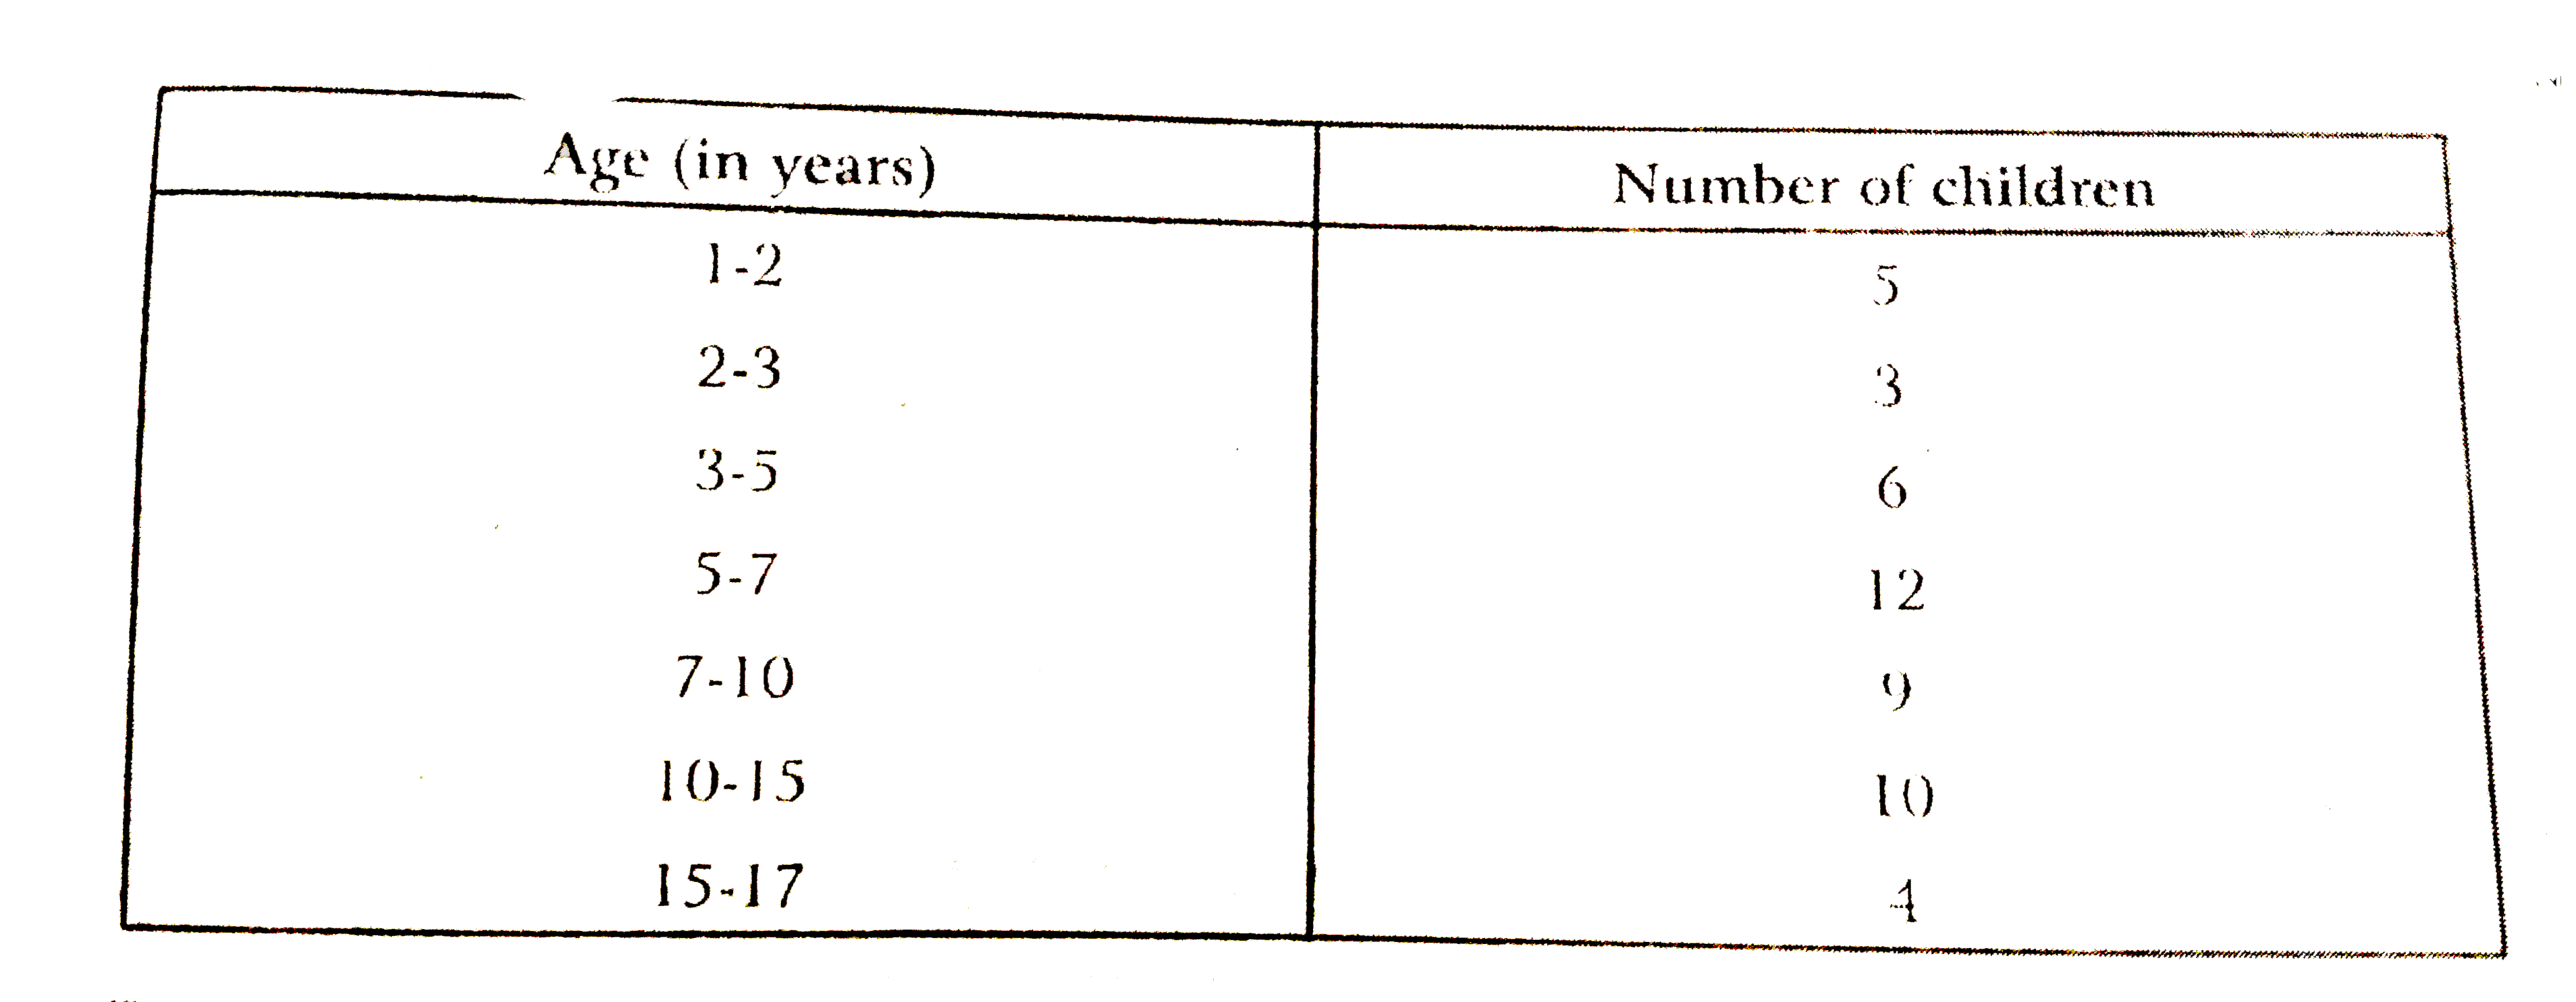
A random survey of the number of children of various are groups playing in park was found as follows :

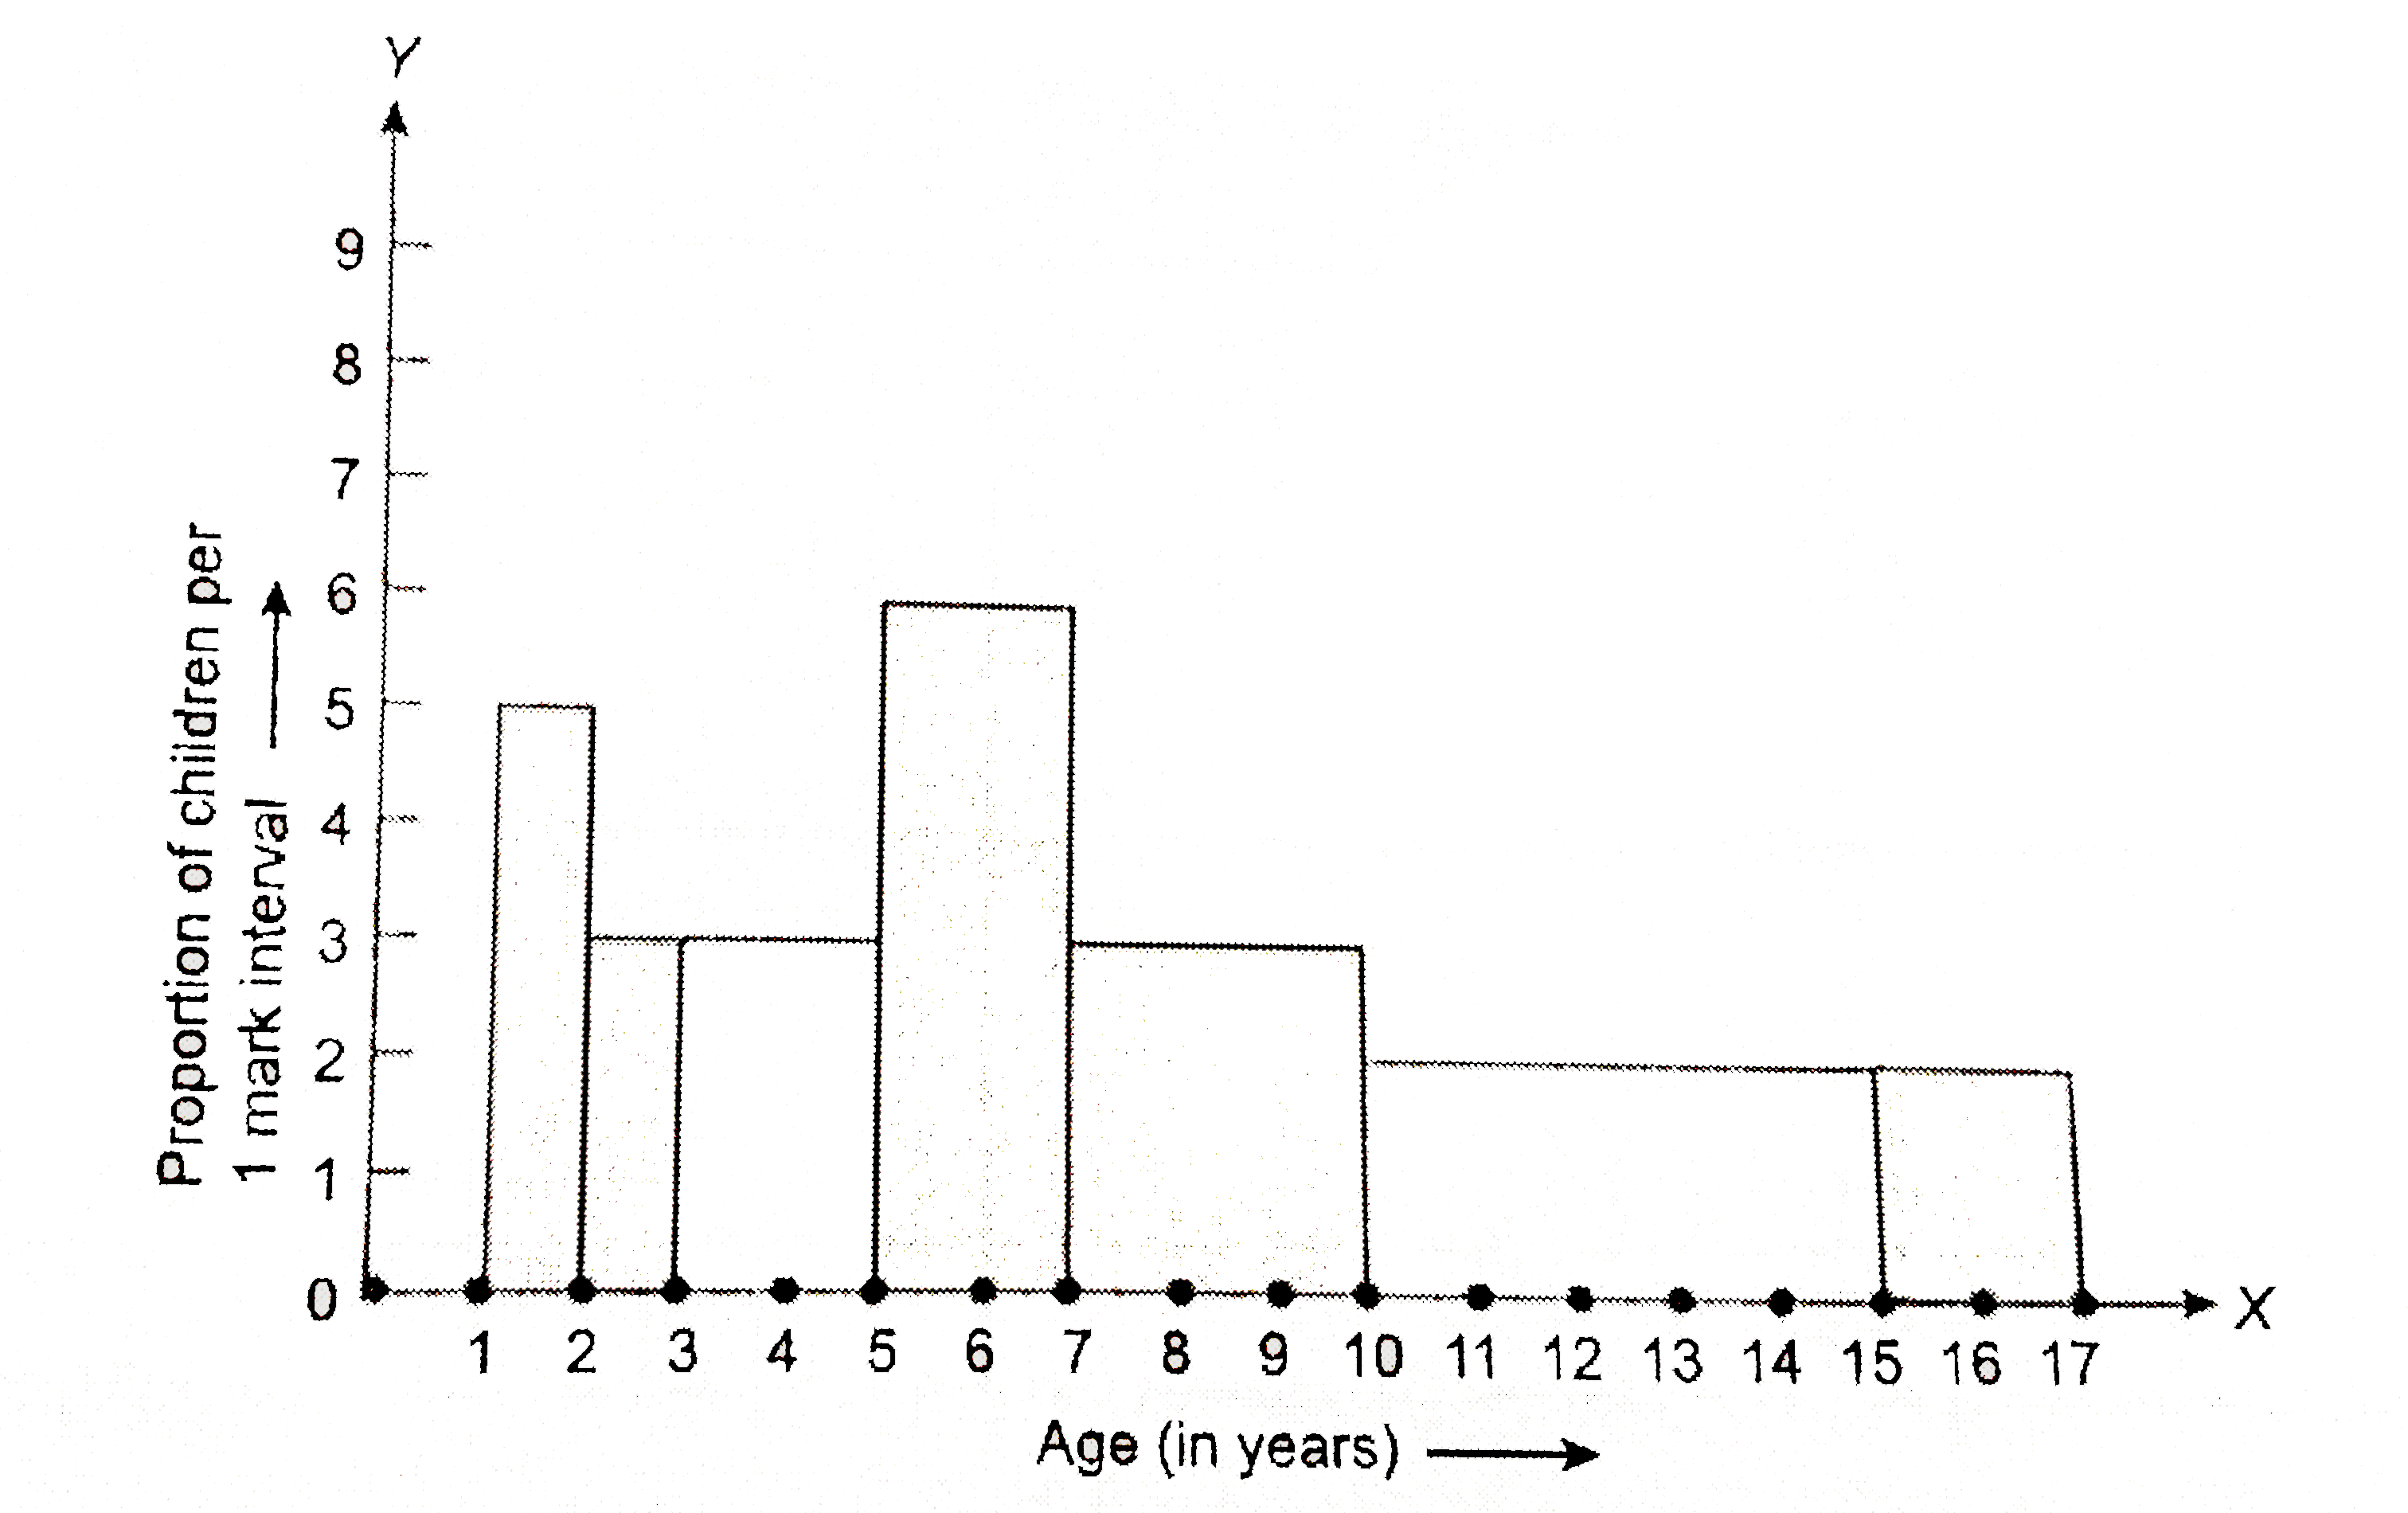
Draw a histogram to represent the data above.
Text Solution
We know that, the areas of the rectangles are proportional to the frequencies in a histogram.
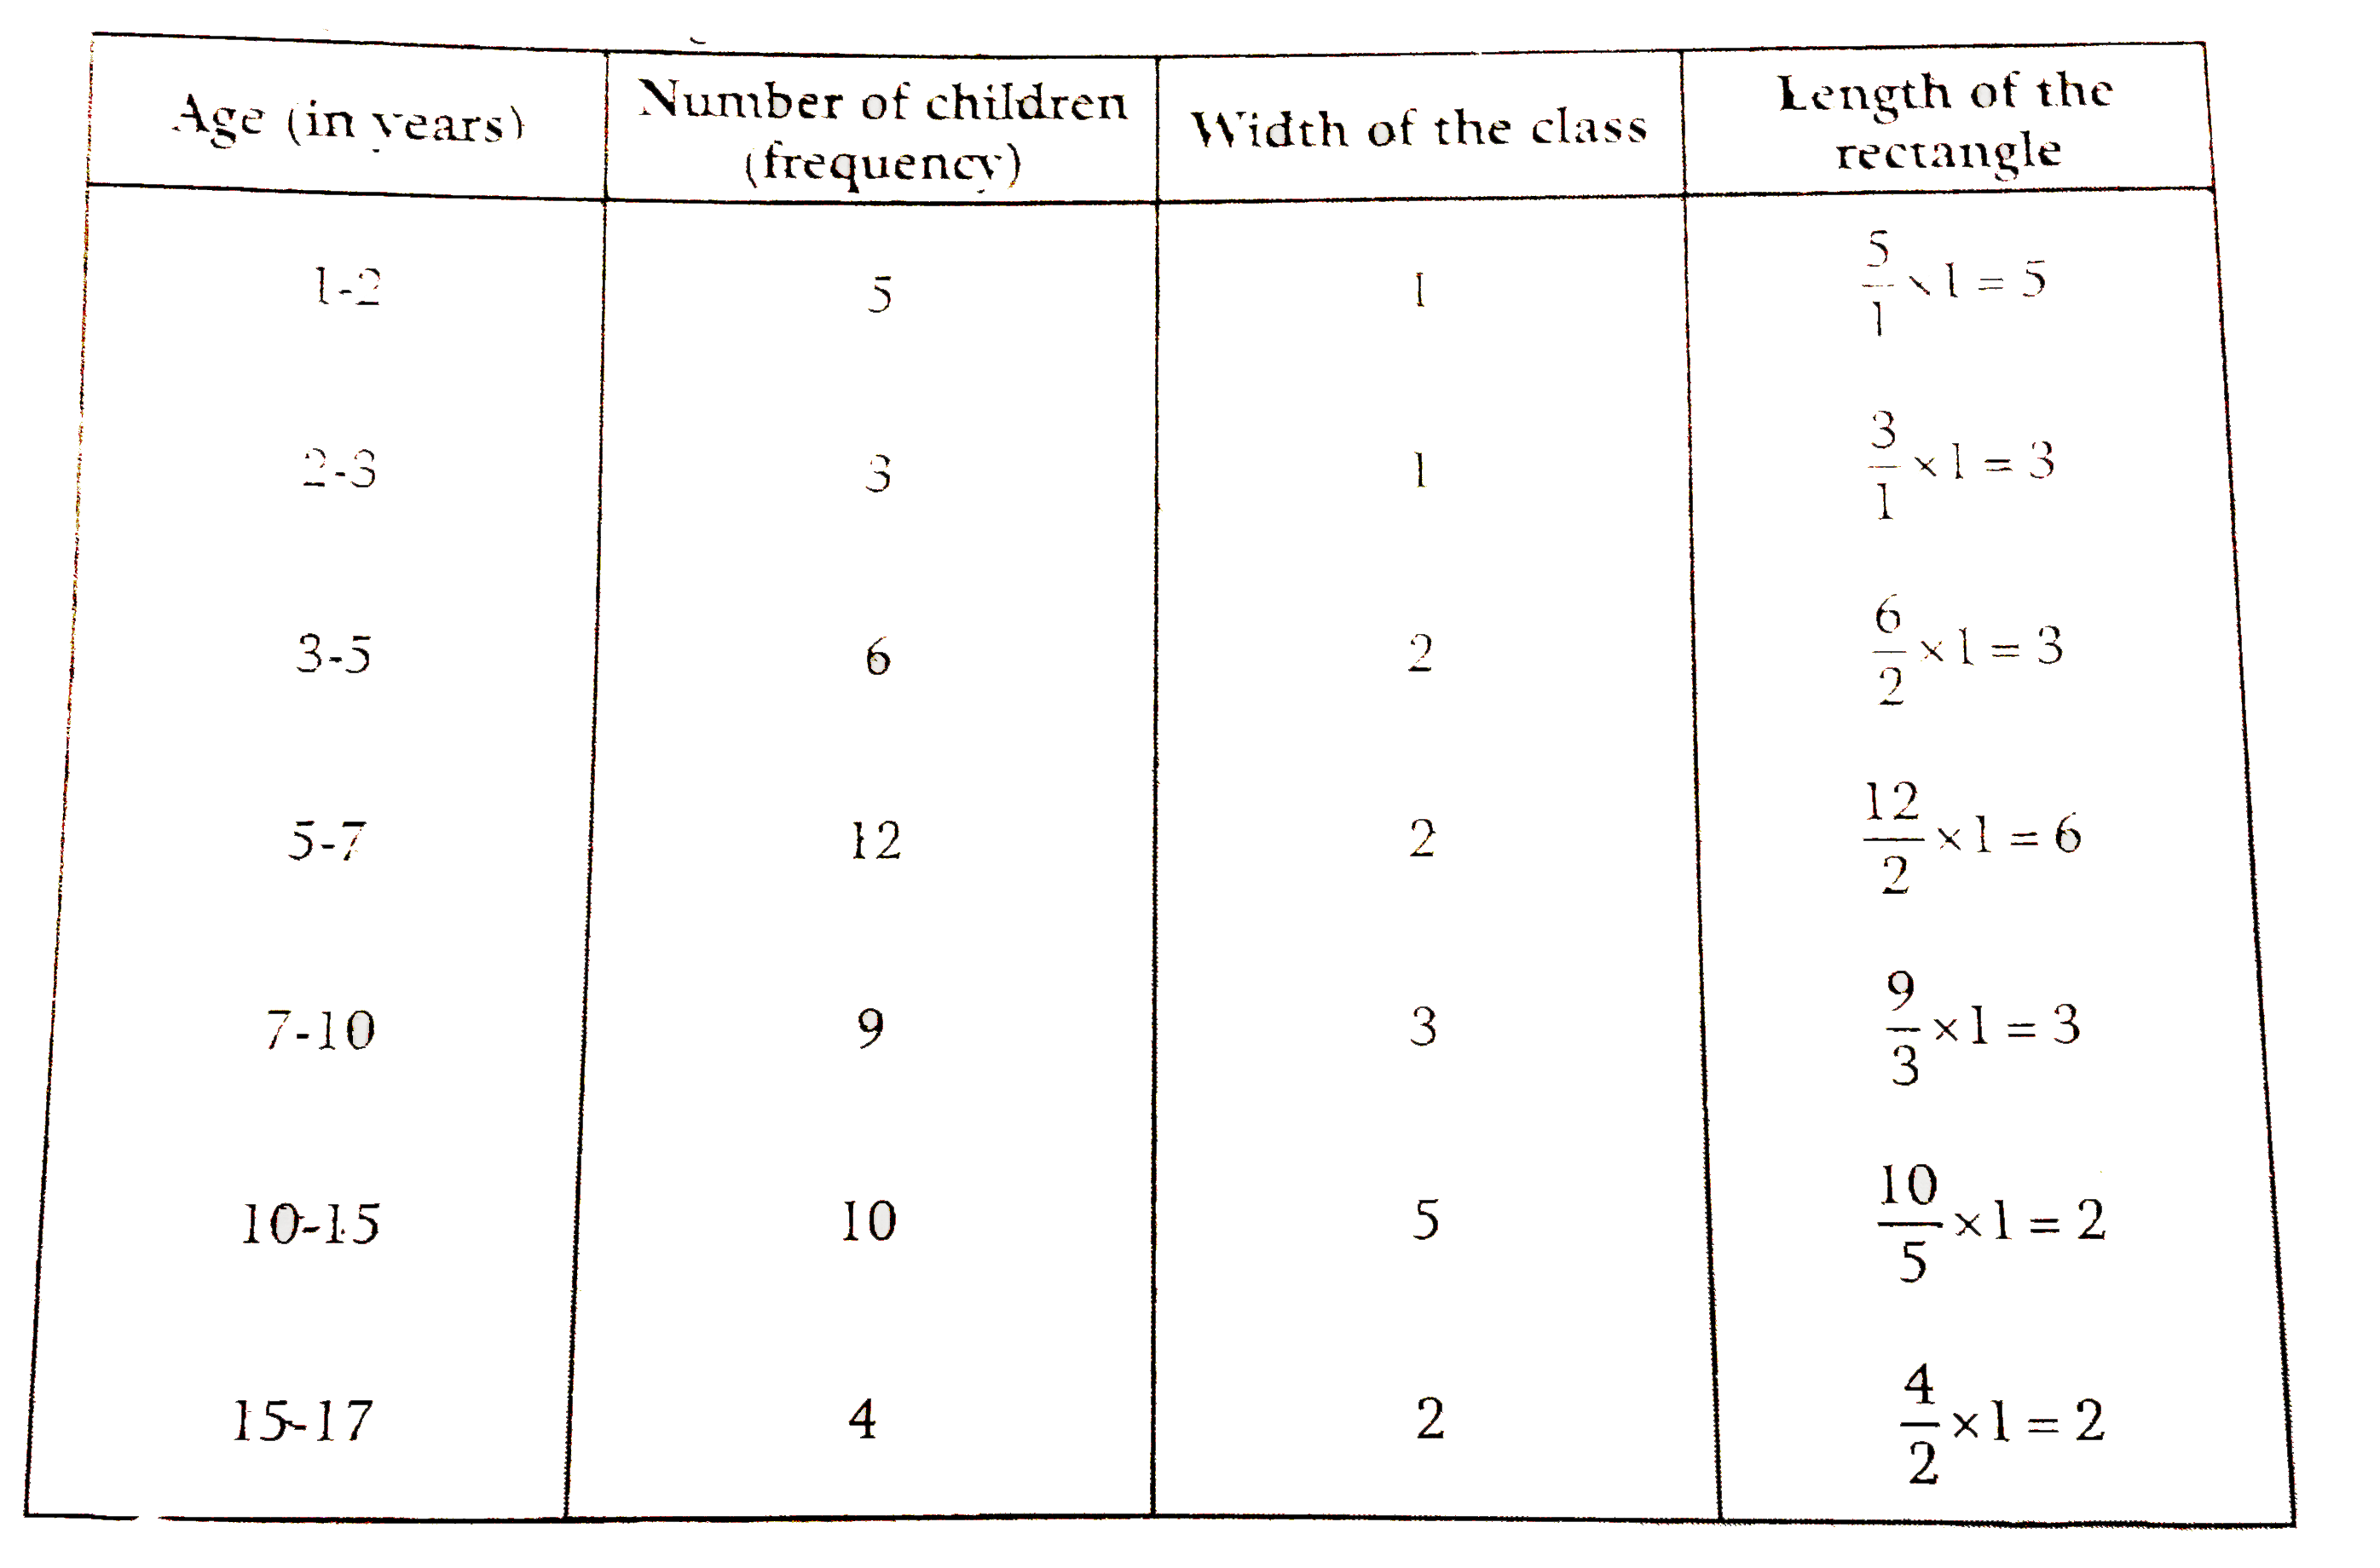
Here, the widths to the rectangles are varying, so we need to make certain modifications in the lengths of the rectangles, so that the areas are again proportional to the frequencies :
1. Select a class interval with the minimum class size. The minium class size is 1.
2. The lengths of the rectangles are then modified to be proportionate to the class size 1.
Now, we get the following table:

So, the correct histogram with varying width is given ahead.

|
Topper's Solved these Questions
- STATISTICSBOOK - NAGEEN PRAKASHANCHAPTER - STATISTICSEXERCISE - Exercise 14a
10 Videos
- STATISTICSBOOK - NAGEEN PRAKASHANCHAPTER - STATISTICSEXERCISE - Exercise 14c
20 Videos
- STATISTICSBOOK - NAGEEN PRAKASHANCHAPTER - STATISTICSEXERCISE - Revision Exercise
10 Videos
- QUADRILATERALSBOOK - NAGEEN PRAKASHANCHAPTER - QUADRILATERALSEXERCISE - Revision Exercise (long Answer Questions)
5 Videos
- SURFACE AREA AND VOLUMEBOOK - NAGEEN PRAKASHANCHAPTER - SURFACE AREA AND VOLUMEEXERCISE - Revision Exercise (long Answer Questions)
10 Videos
Similar Questions
A random survey of the number of children of various age groups playing in a park was found as following Draw a histogram to represent
View SolutionDraw a histogram to represent the following data.

View SolutionDraw a histogram to represent the following

View SolutionDraw a histogram to represent the following:

View SolutionDraw a histogram to represent the following:

View SolutionDraw a histogram to represent the following :

View SolutionDraw the histogram to represent the following data.

View SolutionDraw a histogram of the following data

View SolutionDraw a histogram for the following data :

View SolutionDraw a histogram for the following data.

View Solution
