Between 1985 and 2003, data were collected every three years on the amount of plastic produced annually in the United States, in billions of pounds. The graph below shows the data and a line of best fit. The equation of the line of best fit is y = 3.39x + 46.89, where x is the number of years since 1985 and y is the amount of plastic produced annually, in billions of pounds.
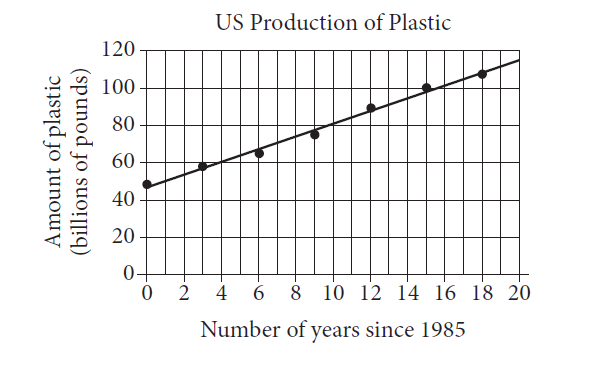
Which of the following is the best interpretation of the number 3.39 in the context of the problem?
The amount of plastic, in billions of pounds, produced in the United States during the year 1985
The number of years it took the United States to produce 1 billion pounds of plastic
The average annual plastic production, in billions of pounds, in the United States from 1985 to 2003
The average annual increase, in billions of pounds, of plastic produced per year in the United States from 1985 to 2003
The correct Answer is:D
The number 3.39 in the equation y = 3.39x + 46.89 is the slope, which is the change in y per unit change in x. Because y represents the amount of plastic produced annually, in billions of pounds, and x represents the number of years since 1985, the number 3.39 represents the rate of change of the amount of plastic produced with respect to time, in units of billions of pounds per year. The change is an increase since 3.39 is positive, and it is described as an average change because the data show increases that are sometimes more and sometimes less than 3.39.
Choice A is incorrect. It is the interpretation of the number 46.89 in the line of best fit equation, y = 3.39x + 46.89. Choices B and C are incorrect because they are expressed in the wrong units. The number 3.39 has units of billions of pounds per year, but choice B has units of years and choice C has units of billions of pounds
Similar Questions
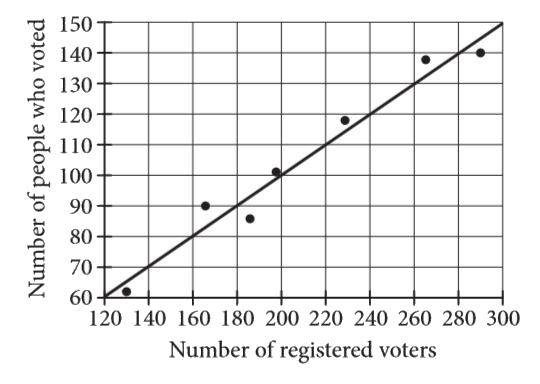
The scatterplot above shows the number of registered voters, x, and the number of people who voted in the last election, y, for seven districts in a town. A line of best fit for the data is also shown. Which of the following could be the equation of the line of best fit?
View Solution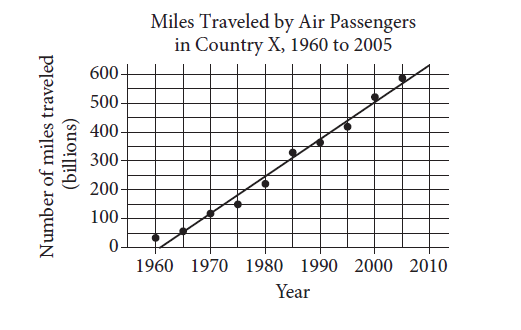
According to the line of best fit in the scatterplot above, which of the following best approximates the year in which the number of miles traveled by air passengers in Country X was estimated to be 550 billion?
View Solution(##KPL_SAT_PRD_PLS_C09_E01_004_Q01.png" width="80%">
The scaterplot abouve shows data collected each year after the British Parlimament enacted a mandatory seat belt law and line of beast fit to the data. Which of the following equations best represents the trend of the data shown in the figure ?
View Solution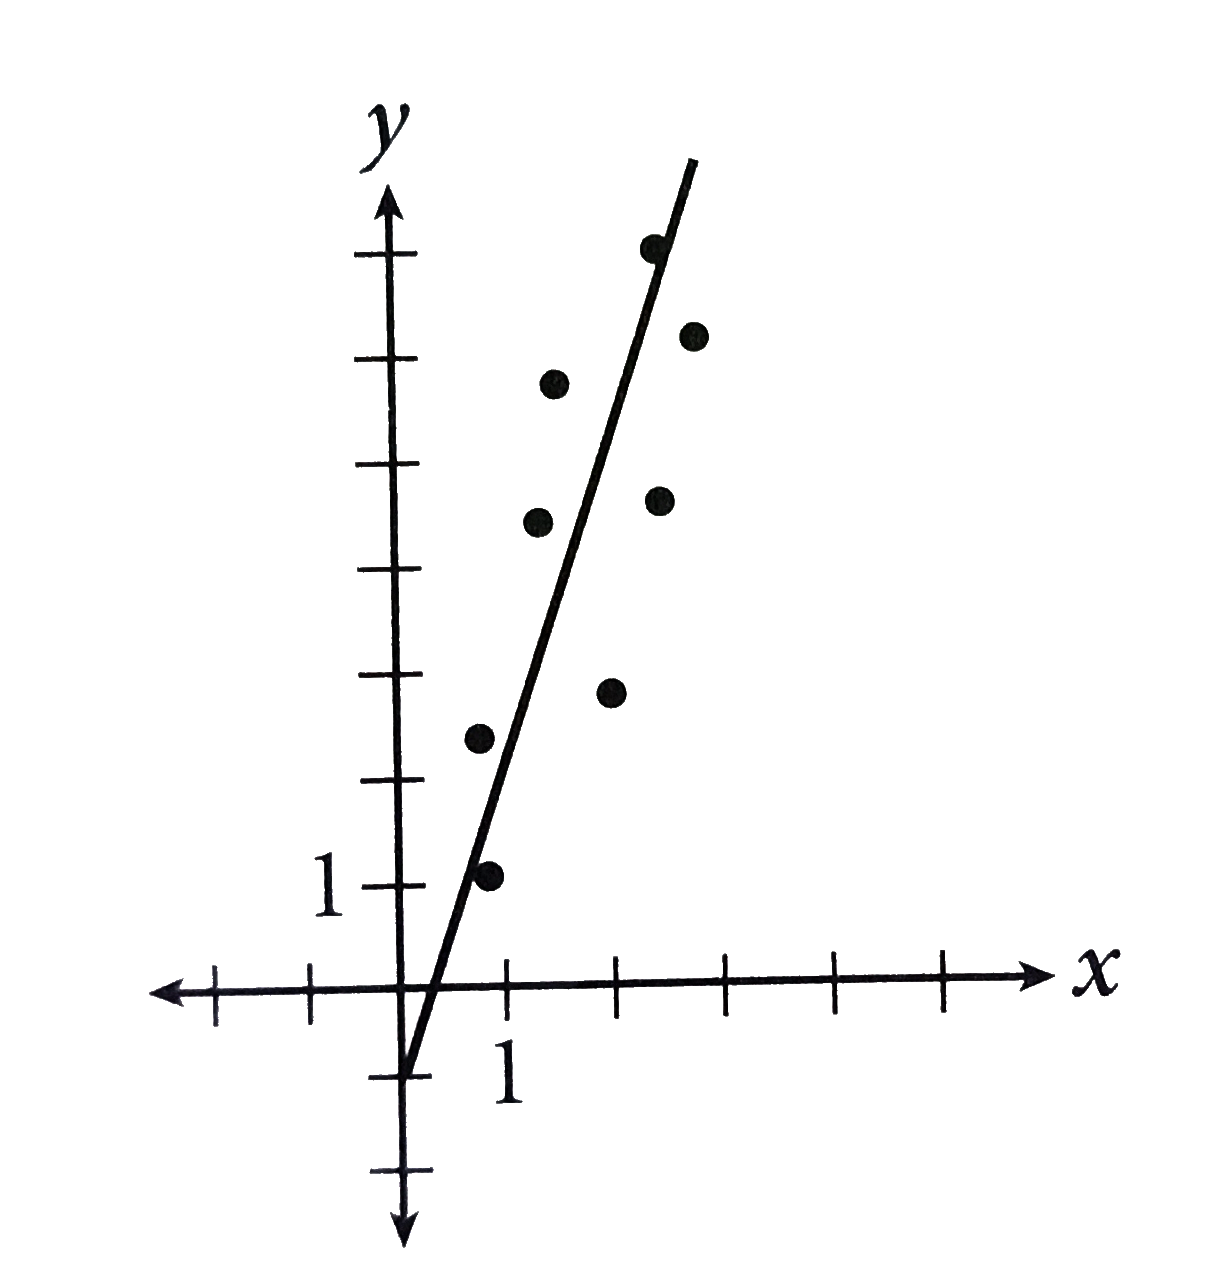
Which of the following equation corresponds to the line of best fit for the data set shown above ?
View SolutionAn environmental agency is working to reduce the amount of plastic that a community discards in the ocean. Currently, the community discards 6.2 milllion pounds of plastic annually, and the agency's goal is to eliminate that amount by collecting and recycling the plastic. If the agency incrases its collection and recycling capacity at a constant rate, and meets its goal at the end of the eight year, which of the following linear functions, f, could the agency use to model the amount of plastic being added to the ocean t years into the program ?
View Solution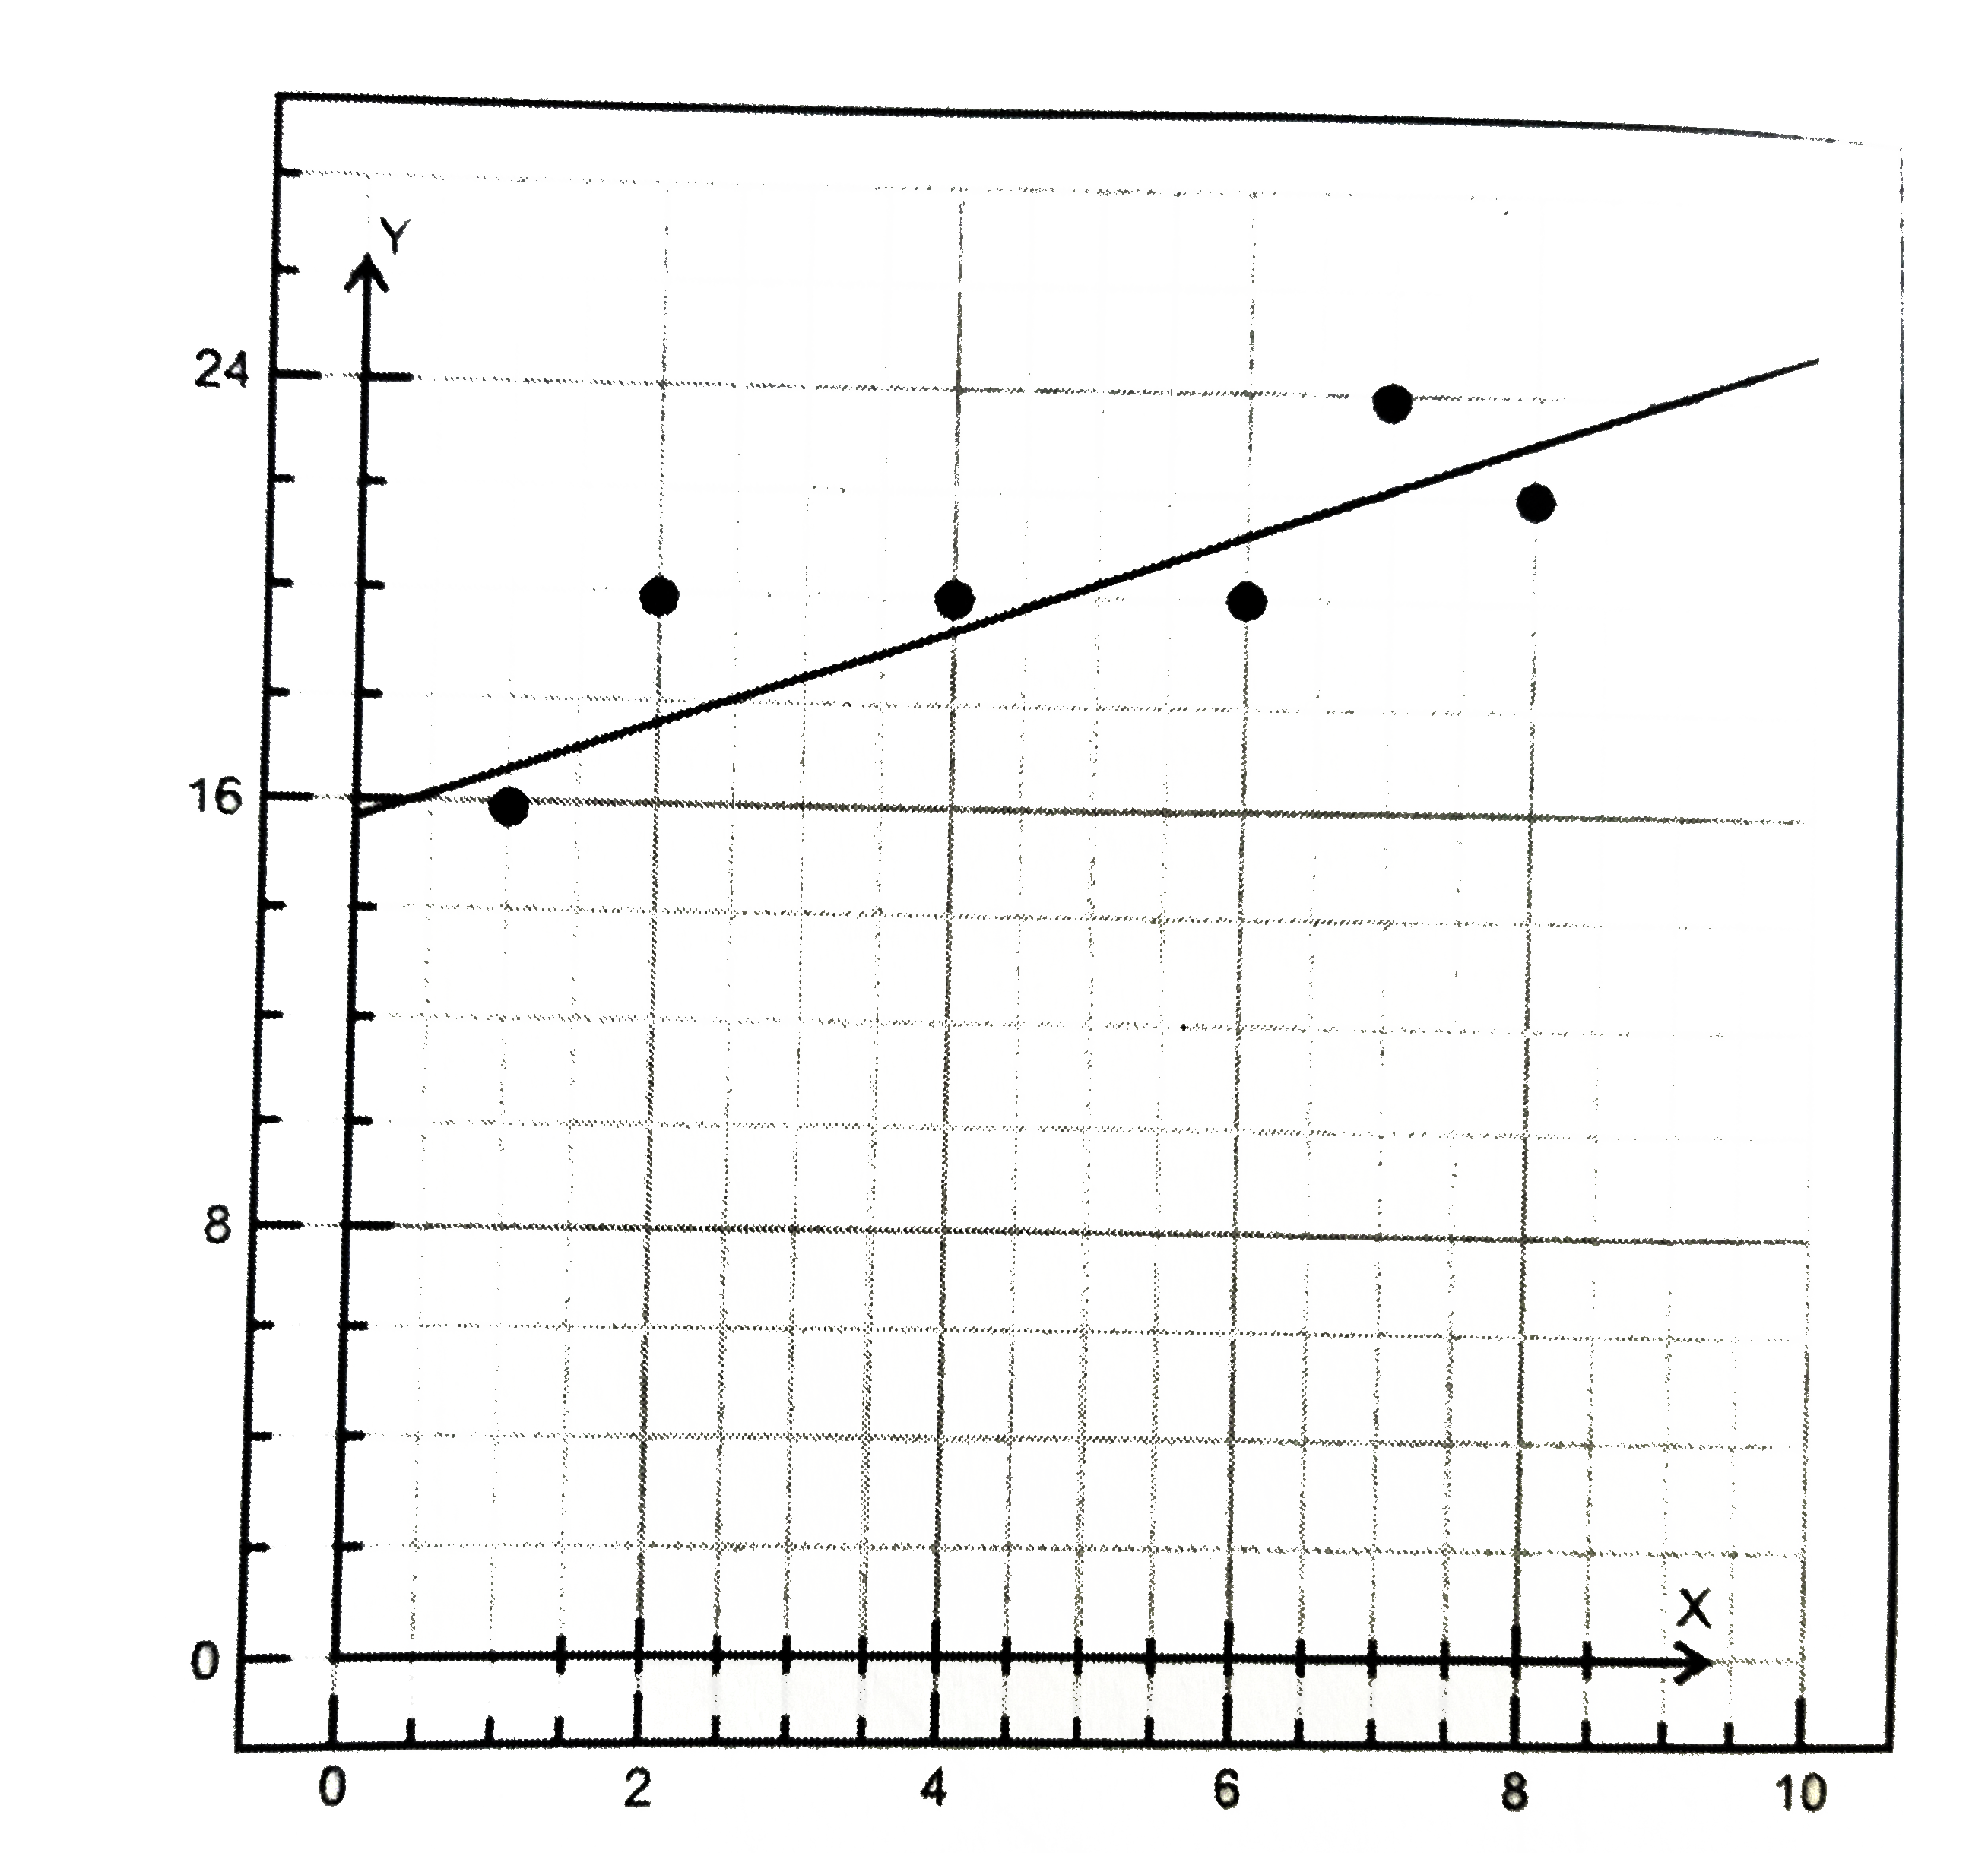
In a experiment a set of points denoted by the (x,y) coordinates are shown in the graph above along with the line of best fit. Which of the following is the best equation for the above line ?
View Solution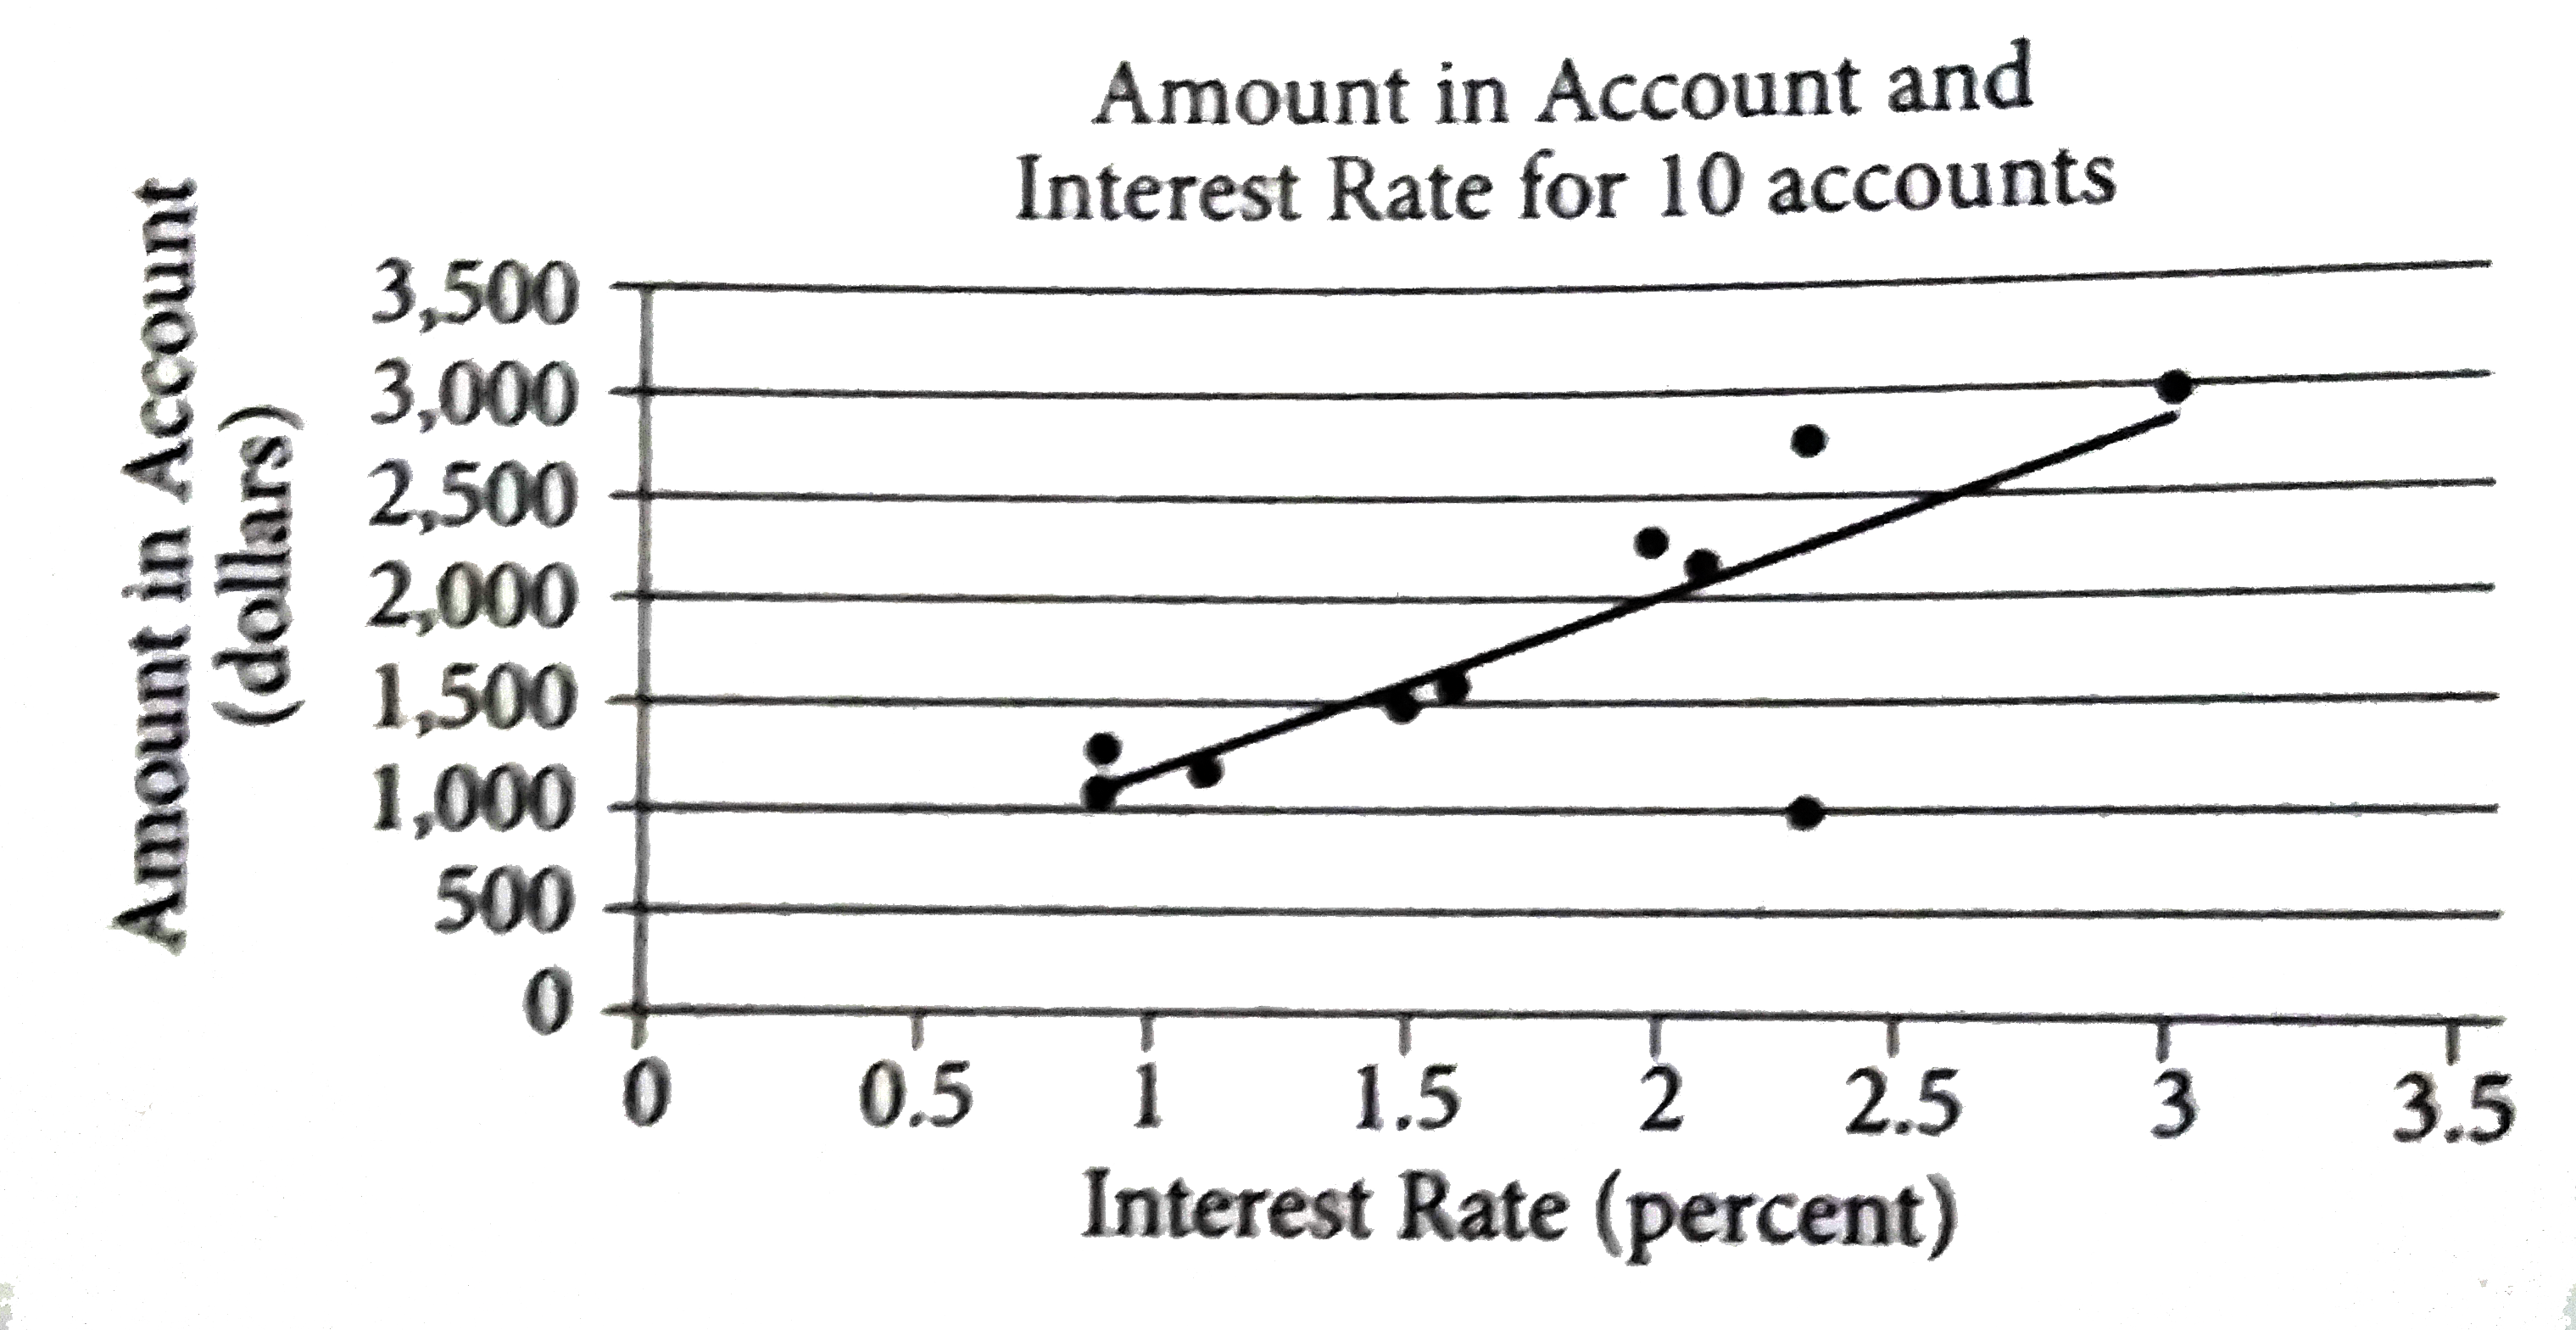
The scatterplot above shows data for ten accounts opened by a company , along with the line of best fit. For the account that contains the least amount of money, which of the following is closest to the difference of the actual amount and the amount predicted by the line of best fit?
View SolutionFit a straight line to the following data treating y as the dependent variable

View Solution
