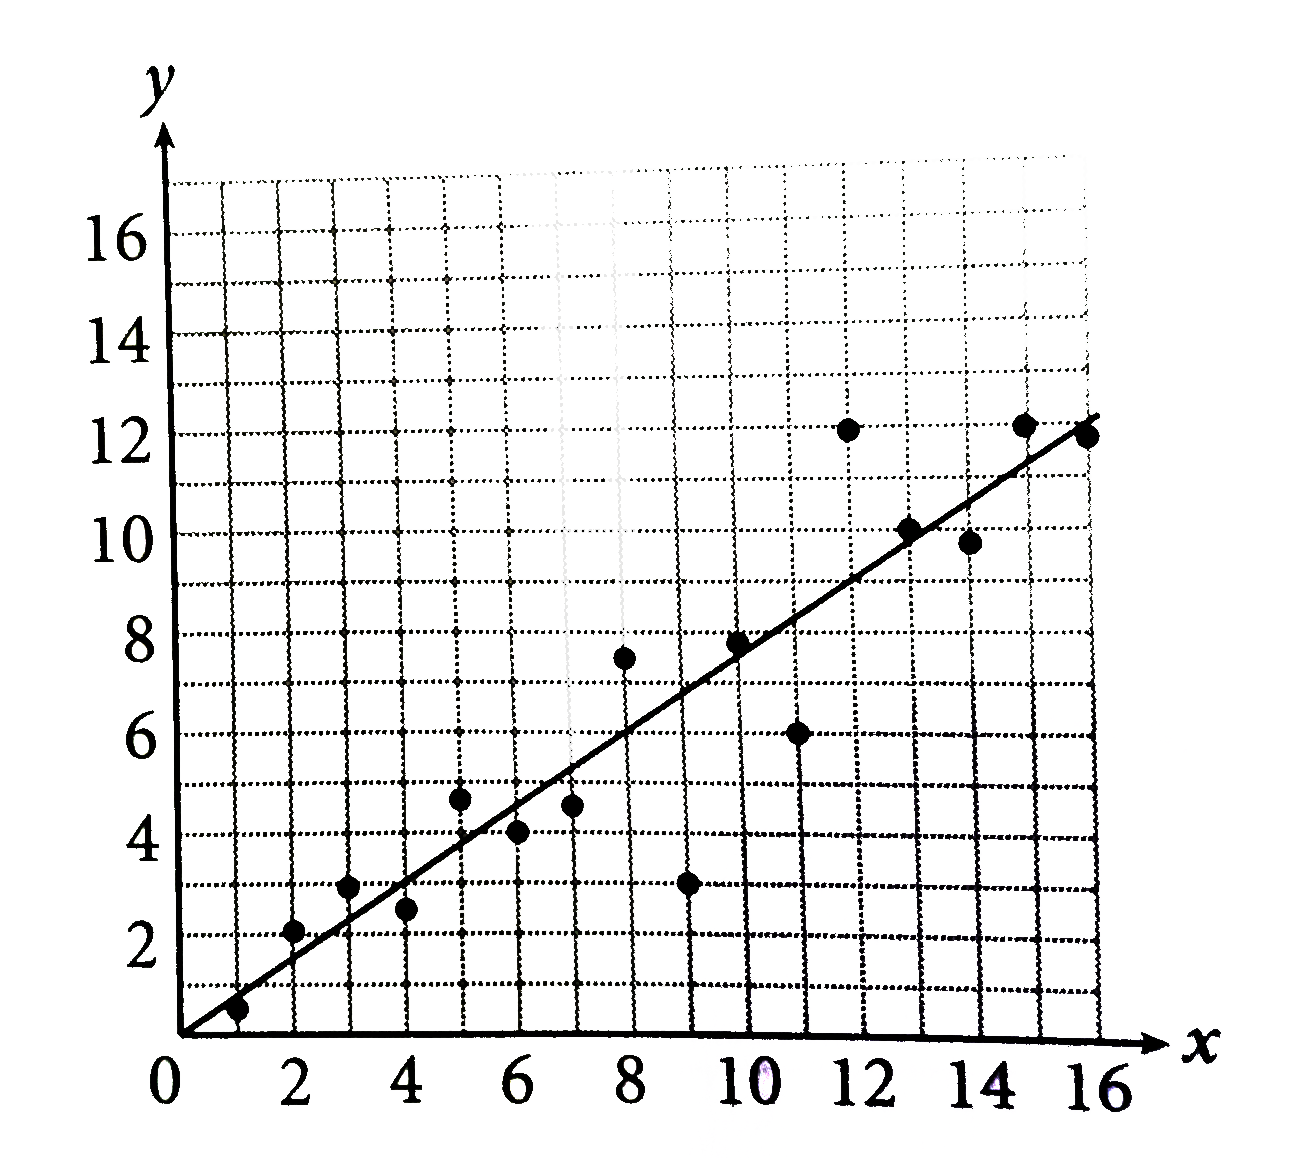
By what percent does the y-coordinate of the data point (12,12) deviate from the y-value predicted by the line of best fit for an x-valued of 12? (Ignore the percent sign and grid your response to the nearest percent.)
Video Solution
Text Solution
The correct Answer is:33
The point (12,12) is 3 full girid lines away from the line of best fit, which goes through (12,9).To find percent difference between the expected and actual y-values, use the percent change formula. Note that the phrasing of the questin indicates that the orginal value of use is 9, the y-value on the line of best fit: 12−99×100%=39×100%=33.3%.
Grid in 33.
|
Topper's Solved these Questions
- SCATTERPLOTSBook:KAPLANChapter:SCATTERPLOTSExercise:LINE OF BEST FIT
Explore 1 Video
- SCATTERPLOTSBook:KAPLANChapter:SCATTERPLOTSExercise:SCATTERPLOT MODELING
Explore 1 Video
- SCATTERPLOTSBook:KAPLANChapter:SCATTERPLOTSExercise:SCATTERPLOT MODELING
Explore 1 Video
- SAT MATH: TIMING ANS SECTION MANAGEMENT STRATEGIESBook:KAPLANChapter:SAT MATH: TIMING ANS SECTION MANAGEMENT STRATEGIESExercise:TRY ON YOU OWN
Explore 5 Videos
- SYSTEMS OF LINEAR EQUATIONSBook:KAPLANChapter:SYSTEMS OF LINEAR EQUATIONSExercise:NUMBER OF POSSIBLE SOLUTIONS
Explore 1 Video
Similar Questions
Knowledge Check
The distance of the point (1,-1) from the line 12(x-6) = 5( y+2) is
A(a) 5 unitsB(b) 25 unitsC(c) 52 unitsD(d) 254 units
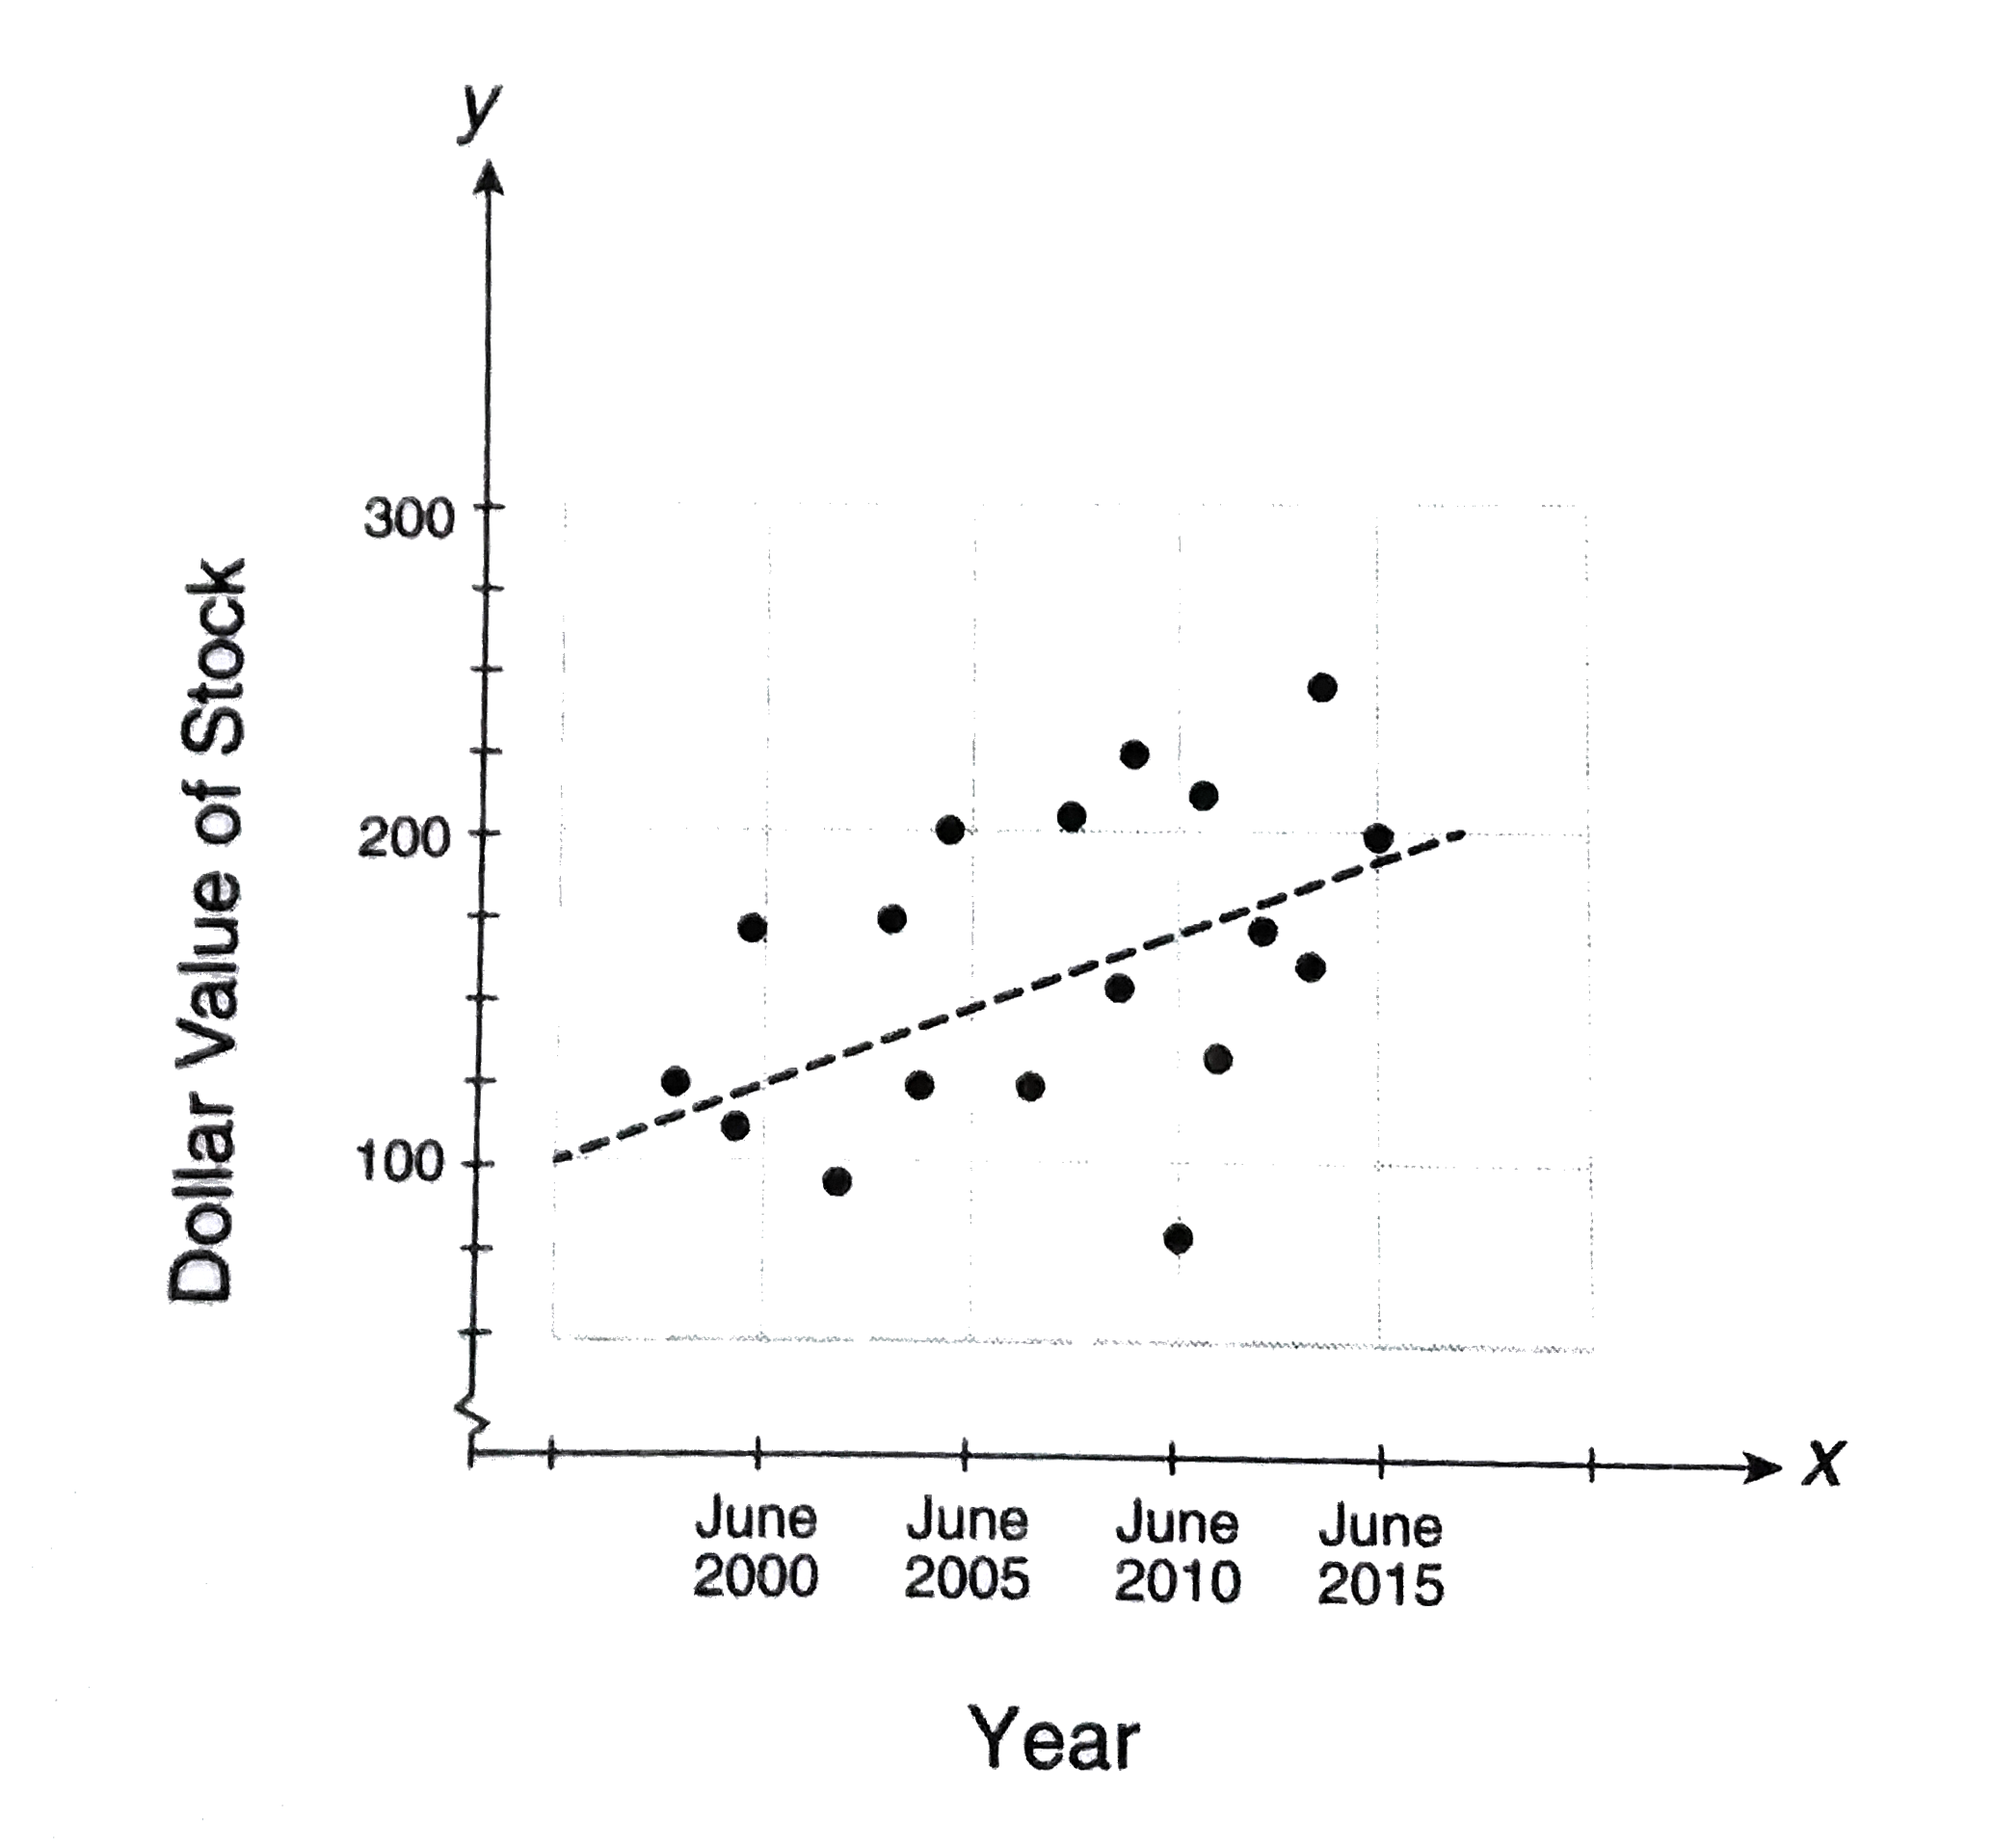
The graph above shows how the value of a stock has increased over time. The line of best fit is shown.
a. The value of the stock increased from June 2000 to Jone 2005 by approcimately what percent?A0.16B0.2C0.25D0.28
The distance of the point (1,2) from the line 2x−3y−4=0 in the direction of the line x+y=1 , is
View SolutionFind the distance of the point (1,1)from the line 12(x+6)=5(y−2).
View SolutionThe co-ordinates of a point on the line y=x where perpendicular distance from the line 3x+4y=12 is 4 units, are :
View SolutionIn the xy-coordinate plane, the graph of y=5x2−12x intersects the grphs of y=−2 at points (0,0) and (a,b). What is the value of a ?
View SolutionThe perpendicular from the origin to the line y=mx+c meets it at the point (−1,2). Find the values of m and c.
View SolutionThe perpendicular from the origin to the line y=mx+c meets it at the point (-1,2). Find the values of m and c.
View Solution