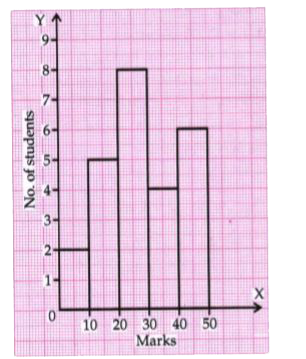
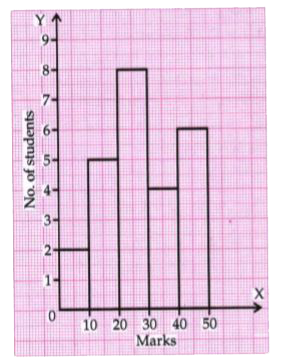
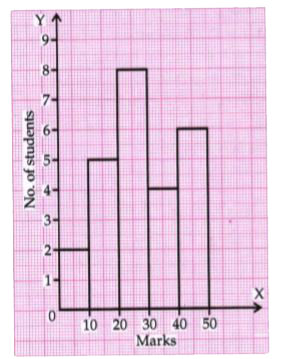
Calculate the mean of the scores of 20 students in a mathematics test

We first, find the class marks xi of each class and then proceed as follows

Therefore, mean¯x=∑fixi∑fi=70020−35
Hence, the mean of scores of 20 students in mathematics test in 35.
Topper's Solved these Questions
- STATISTICS AND PROBABILITYBOOK - NCERT EXEMPLAR ENGLISHCHAPTER - STATISTICS AND PROBABILITYEXERCISE - LONG ASWERS QUESTIONS
14 Videos
- STATISTICS AND PROBABILITYBOOK - NCERT EXEMPLAR ENGLISHCHAPTER - STATISTICS AND PROBABILITYEXERCISE - VERY SHORT ANSWERS QUESTIONS
14 Videos
- REAL NUMBERSBOOK - NCERT EXEMPLAR ENGLISHCHAPTER - REAL NUMBERSEXERCISE - LONG ANSWER TYPE QUESTIONS
5 Videos
- SURFACE AREAS AND VOLUMESBOOK - NCERT EXEMPLAR ENGLISHCHAPTER - SURFACE AREAS AND VOLUMESEXERCISE - LONG ANSWER TYPE QUESTIONS
20 Videos
Similar Questions
The number of students in section X A and X B are 30 and 35 respectively. The mean scores of students in the mathematices test are as follows:

View SolutionA teacher wanted to analysis the performance of two sections of students in a mathematics test of 100 marks. Looking performance, she found that a few students got under 20 marks and a few got 70 marks or above. So she decided to group them into intervals of varying sizes as follows :
0-20, 20-30, ....., 60-70, 70-100. Then she formed the following table :
∣∣ ∣ ∣ ∣ ∣ ∣ ∣ ∣ ∣ ∣ ∣ ∣∣Marks Number of students0−20 720−30 1030−40 1040−50 2050−60 2060−70 1570−above 8Total 90∣∣ ∣ ∣ ∣ ∣ ∣ ∣ ∣ ∣ ∣ ∣ ∣∣
(i) Find the probability that a student obtained less than 20% in the mathematics test.
(ii) Find the probability that a student obtained marks 60 or above .
View SolutionA teacher wanted to analysis the performance of two sections of students in a mathematics test of 100 marks. Looking performance, she found that a few students got under 20 marks and a few got 70 marks or above. So she decided to group them into intervals of varying sizes as follows :(i) Find the probability that a student obtained less than 20% in the mathematics test.
(ii) Find the probability that a student obtained marks 60 or above .
0-20, 20-30, ....., 60-70, 70-100. Then she formed the following table :
∣∣ ∣ ∣ ∣ ∣ ∣ ∣ ∣ ∣ ∣ ∣ ∣∣Marks Number of students0−20 720−30 1030−40 1040−50 2050−60 2060−70 1570−above 8Total 90∣∣ ∣ ∣ ∣ ∣ ∣ ∣ ∣ ∣ ∣ ∣ ∣∣
View SolutionFollowing table shows the marks scored by a group of 90 students in a mathematics test of 100 marks. Marks 0-20 20-30 30-40 40-50 50-60 60-70 70-100 No. of Students: 7 10 10 20 20 15 8 Find the probability that marks scored by a student in the class is: at most 60 marks (ii) at least 60 marks (iii)not more than 50 marks
View SolutionThe historgam below represents the scores obtained by 25 students in a Mathematics mental test. Use the data to :
(ii) to calculate mean.

View SolutionThe histogram below represents the scores obtained by 25 students in a Mathematics mental test. Use the data to,
(i) Frame a frequency distribution table
(ii) To calculate mean
View SolutionThe historgam below represents the scores obtained by 25 students in a Mathematics mental test. Use the data to :
(iii) To determine the Modal class.

View SolutionFollowing are the marks obtained by 9 student in a mathematics test
50,69,20,33,53,39,40,65,59,
The mean deviation from the median is
View SolutionThe historgam below represents the scores obtained by 25 students in a Mathematics mental test. Use the data to :
(i) Frame a frequency distribution table.

View SolutionIn Class XI of a certain school, there are 30 students in a Mathematics class and 20 students in Biolog class. Find the number of students which are in Mathematics class or in Biology class in the following cases:
(i) Two classes are conducted at the same time.
(ii) Two classes are condcuted at different time and 5 students study both the subject
View Solution
