Draw the graph of f(x)=sgn(x3−x). Solution in Tamil
We need to first find the intervals where x3−x>0andx3−x<0.
Now x3−x=x(x−1)(x+1)
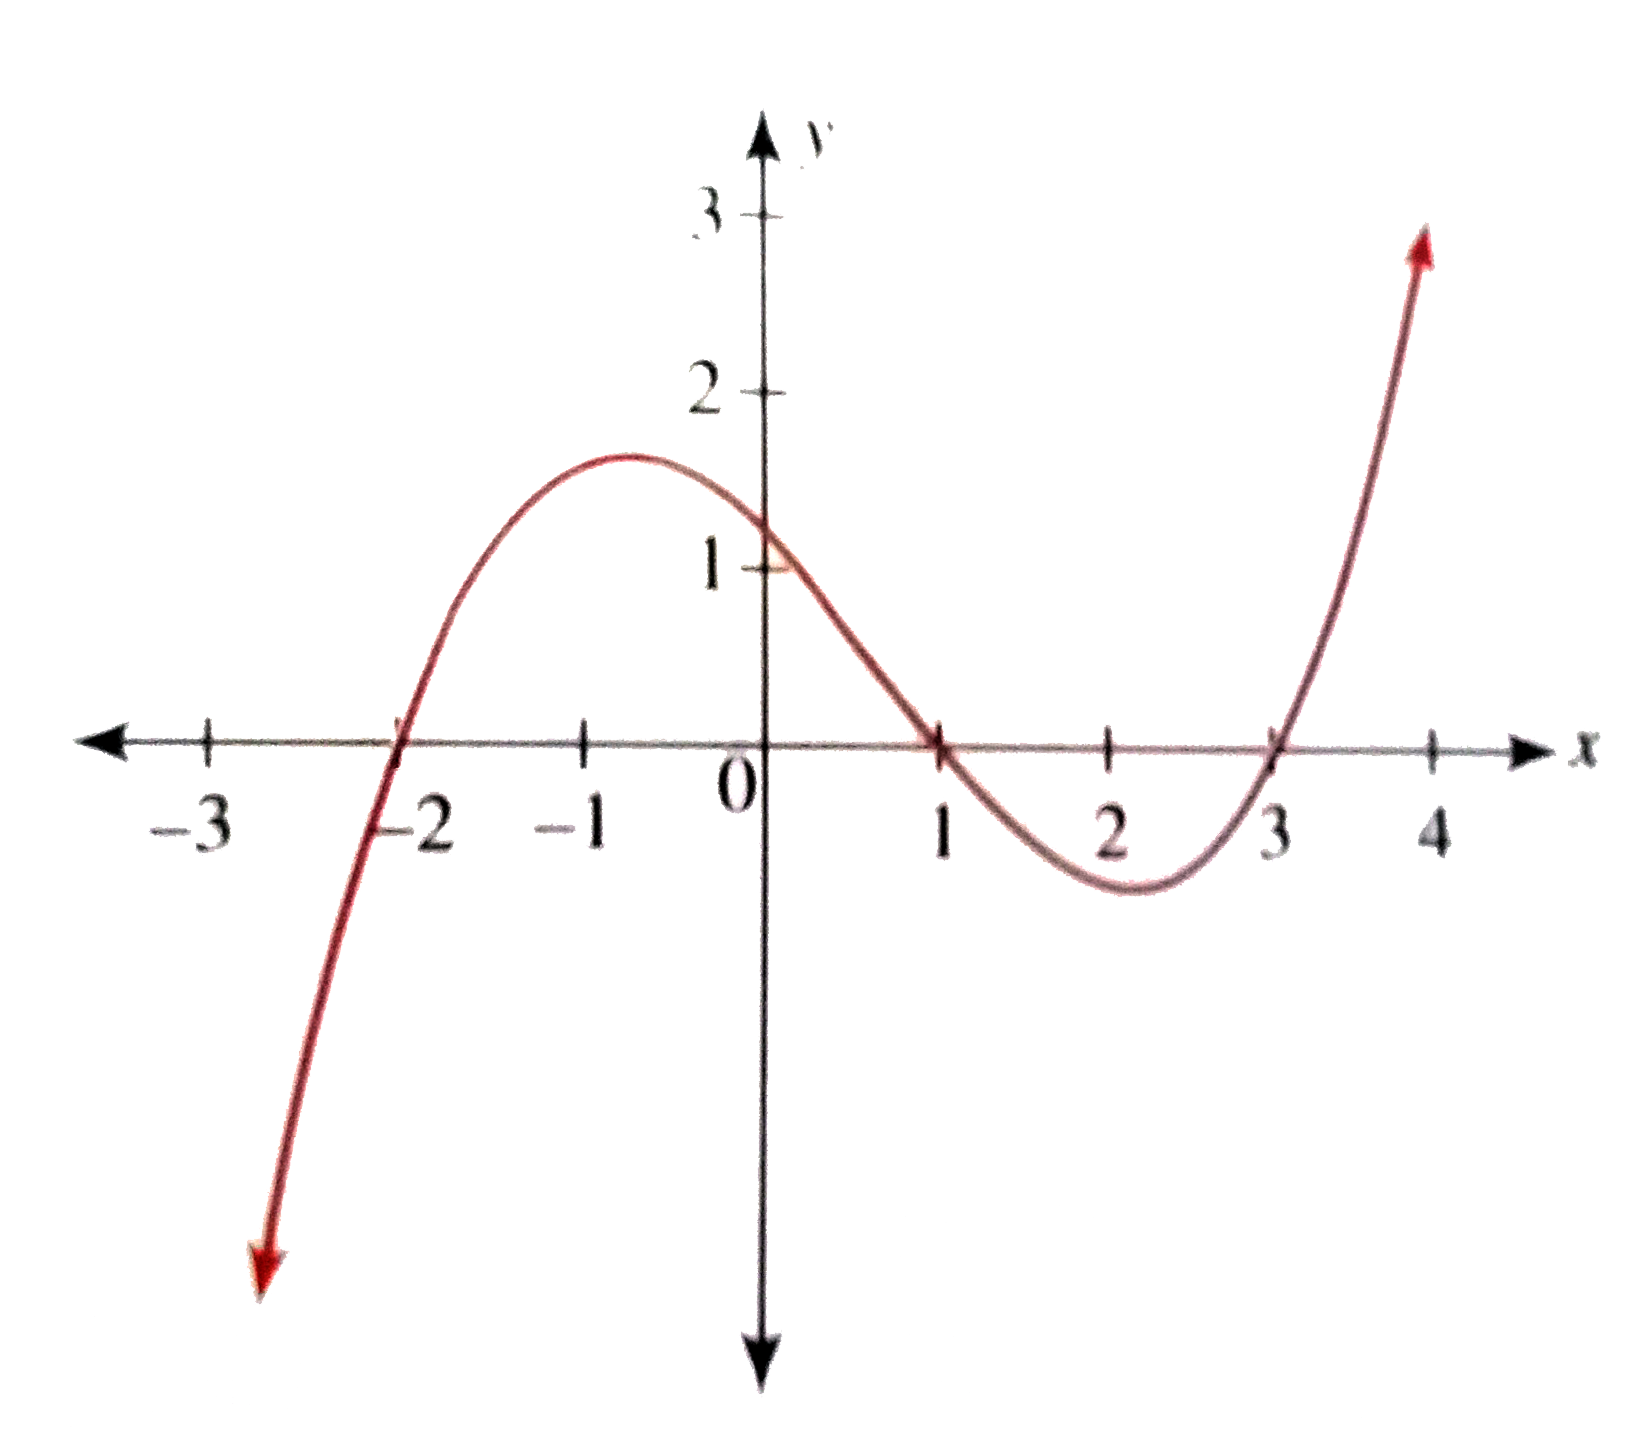
The sign scheme of x3−x is as shown in the following figure.

From the above sign scheme,
y=f(x)=sgn(x3−x)
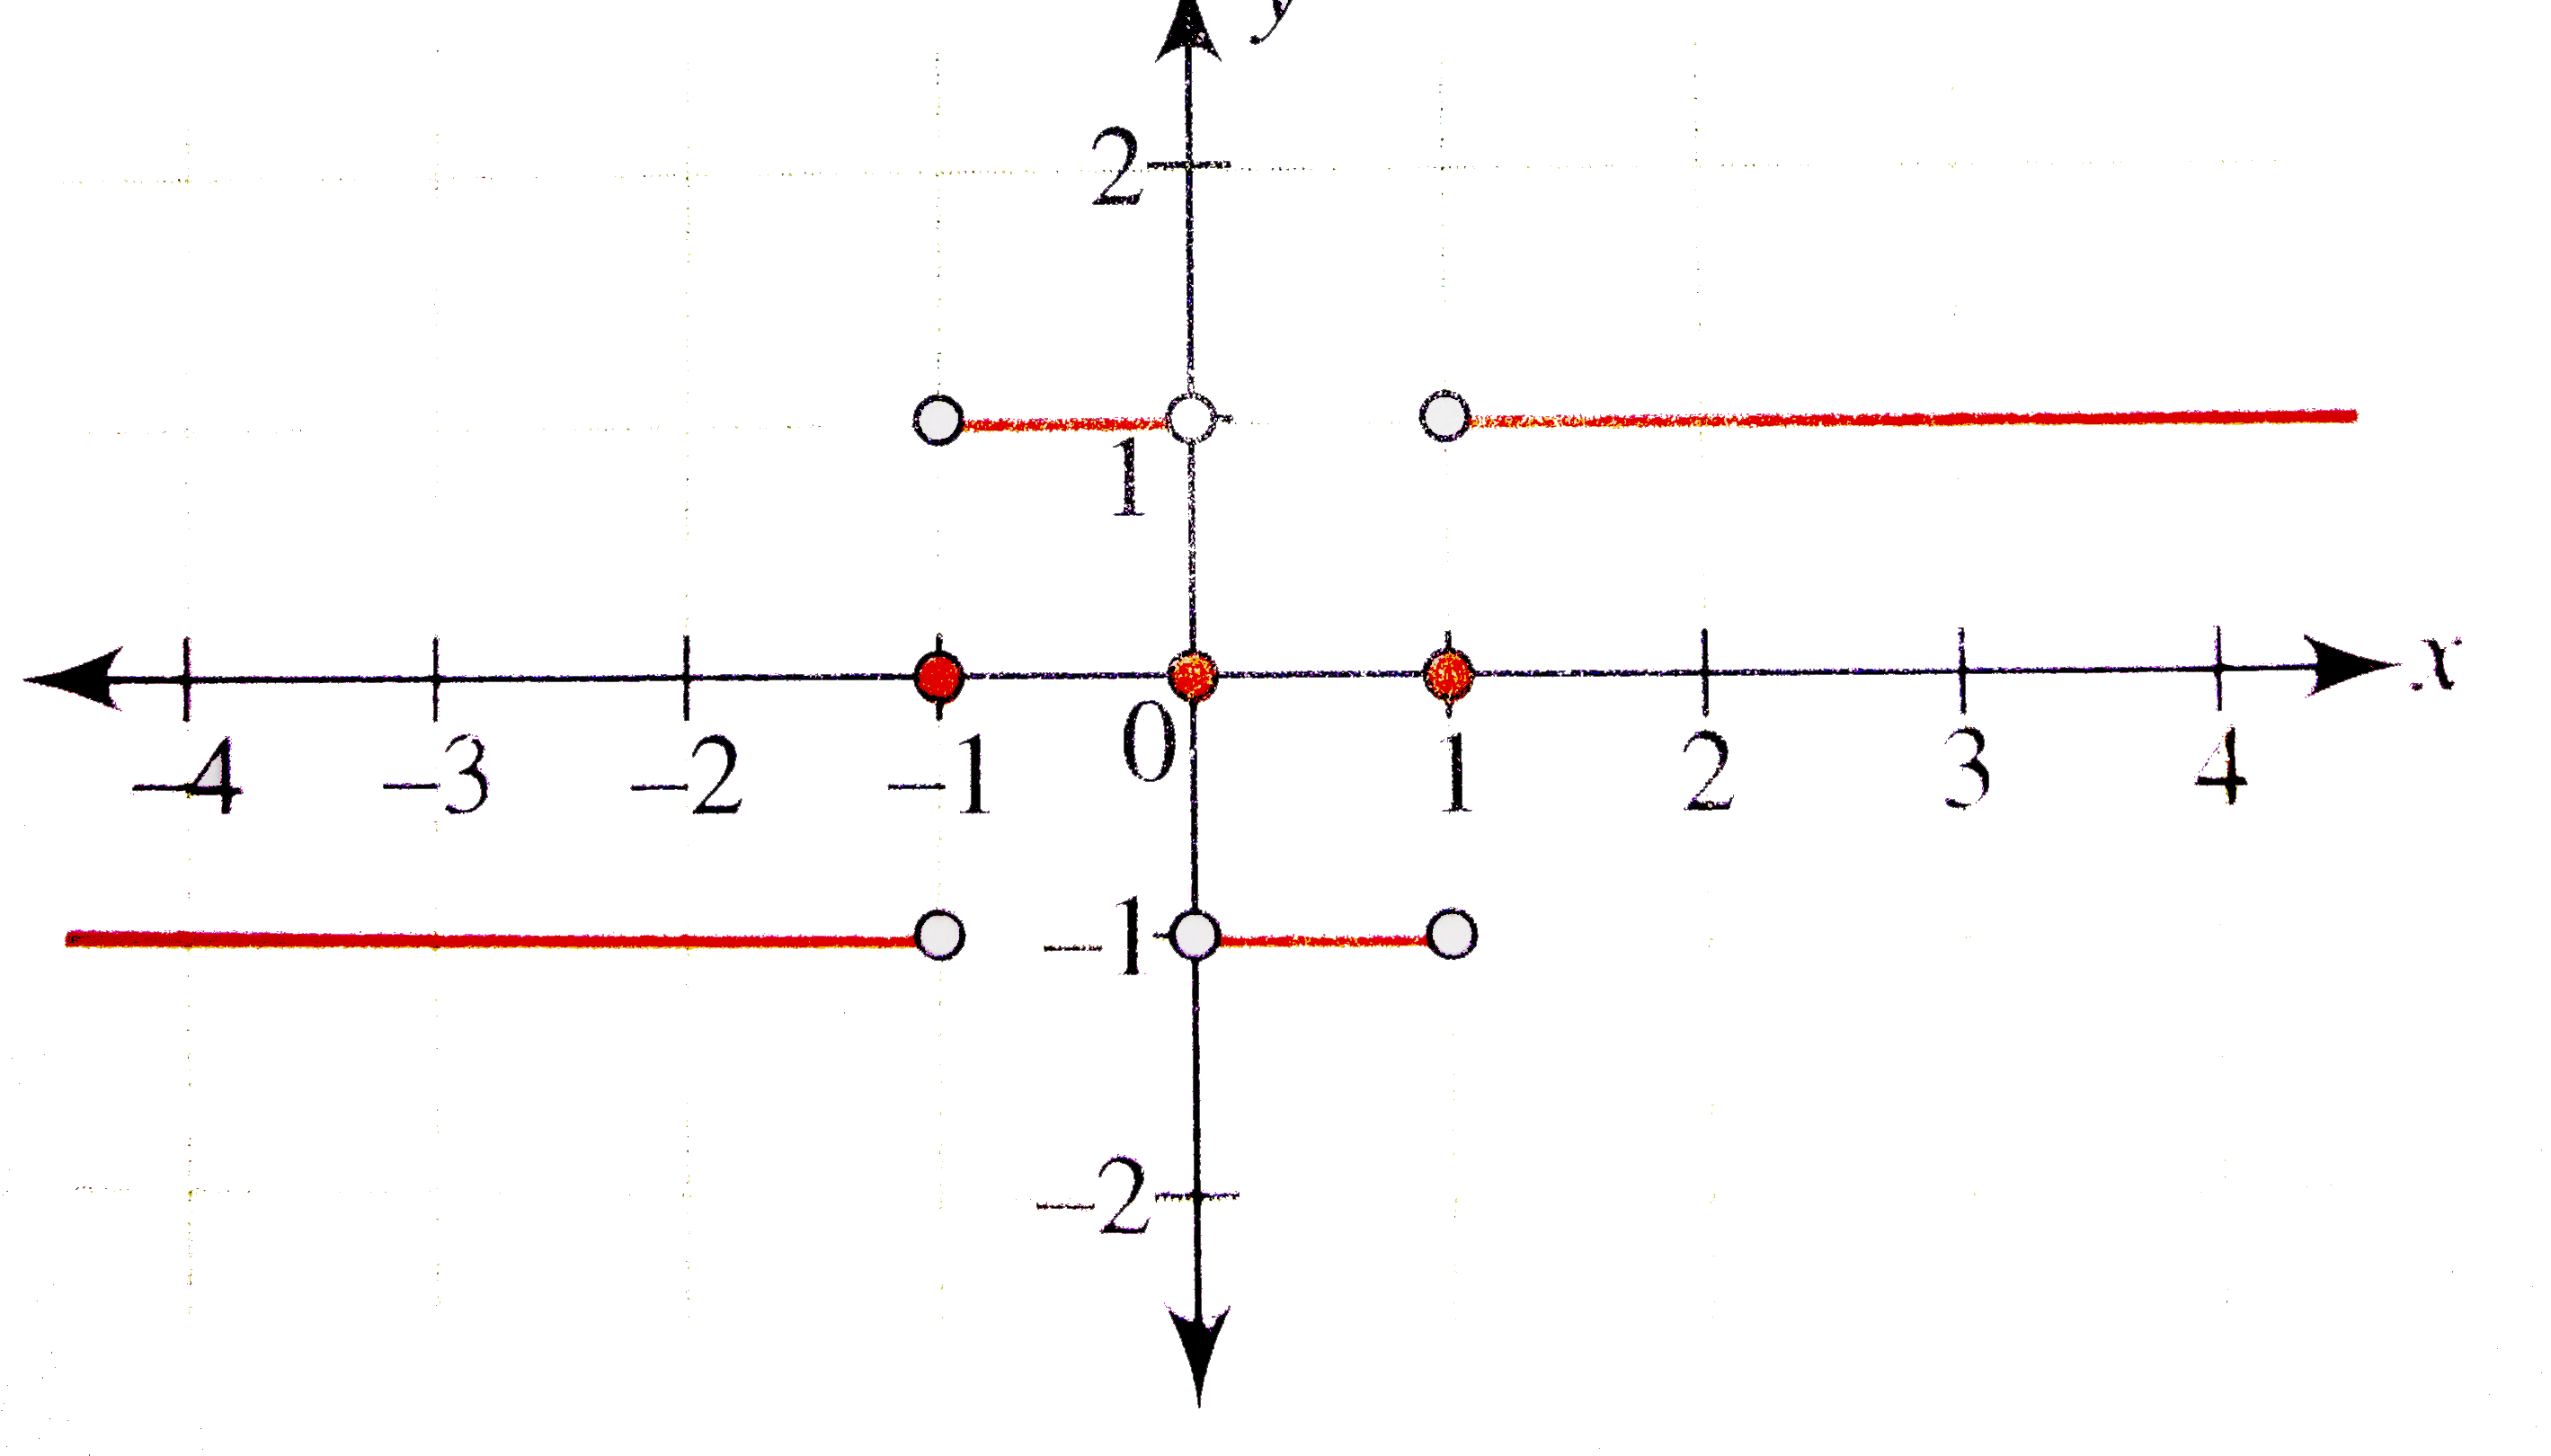
=⎧⎪⎨⎪⎩1,x∈(−1,0)∪(1,∞)−1,x∈(−∞,−1)∪(0,1)0,x=0,±1
Hence the graph of f(x)=sgn(x3−x) is as shown in the following figure.
Topper's Solved these Questions
- GRAPHS OF ELEMENTARY FUNCTIONS BOOK - CENGAGECHAPTER - GRAPHS OF ELEMENTARY FUNCTIONS EXERCISE - Exercise
34 Videos
- GRAPHS OF POLYNOMIAL AND RATIONAL FUNCTIONSBOOK - CENGAGECHAPTER - GRAPHS OF POLYNOMIAL AND RATIONAL FUNCTIONSEXERCISE - Exercises
4 Videos
- GRAPHS OF TRIGONOMETRIC FUNCTIONSBOOK - CENGAGECHAPTER - GRAPHS OF TRIGONOMETRIC FUNCTIONSEXERCISE - Exercise
22 Videos
Similar Questions
Draw the graph of y=1(1/x).
View SolutionSketch the graph of an example of a rational function f that satisfies all the given conditions.
(i) f(0)=0,f(1),limx→∞f(x)=0,f is odd
(ii) limx→0+f(x)=∞,limx→0−f(x)=−∞,limx→∞f(x)=1,limx→−∞f(x)=1
(iii) limx→−2f(x)=∞,limx→−∞f(x)=3,limx→∞f(x)=3,f(0)=0
View SolutionDraw the graph of y= cosec 2x−cot2x. Is f(x) periodic ? If yes, what is its fundamental period ?
View SolutionThe graph of the function y=f(x) is as shown in the figure.

Then draw the graphs of
(i) |y|=sgn(f(x)) (ii) |y|=|f(x∣)|
(iii) y=xsgn(f(x))
View SolutionDraw the graph of f(x)=sgn(x3−x).
View SolutionDraw the graph of f(x)=sgn(logex).
View SolutionDraw the graph of f(x)=sgn(log0.5x).
View SolutionFor the following functions write the piecewise definition and draw the graph
(i) f(x)= sgn (logex) (ii) f(x)= sgn (sinx)
View SolutionWrite the equivalent definition and draw the graphs of the following functions.
(a) f(x)=sgn(loge|x|)
(b) f(x)=sgn(x3−x)
View SolutionDraw the graph of f(x)=sgn(x−2).
View SolutionThe graph of the function y=f(x) is as shown in the figure.

Then draw the graphs of
(i) |y|=sgn(f(x)) (ii) |y|=|f(x∣)|
(iii) y=xsgn(f(x))
View SolutionDraw the graph of f(x)=sgn(x3−x).
View SolutionDraw the graph of f(x)=sgn(logex).
View SolutionDraw the graph of f(x)=sgn(log0.5x).
View SolutionFor the following functions write the piecewise definition and draw the graph
(i) f(x)= sgn (logex) (ii) f(x)= sgn (sinx)
View Solution
