Draw the graph of the relation y2=x2(1−x)Solution in Bengali
We have y2(x−1)=x2(1+x)
or y=±x√x+1x−1
Let us first draw the graph of y=f(x)=x√x+1x−1
Clearly,the domain of the function is (−∞,−1)∪(1,∞)
f(x)=0∴x=0,1
So the graph meets the x-axis at (0,0) and (−1,0).
Also, f(x)≥0 for x≥1 and f(x)<0 for x<−1
f′(x)=1.√x+1x−1+xx−1−(x+1)(x−1)22√x+1x−1
=x2−x−1(x−1)2√x+1x−1
=(x−11−√52)(x−1+√52)(x−1)2√x+1x−1
f′(x)=0∴x=1+√52, which is the point of minima.
x=1−√52 is not a critical point as −1<1−√52<1
f(x) decreases for (−∞,−1)∪(1,1+√52)
f(x) increases for 1+√52,∞
Also xx→1+√x+1x−1=∞
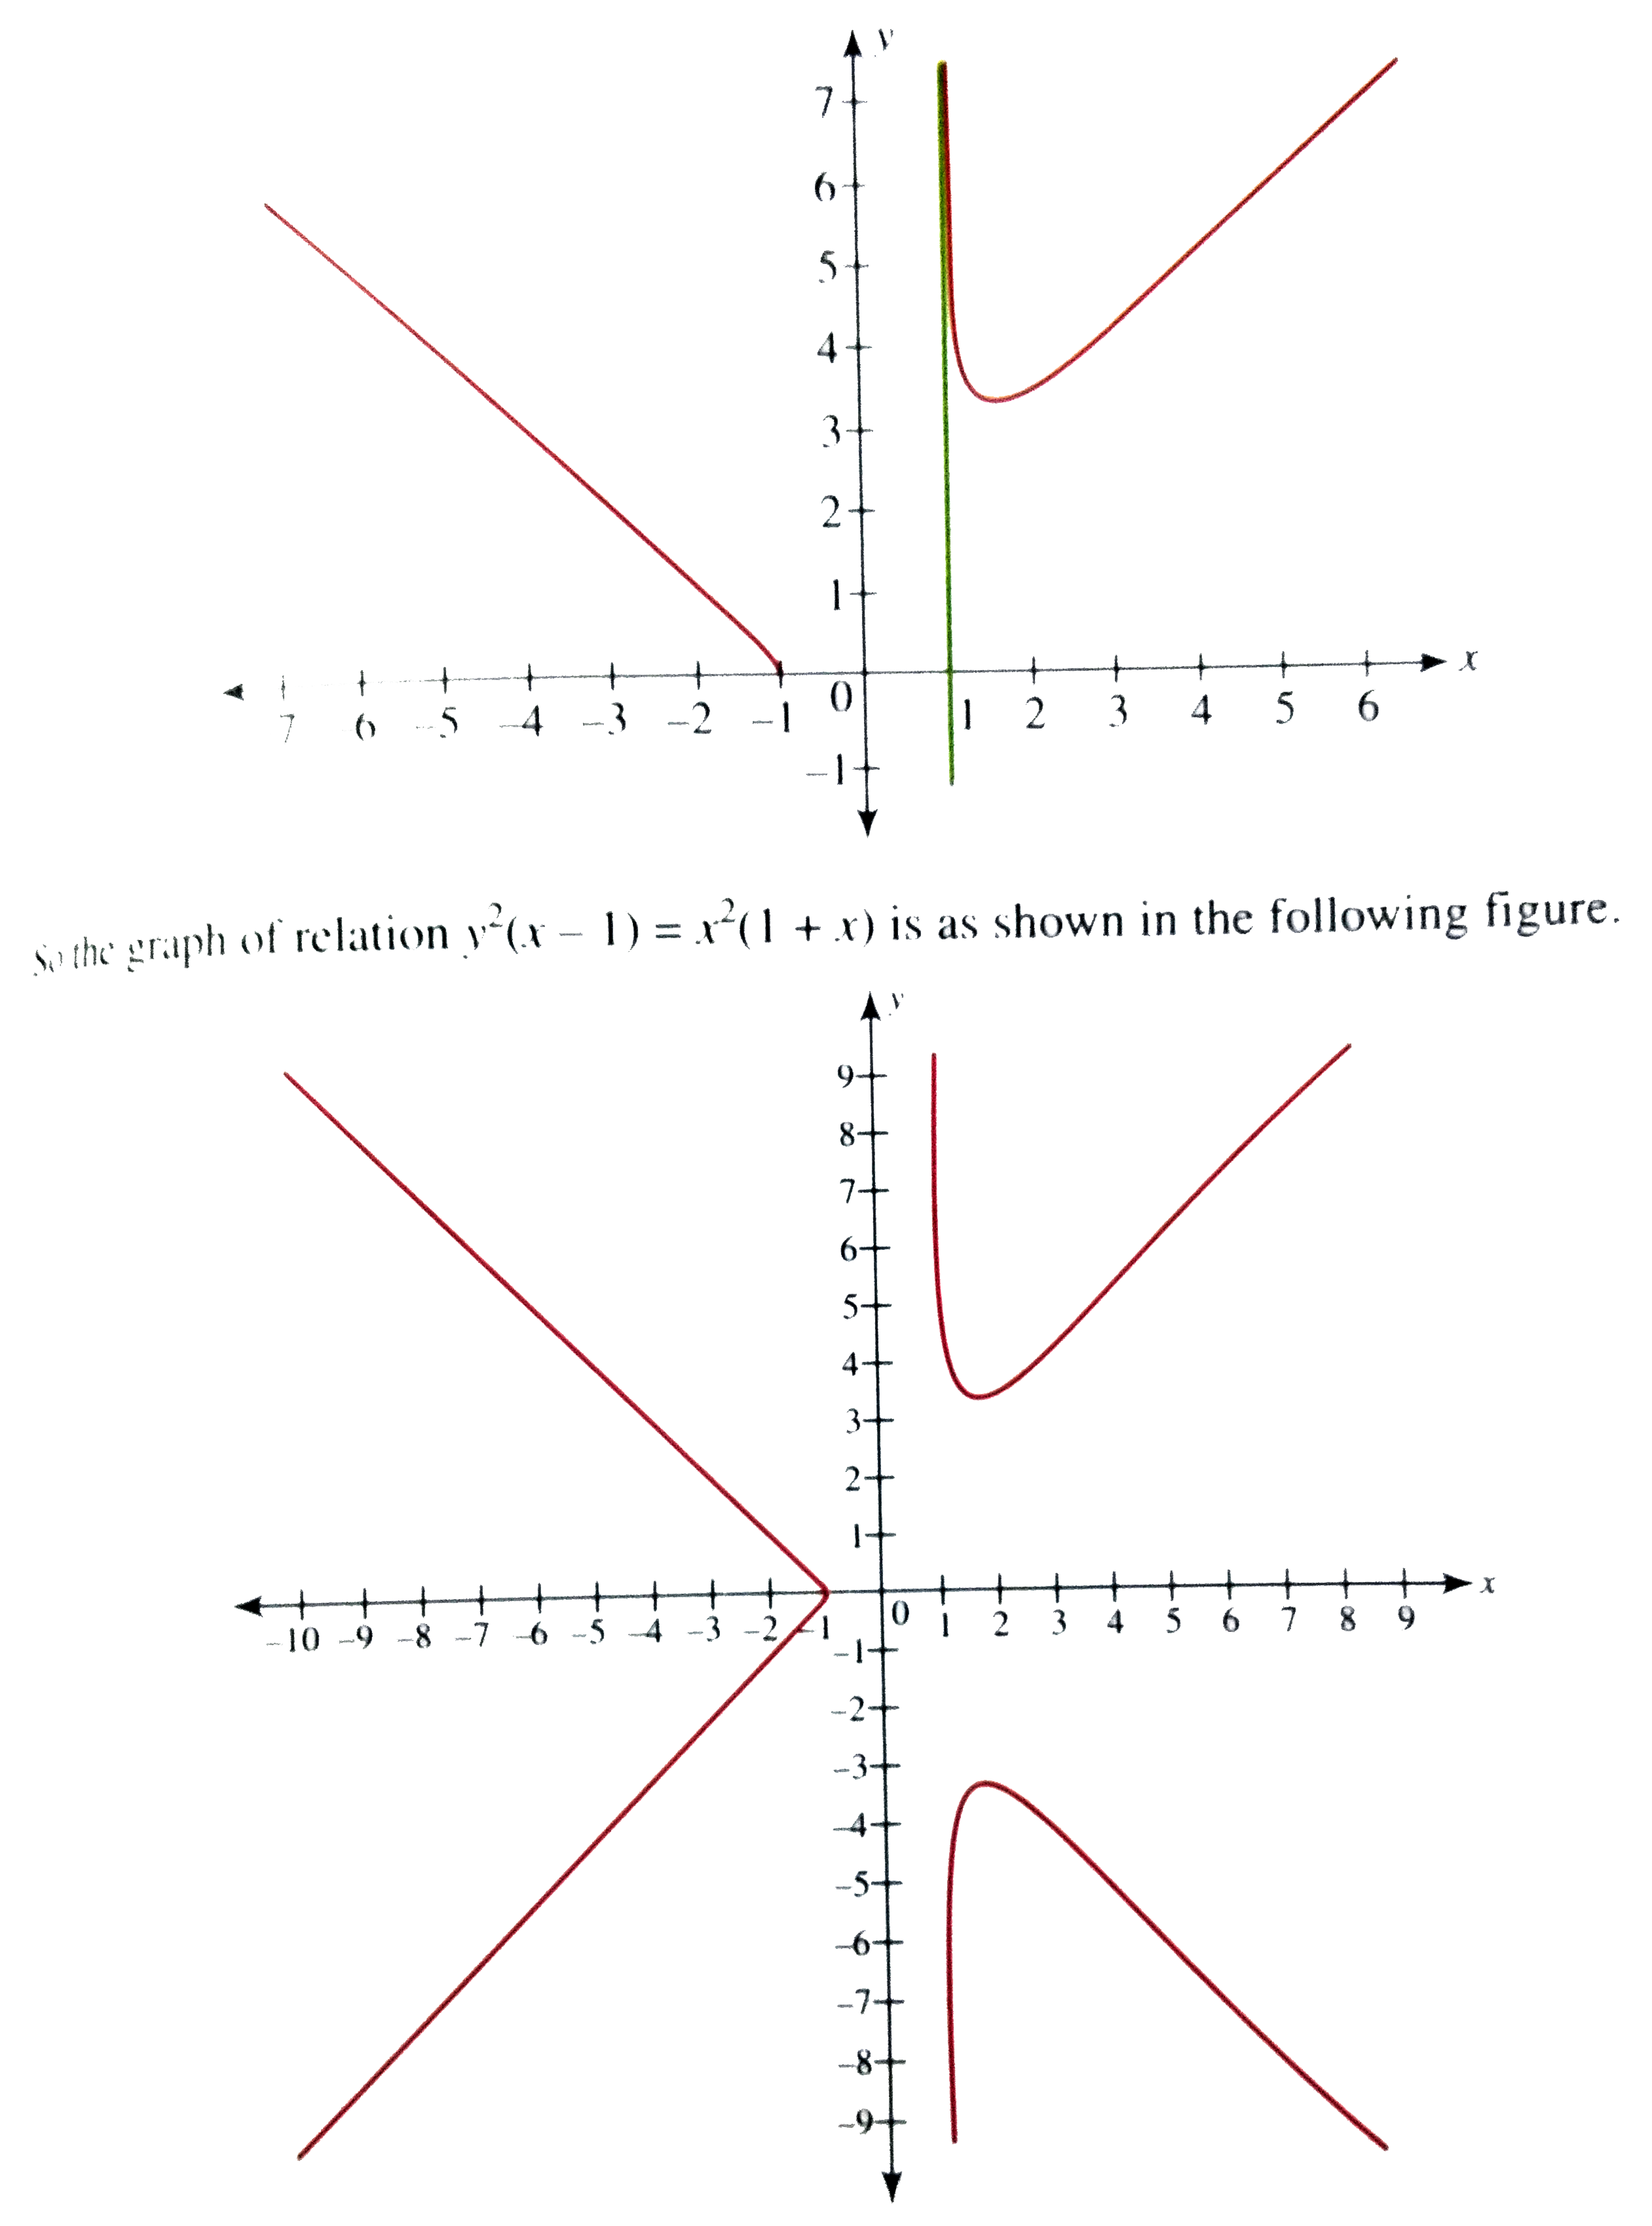
So the graph of y=f(x)=x√x+1x−1 is as shown in the following figure.

So the graph of relation y2(x−1)=x2(1+x) is as shown in the following figure.

Topper's Solved these Questions
Similar Questions
Find the derivative of y=sin2x−cosx
View SolutionLet →a and →b be two vectors of equal magnitude 5 units. Let →p,→q be vectors such that →p=→a−→b and →q=→a+→b. If |→p×→q|=2{λ−(→a.→b)2}12, then value of λ is
View SolutionLet f be a non-negative function defined on the interval [0,1]. If ∫x0√1−(f′(t))2dt=∫x0f(t)dt,0≤x≤1,and f(0)=0, then
View SolutionDraw the graph of y=x−1x−2.
View SolutionDraw the graph of the relation y2=x2(1−x)
View SolutionDraw the graph of the relation (y−x)2=x3
View SolutionDraw the graph of the relation y2(x−1)=x2(1+x)
View SolutionDraw the graph of the relation y=|x|√1−x2
View SolutionDraw the graph of the relation y2=x5(2−x)
View SolutionDraw the graph of y=x−1x−2.
View Solution
