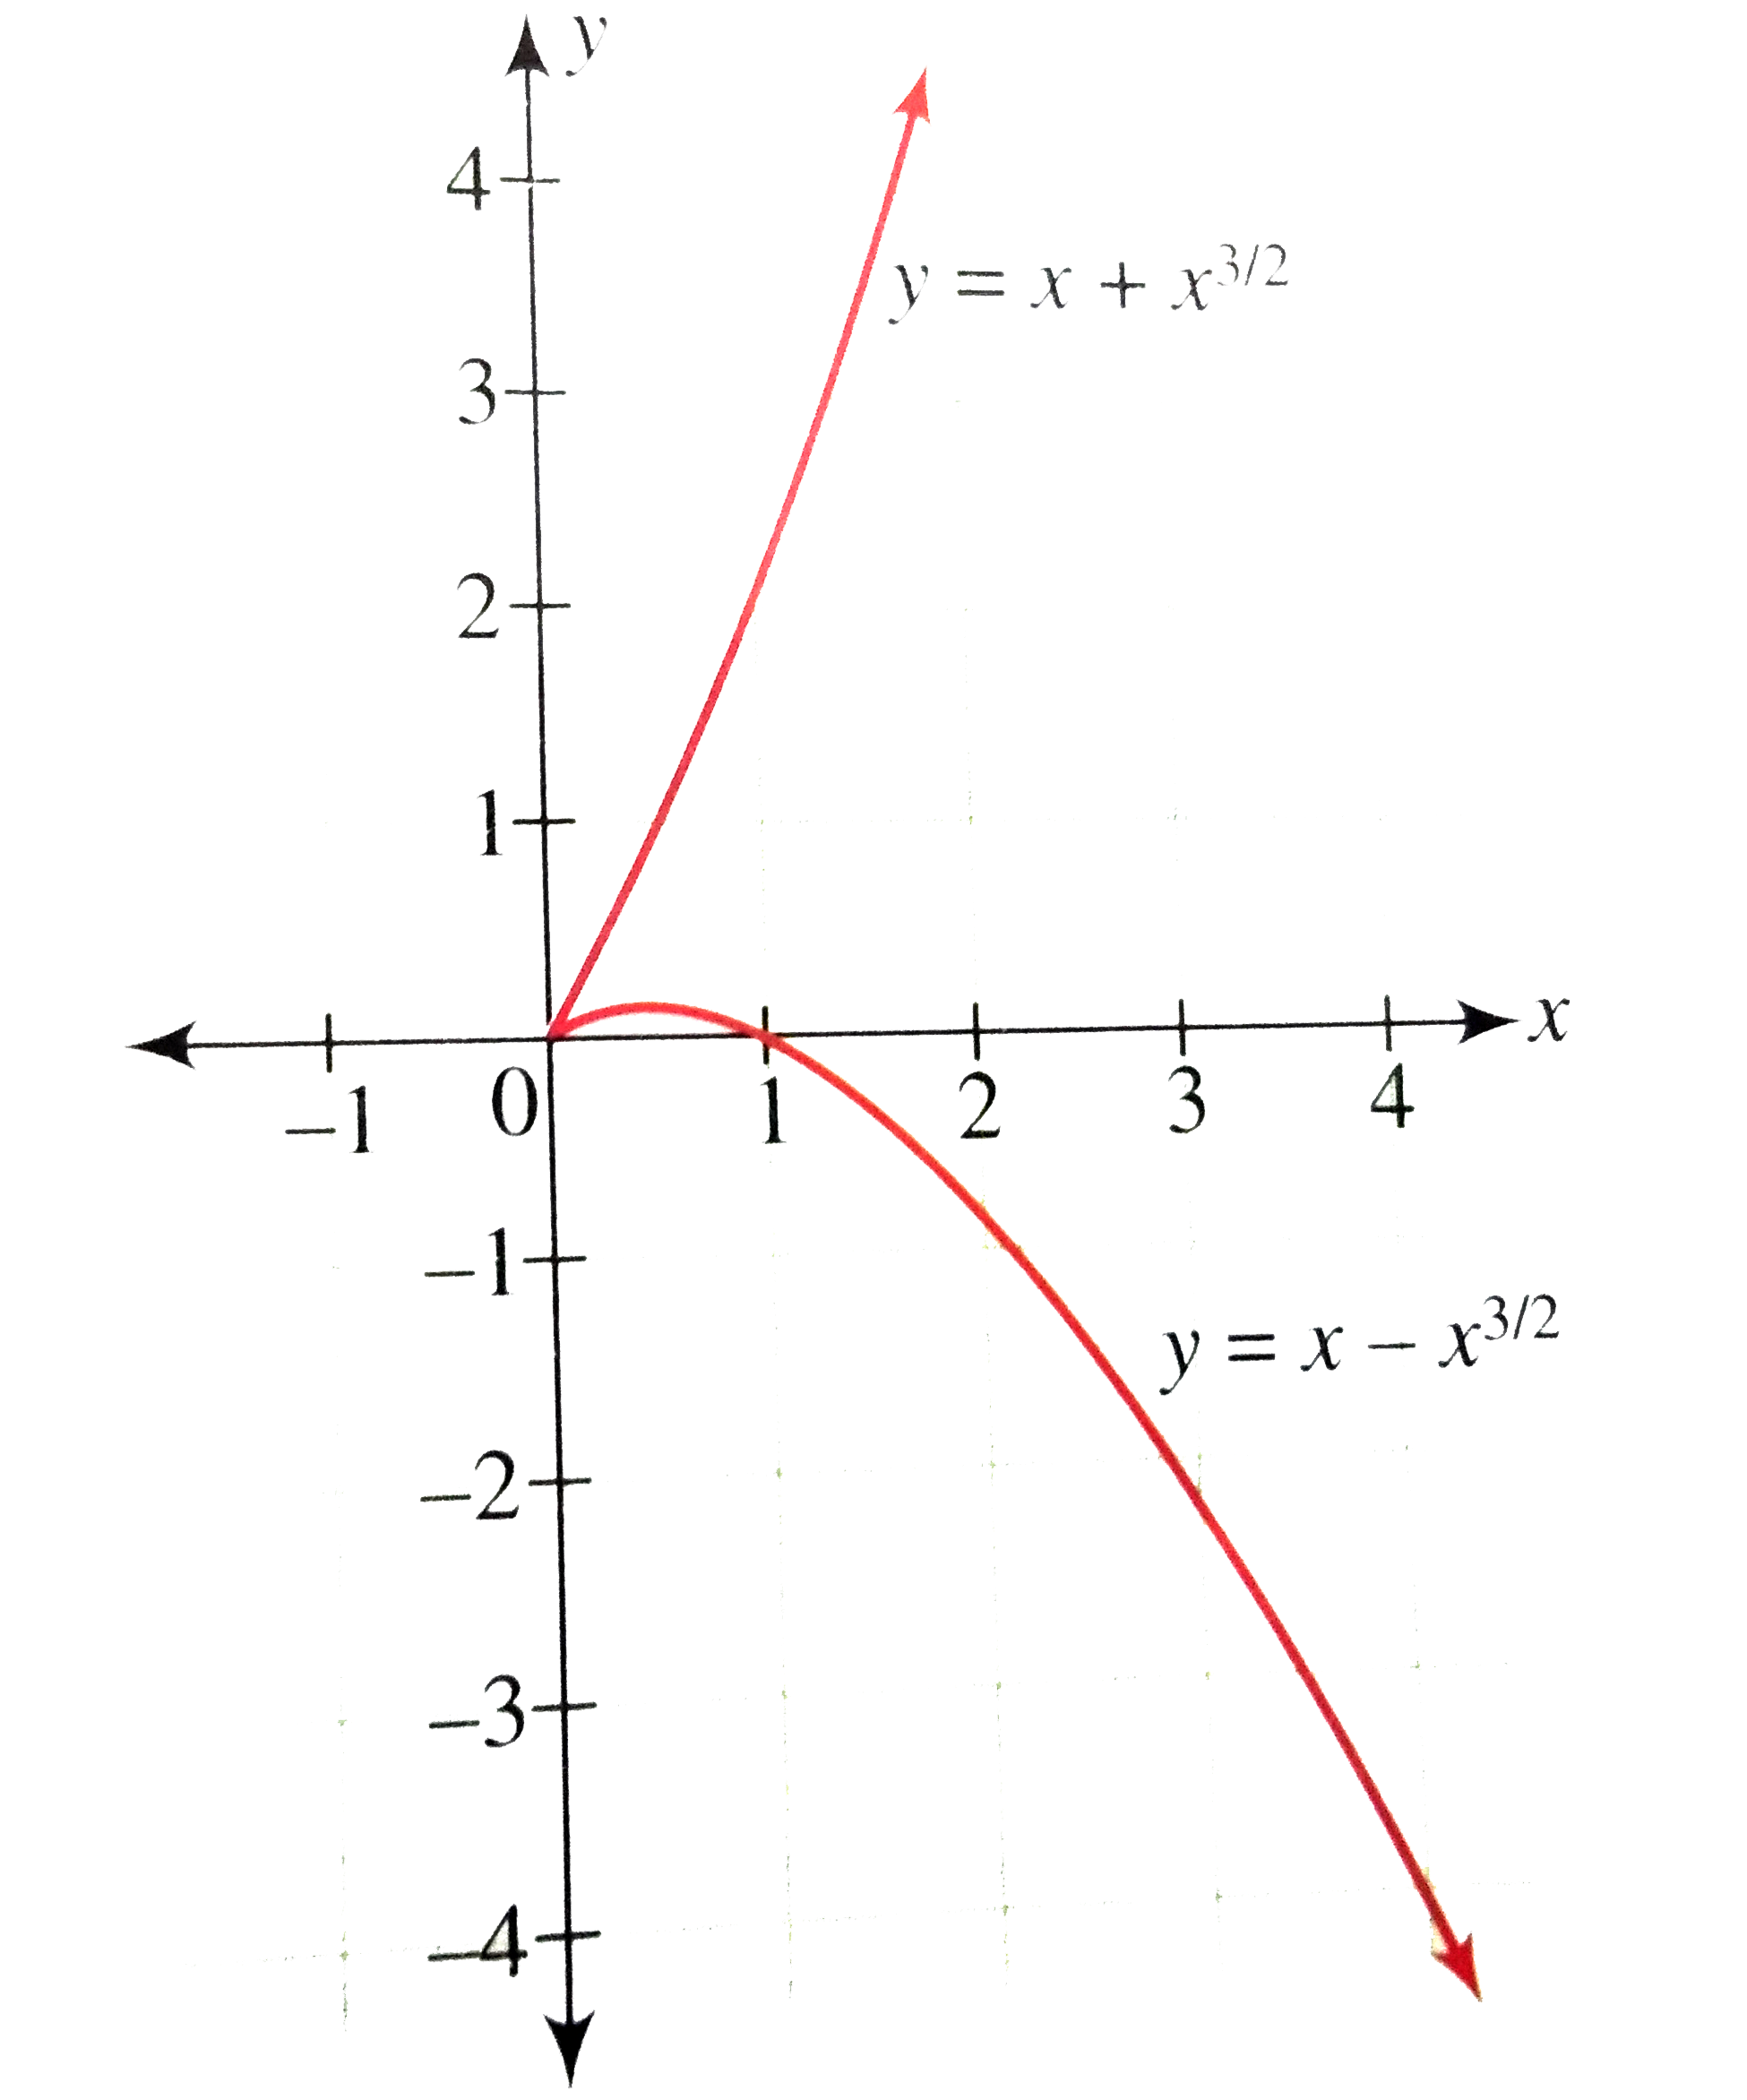
Draw the graph of the relation (y−x)2=x3
Text Solution
We have (y−x)2=x3
We must have x≥0
⇒y−x=±x3/2
⇒y=x+x3/2………………(i)
or y=x−x3/2…………..(ii)
Function (i) is an increasing function and always non-negative. So its graph lies above the x-axis.
Function (ii) meets the x-axis, where x−x3/2=0 or x=0,1
When x→∞,x−x3/2→−∞
From these information, we can plot the graph of functions as shown in the following figure.

|
Topper's Solved these Questions
Similar Questions
Draw the graph of the relation y2=x5(2−x)
View SolutionDraw the graph of the relation y2=x5(2−x)
View SolutionDraw the graph of the relation y2=x2(1−x)
View SolutionDraw the graph of the relation y2=x2(1−x)
View SolutionDraw the graph of the relation y2(x−1)=x2(1+x)
View SolutionDraw the graph of the relation y2(x−1)=x2(1+x)
View SolutionDraw the graph of the relation 4y2=x2(4−x2)
View SolutionDraw the graph of the relation 4y2=x2(4−x2)
View SolutionDraw the graph of the equation 2x+y=3
View SolutionDraw the graph of the equation 2x+y=3
View Solution
