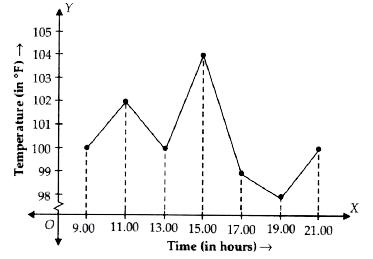
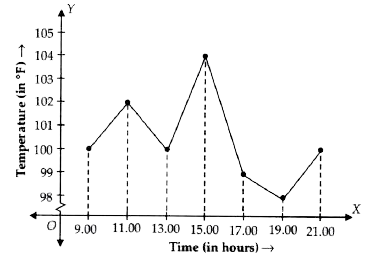
Draw the temperature-time graph in each of the following cases: Time (in hours:), 7:00, 9:00, 11:00, 13:00, 15:00, 17:00, 19:00, 21:00 Temperature 0F) ∈ , 100, 101, 104, 102, 100, 99, 100, 98 (ii) Time (in hours), 8:00, 10:00, 12:00, 14:00, 16:00, 18:00, 20: Temperature ( 0F) in, 100, 101, 104, 103, 99, 98, 100
Step by step video & image solution for Draw the temperature-time graph in each of the following cases: Time (in hours:), 7:00, 9:00, 11:00, 13:00, 15:00, 17:00, 19:00, 21:00 Temperature \ ^0F)\ in , 100, 101, 104, 102, 100, 99, 100, 98 (ii) Time (in hours), 8:00, 10:00, 12:00, 14:00, 16:00, 18:00, 20: Temperature (\ ^0F) in, 100, 101, 104, 103, 99, 98, 100 by Maths experts to help you in doubts & scoring excellent marks in Class 8 exams.
Updated on:21/07/2023Topper's Solved these Questions
Similar Questions
Draw the velocity-time graph from the following data: Time (in hours), 7:00, 8:00, 9:00, 10:00, 11:00, 12:00, 14:00, 14:00 Speed in km/hr, 30, 45, 60, 50, 70, 50, 40, 45
View SolutionHow many significant figures are there in each of the following numbers:
(i) 1.00×10⁶, (ii) 0.00010, (ii) π
View Solution
Knowledge Check
Which one of the following is correct in respect of the matrix ?
⎡⎢⎣00−10−10−100⎤⎥⎦ ?AA. A−1 does not existBB. A=(-1) ICC. A is a Zero matrixDD. A2=1What is the fraction of the solute in a 1.00 m aqueous solution ?
A0.0354B0.0177C0.177D1.770What is the mole fraction of the solute in a 1.00 m aqueous solution ?
A0.0354B0.0177C0.177D1.770
The temperature of patient, admitted in a hospital with typhoid fever, taken at different times of the day are given below. Draw the temperature-time graph to represent the data: Time (in hours), 6:00, 8:00, 10:00, 12:00, 14:00, 16:00, 18:00 Temp. (in 0F): , 102, 100, 99, 103, 100, 102, 99
View SolutionA car is going for a long journey of 16 hours, starting at 5:00 hrs. The speeds of the car at different hours are given below:
Time (in hours):, 5:00, 7:00, 9:00, 11:00, 13:00, 15:00, 17:00, 19:00, 21:00
Speed (in km/hour):, 40, 50, 60, 80, 70, 65, 75, 60, 50
Draw a velocity-time graph for the above data:
View SolutionObserve the graph and answer the following questions.
The temperature of the patient at 11.00 hours is

View SolutionObserve the graph and answer the following questions.
The temperature of the patient at 15: 00 hours is

View SolutionIf Rs. 2800 is 27 percent of the value of a house, the worth of the house (in Rs.) is 8,00,000 b. 9,80,000 c. 10,00,000 d. 12,00,000
View Solution