Fifty seeds were selected at random from each of 5 bags of seeds, and were kept under standardised conditions favourable to germination. After 20 days, the number of seeds which had germinated in each collection were counted and recorded as follow
To solve the problem, we need to calculate the probability of different scenarios based on the germination of seeds from the bags. We have the following data from the bags:
- Bag 1: 40 seeds germinated
- Bag 2: 48 seeds germinated
- Bag 3: 42 seeds germinated
- Bag 4: 39 seeds germinated
- Bag 5: 41 seeds germinated
Now, let's calculate the probabilities step by step.
Step 1: Probability of more than 40 seeds germinating
1. Identify the favorable outcomes: We need to count how many bags have more than 40 seeds germinated.
- Bag 1: 40 (not counted)
- Bag 2: 48 (counted)
- Bag 3: 42 (counted)
- Bag 4: 39 (not counted)
- Bag 5: 41 (counted)
So, the favorable outcomes are from Bag 2, Bag 3, and Bag 5. This gives us a total of 3 favorable outcomes.
2. Total outcomes: The total number of bags is 5.
3. Calculate the probability:
P(more than 40 seeds)=Number of favorable outcomesTotal outcomes=35
Step 2: Probability of exactly 49 seeds germinating
1. Identify the favorable outcomes: We need to check if any bag has exactly 49 seeds germinated.
- Bag 1: 40 (not counted)
- Bag 2: 48 (not counted)
- Bag 3: 42 (not counted)
- Bag 4: 39 (not counted)
- Bag 5: 41 (not counted)
There are no bags with exactly 49 seeds germinated, so the number of favorable outcomes is 0.
2. Total outcomes: The total number of bags is still 5.
3. Calculate the probability:
P(exactly 49 seeds)=Number of favorable outcomesTotal outcomes=05=0
Step 3: Probability of more than 35 seeds germinating
1. Identify the favorable outcomes: We need to count how many bags have more than 35 seeds germinated.
- Bag 1: 40 (counted)
- Bag 2: 48 (counted)
- Bag 3: 42 (counted)
- Bag 4: 39 (counted)
- Bag 5: 41 (counted)
All bags have more than 35 seeds germinated, giving us a total of 5 favorable outcomes.
2. Total outcomes: The total number of bags is 5.
3. Calculate the probability:
P(more than 35 seeds)=Number of favorable outcomesTotal outcomes=55=1
Summary of Results
- Probability of more than 40 seeds germinating: 35
- Probability of exactly 49 seeds germinating: 0
- Probability of more than 35 seeds germinating: 1
- Bag 2: 48 seeds germinated
- Bag 3: 42 seeds germinated
- Bag 4: 39 seeds germinated
- Bag 5: 41 seeds germinated
- Bag 1: 40 (not counted)
- Bag 2: 48 (counted)
- Bag 3: 42 (counted)
- Bag 4: 39 (not counted)
- Bag 5: 41 (counted)
P(more than 40 seeds)=Number of favorable outcomesTotal outcomes=35
- Bag 1: 40 (not counted)
- Bag 2: 48 (not counted)
- Bag 3: 42 (not counted)
- Bag 4: 39 (not counted)
- Bag 5: 41 (not counted)
P(exactly 49 seeds)=Number of favorable outcomesTotal outcomes=05=0
- Bag 1: 40 (counted)
- Bag 2: 48 (counted)
- Bag 3: 42 (counted)
- Bag 4: 39 (counted)
- Bag 5: 41 (counted)
P(more than 35 seeds)=Number of favorable outcomesTotal outcomes=55=1
- Probability of more than 40 seeds germinating: 35
- Probability of exactly 49 seeds germinating: 0
- Probability of more than 35 seeds germinating: 1
Topper's Solved these Questions
Similar Questions
A polling agency recently surveyed 1,000 adults who were selected at random from alargecity and asked each of the adults,“Are you satisfied with the quality of air in the city?”Of those surveyed,78 percent responded that they were satisfied with the quality of air in the city. Based on the results of the survey, which of the following statements must be true?
I. Of all adults in the city,78 percent are satisfied with the quality of air in the city.
II. If another 1,000 adults selected at random from the city were surveyed,78 percent of them would report they are satisfied with the quality of air in the city.
III. If 1,000adults selected at random from a differentcity were surveyed,78percent of them would report they are satisfied with the quality of air in the city
View Solution
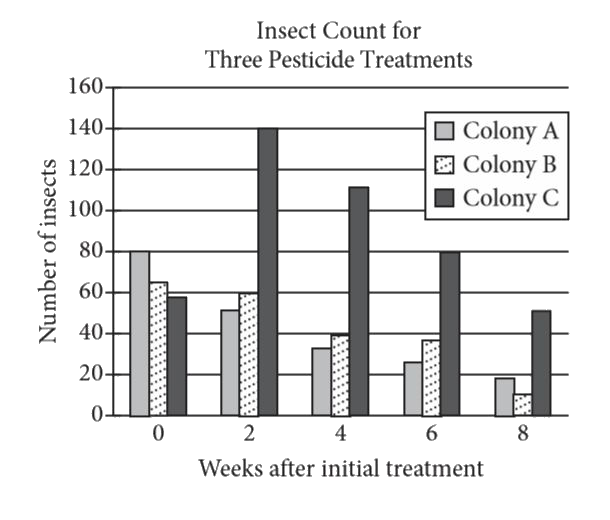
Three colonies of insects were each treated with a different pesticide over an 8-week period to test the effectiveness of the three pesticides. Colonies A, B, and C were treated with Pesticides A, B, and C, respectively. Each pesticide was applied every 2 weeks to one of the three colonies over the 8-week period. The bar graph above shows the insect counts for each of the three colonies 0, 2, 4, 6, and 8 weeks after the initial treatment.
Of the following, which is closest to the ratio of the total number of insects in all three colonies in week 8 to the total number of insects at the time of initial treatment?
View Solution
Knowledge Check
A research study was conducted to determine whether a certain electrical implant, I, is successful in improving hearing . From a large population of people with hearing loss, 400 participants were selected at random. Half were randomly selected to receive the implant and the other half did not receive the implant . The resulting data showed that people who received the implant had significantly improved hearing compared to those who did not receive the implant.
Based on the study , which of the following is an appropriate conclusion ?AElectrical implant I is likely to improve the hearing of people who have hearing loss.BElectrical implant I is likely to improve the hearing of all people who have the implant.CElectrical implant I is better than other treatments for hearing loss.DElectrical implant I will cause a substantial improvement in hearing.Read the passage given below, and answer the questions that follow:
Some students wanted to investigate the pattern of inheritance of flower colour in snapdragon. They selected some plants which were homozygous for red flowers and some other plants which were homozygous for white flowers. These plants were labelled as Parental Plants (P1). These plants (red-flowered and white flowered), were cross-pollinated. The seeds obtained from these plants were planted in a separate field. These seeds germinated to produce the plants which were labelled as the plants of F1-generation.
Based on the above experiment, answer the following questions:
This type of inheritance can be described as:APolygenic inheritanceBIncomplete dominanceCCo-dominanceDPleiotropismRead the passage given below, and answer the questions that follow:
Some students wanted to investigate the pattern of inheritance of flower colour in snapdragon. They selected some plants which were homozygous for red flowers and some other plants which were homozygous for white flowers. These plants were labelled as Parental Plants (P1). These plants (red-flowered and white flowered), were cross-pollinated. The seeds obtained from these plants were planted in a separate field. These seeds germinated to produce the plants which were labelled as the plants of F1-generation.
Based on the above experiment, answer the following questions:
The biological name of snapdragon is:AAntirrhinum majusBPisum sativumCLathyrus odoratusDRhizobium leguminosarum
Study the given data and answer the questions that follow.
A sample of an enzyme called lactase was isolated from the intestinal lining of a calf. Assays were undertaken to evaluate the activity of the enzyme sample.
The substrate of lactase is the disaccharide lactose. Lactase breaks a lactose molecule in two, producing a glucose molecule and a galactose molecule.
Two assays were carried out.
Lactose concentration (% w/v)151515151515Concentration of enzyme smaple (%v/v)0510152025Reaction rate μmole glucose sec−1mL−10255075100125
Lactose concentration (% w/v)0510152530Concentration of enzyme smaple (%v/v)555555Reaction rate μmole glucose sec−1mL−101525354040
What are the variables in each of the two assays ?
View SolutionRead the passage given below, and answer the questions that follow:
Some students wanted to investigate the pattern of inheritance of flower colour in snapdragon. They selected some plants which were homozygous for red flowers and some other plants which were homozygous for white flowers. These plants were labelled as Parental Plants (P1). These plants (red-flowered and white flowered), were cross-pollinated. The seeds obtained from these plants were planted in a separate field. These seeds germinated to produce the plants which were labelled as the plants of F1-generation.
Based on the above experiment, answer the following questions:
Select the statement which correctly predicts the phenotype of the plants of F1 generation.
View SolutionRead the passage given below, and answer the questions that follow:
Some students wanted to investigate the pattern of inheritance of flower colour in snapdragon. They selected some plants which were homozygous for red flowers and some other plants which were homozygous for white flowers. These plants were labelled as Parental Plants (P1). These plants (red-flowered and white flowered), were cross-pollinated. The seeds obtained from these plants were planted in a separate field. These seeds germinated to produce the plants which were labelled as the plants of F1-generation.
Based on the above experiment, answer the following questions:
If the plants of F1-generation are allowed to self-pollinate, then in F2-generation.
View SolutionRead the passage given below, and answer the questions that follow:
Some students wanted to investigate the pattern of inheritance of flower colour in snapdragon. They selected some plants which were homozygous for red flowers and some other plants which were homozygous for white flowers. These plants were labelled as Parental Plants (P1). These plants (red-flowered and white flowered), were cross-pollinated. The seeds obtained from these plants were planted in a separate field. These seeds germinated to produce the plants which were labelled as the plants of F1-generation.
Based on the above experiment, answer the following questions:
The genotypic ratio of the plants of F2-generation will be:
View Solution
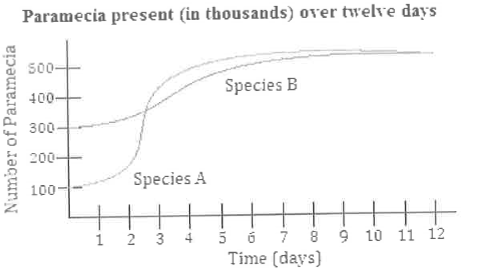
A small puddle is monitored by scientists for the number of paramecia present. The scientists are in two distinct species, let's call them ''species A'' and ''species B''. At time t = 0, the scientists measure and estimate the amount of species A and species B present in the puddle. They then proceed to measure and record the number of each species of paramecium present every hour for 12 days. the data for each species were then fit by a smooth curve, as shown in the graph above. Which of the following is a correct statement about the data above?
View Solution
