Following is the distribution of marks of 70 students in a periodical test

Draw a cumulative frequency curve for the above data.
The correct Answer is:NA
Step by step video solution for Following is the distribution of marks of 70 students in a periodical test Draw a cumulative frequency curve for the above data. by Maths experts to help you in doubts & scoring excellent marks in Class 10 exams.
Updated on:21/07/2023Similar Questions
Make a frequency curve of the following data :

View SolutionCumulative Frequency Distribution
View SolutionThe following is the distribution of weights (in kg) of 40 persons.

Construct a cumulative frequency distribution (of the less than type) table for the data above.
View SolutionMake the frequency table and the cumulative frequency curve for following data
View SolutionDraw a less than cumuative frequency curve (ogive) for the following distribution :

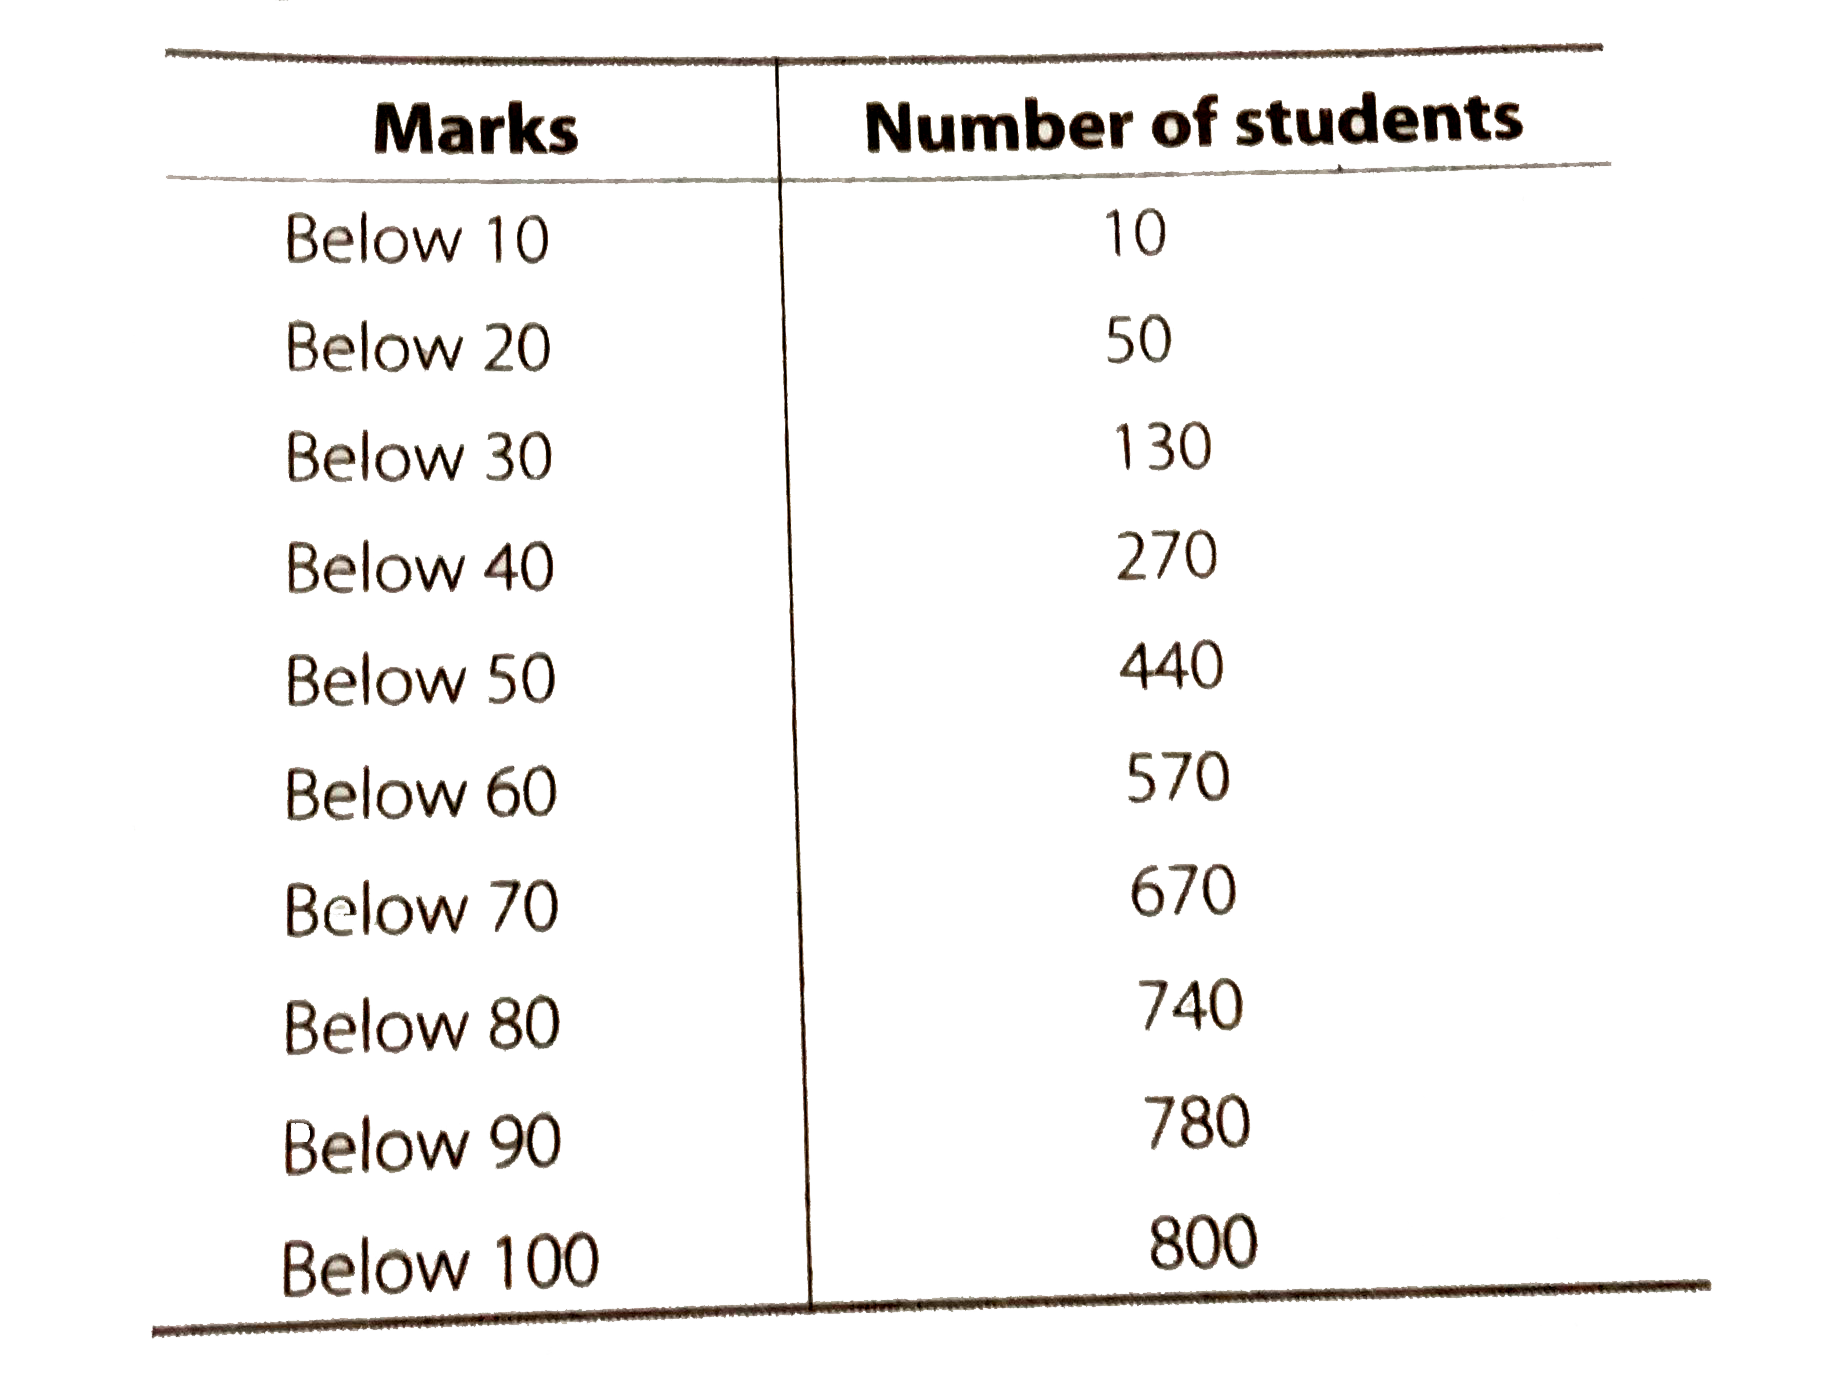
View SolutionThe following table show tha cumulative frequency distribution of marks of 800 students in an examination.

Construct a frequency distribution table for the data above.
View SolutionThe frequency distribution of marks obtained by students in a class test is given below .
Draw frequency polygon and ogive.

View SolutionWhat is cumulative frequency of marks less than 15
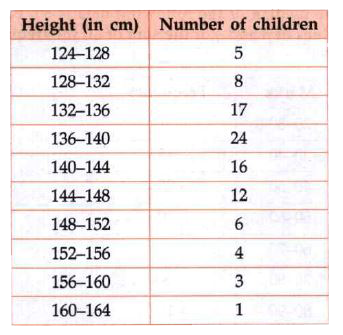
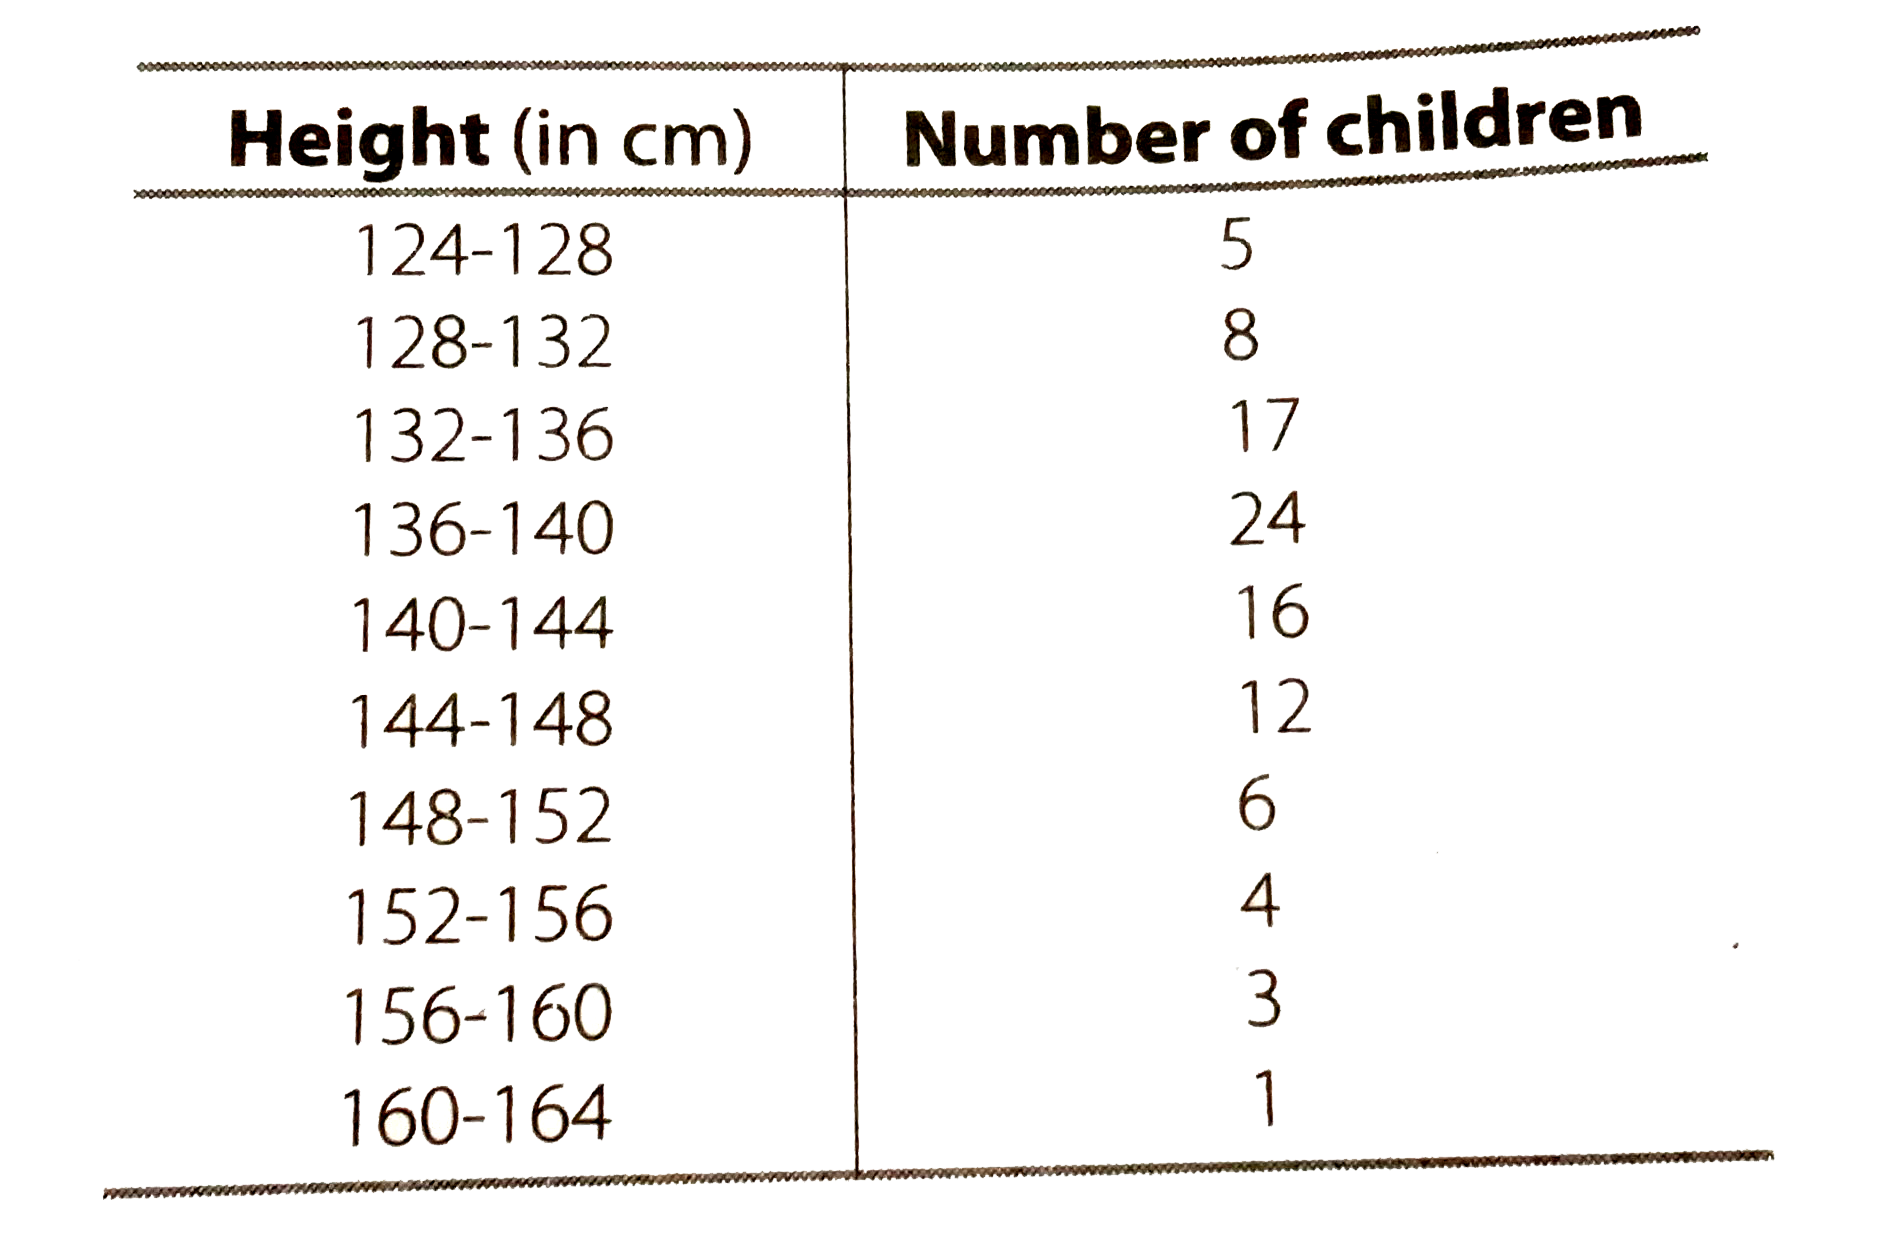
View SolutionThe distribution of heights (in cm) of 96 children is given below:
Draw a less than type cumulative frequency curve for this data and use it to compute median height of the children.

View SolutionThe distribution of heights (in cm) of 96 children is given below

Draw a less type cumulative frequencies curve fo this data and use it to compute meidan height of the children.
View Solution
