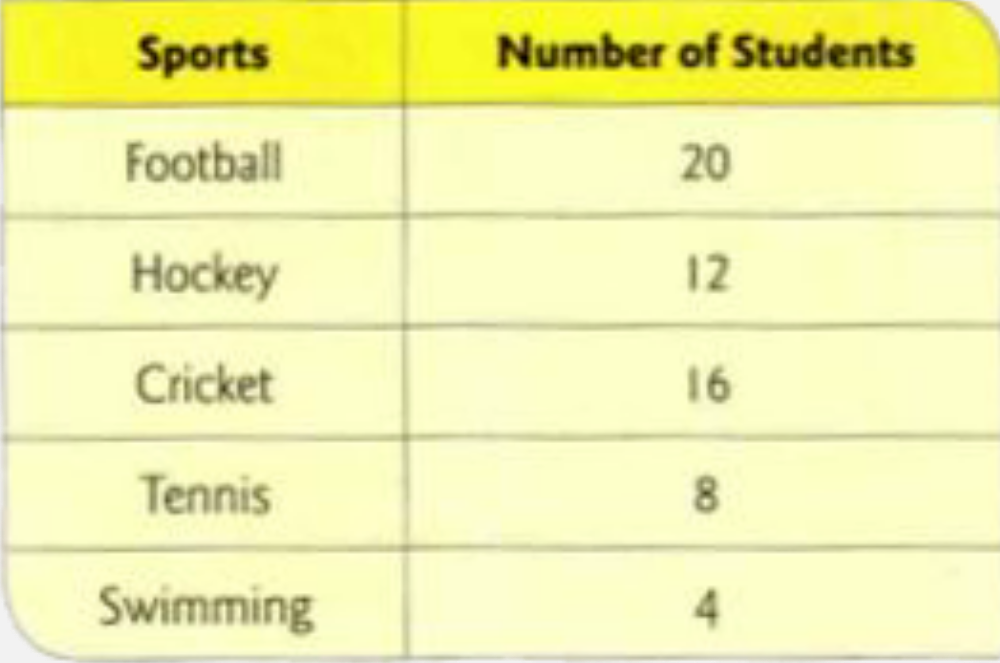
Following table represents the data collected from a group of children who were asked about their favourite sports. Represent the data as a bar graph.

The correct Answer is:(##OXFSMTICSEMATVIIC18E02014_A01##)
Step by step video & image solution for Following table represents the data collected from a group of children who were asked about their favourite sports. Represent the data as a bar graph. by Maths experts to help you in doubts & scoring excellent marks in Class 7 exams.
Updated on:21/07/2023Topper's Solved these Questions
- DATA HANDLING AND MEASURES OF CENTRAL TENDENCYBOOK - ICSECHAPTER - DATA HANDLING AND MEASURES OF CENTRAL TENDENCYEXERCISE - REVISION EXERCISE
39 Videos
- DATA HANDLING AND MEASURES OF CENTRAL TENDENCYBOOK - ICSECHAPTER - DATA HANDLING AND MEASURES OF CENTRAL TENDENCYEXERCISE - WARM-UP EXERCISE
5 Videos
- DATA HANDLING AND MEASURES OF CENTRAL TENDENCYBOOK - ICSECHAPTER - DATA HANDLING AND MEASURES OF CENTRAL TENDENCYEXERCISE - EXERCIES 18.1
37 Videos
- CONSTRUCTIONS BOOK - ICSECHAPTER - CONSTRUCTIONS EXERCISE - REVISION EXERCISE
12 Videos
- DATA HANDLING BOOK - ICSECHAPTER - DATA HANDLING EXERCISE - EXERCISE 24D
13 Videos
Similar Questions
Knowledge Check
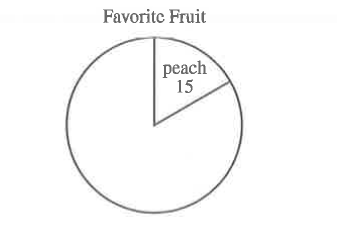
Jie asked 90 students to choose 1 favourite fruit from 4 options. Jie has begun to represent the results in the circle graph below. Peaches were chosen as the favourite of 15 students. Apples, bananas, and strawberries were each chosen as favourite by an equal number of the remaining students. What must be the measure of the central angle in the circle graph for banana?
 A100∘B102∘C105∘D112.5∘
Following table represents the lengths of six different ribbons.

f the given data has to be represented as a bar graph, then select the most appropriate scale from the given options that can be used to draw the bar graph.
1 unit = 1 cm
View SolutionFollowing table represents the lengths of six different ribbons.

f the given data has to be represented as a bar graph, then select the most appropriate scale from the given options that can be used to draw the bar graph.
1 unit = 3 cm
View SolutionFollowing table represents the lengths of six different ribbons.

f the given data has to be represented as a bar graph, then select the most appropriate scale from the given options that can be used to draw the bar graph.
1 unit = 10 cm
View SolutionFollowing table represents the lengths of six different ribbons.

f the given data has to be represented as a bar graph, then select the most appropriate scale from the given options that can be used to draw the bar graph.
1 unit = 5 cm
View SolutionAmong the following group which represents the collection of isoelectronic species ?
View SolutionThe following table gives the frequencies of most commonly used letters a,e,I,o,r,t,u, from a page of a book

Represent the information above by a bar graph.
View SolutionMr. Kapoor compares the prices (in) of different items at two different shops A and B. Examine the following table carefully and represent the data by a double bar graph.

View Solution

