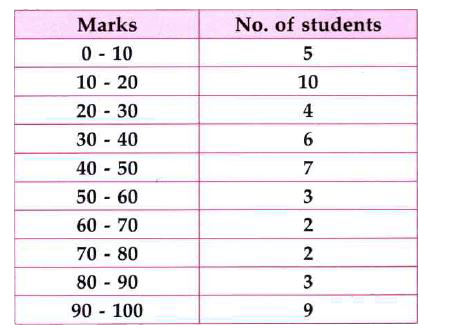
For the following data, draw a histogram and a frequency polygon

The correct Answer is:(##MTGFOUCOUMATIXC14SLV033_A01##)
Step by step video, text & image solution for For the following data, draw a histogram and a frequency polygon by Maths experts to help you in doubts & scoring excellent marks in Class 9 exams.
Topper's Solved these Questions
- BOOK - MTG IIT JEE FOUNDATIONCHAPTER - STATISTICSEXERCISE - NCERT SECTION (Exercise 14.1)2videos
STATISTICS
- BOOK - MTG IIT JEE FOUNDATIONCHAPTER - STATISTICSEXERCISE - NCERT SECTION (Exercise 14.2)15videos
STATISTICS
- BOOK - MTG IIT JEE FOUNDATIONCHAPTER - STATISTICSEXERCISE - Olympiad/HOTS Corner20videos
STATISTICS
- BOOK - MTG IIT JEE FOUNDATIONCHAPTER - QUADRILATERALS EXERCISE - Olympiad/HOTS CORNER15videos
QUADRILATERALS
- BOOK - MTG IIT JEE FOUNDATIONCHAPTER - TRIANGLESEXERCISE - OLYMPAID/ HOTS CORNER10videos
TRIANGLES
Similar Questions
Present the following data in the form of a frequency polygon :
 View Solution
Represent the following data by histogram:
 View Solution
From the following data, construct frequency histogram, frequency polygon and frequency curve.
 View Solution
Following table shows a frequency distribution for the speed of cars passing through at a particular spot on a high way.

Draw a histogram and frequency polygon representing the data above.View SolutionThe following is a frequency distribution of marks:

If a and b are equal, find their values. Draw a histogram and a frequency polygon.View SolutionDefine bar graph, histogram, frequency polygon
View SolutionRepresent the following data using a histogram.
 View Solution
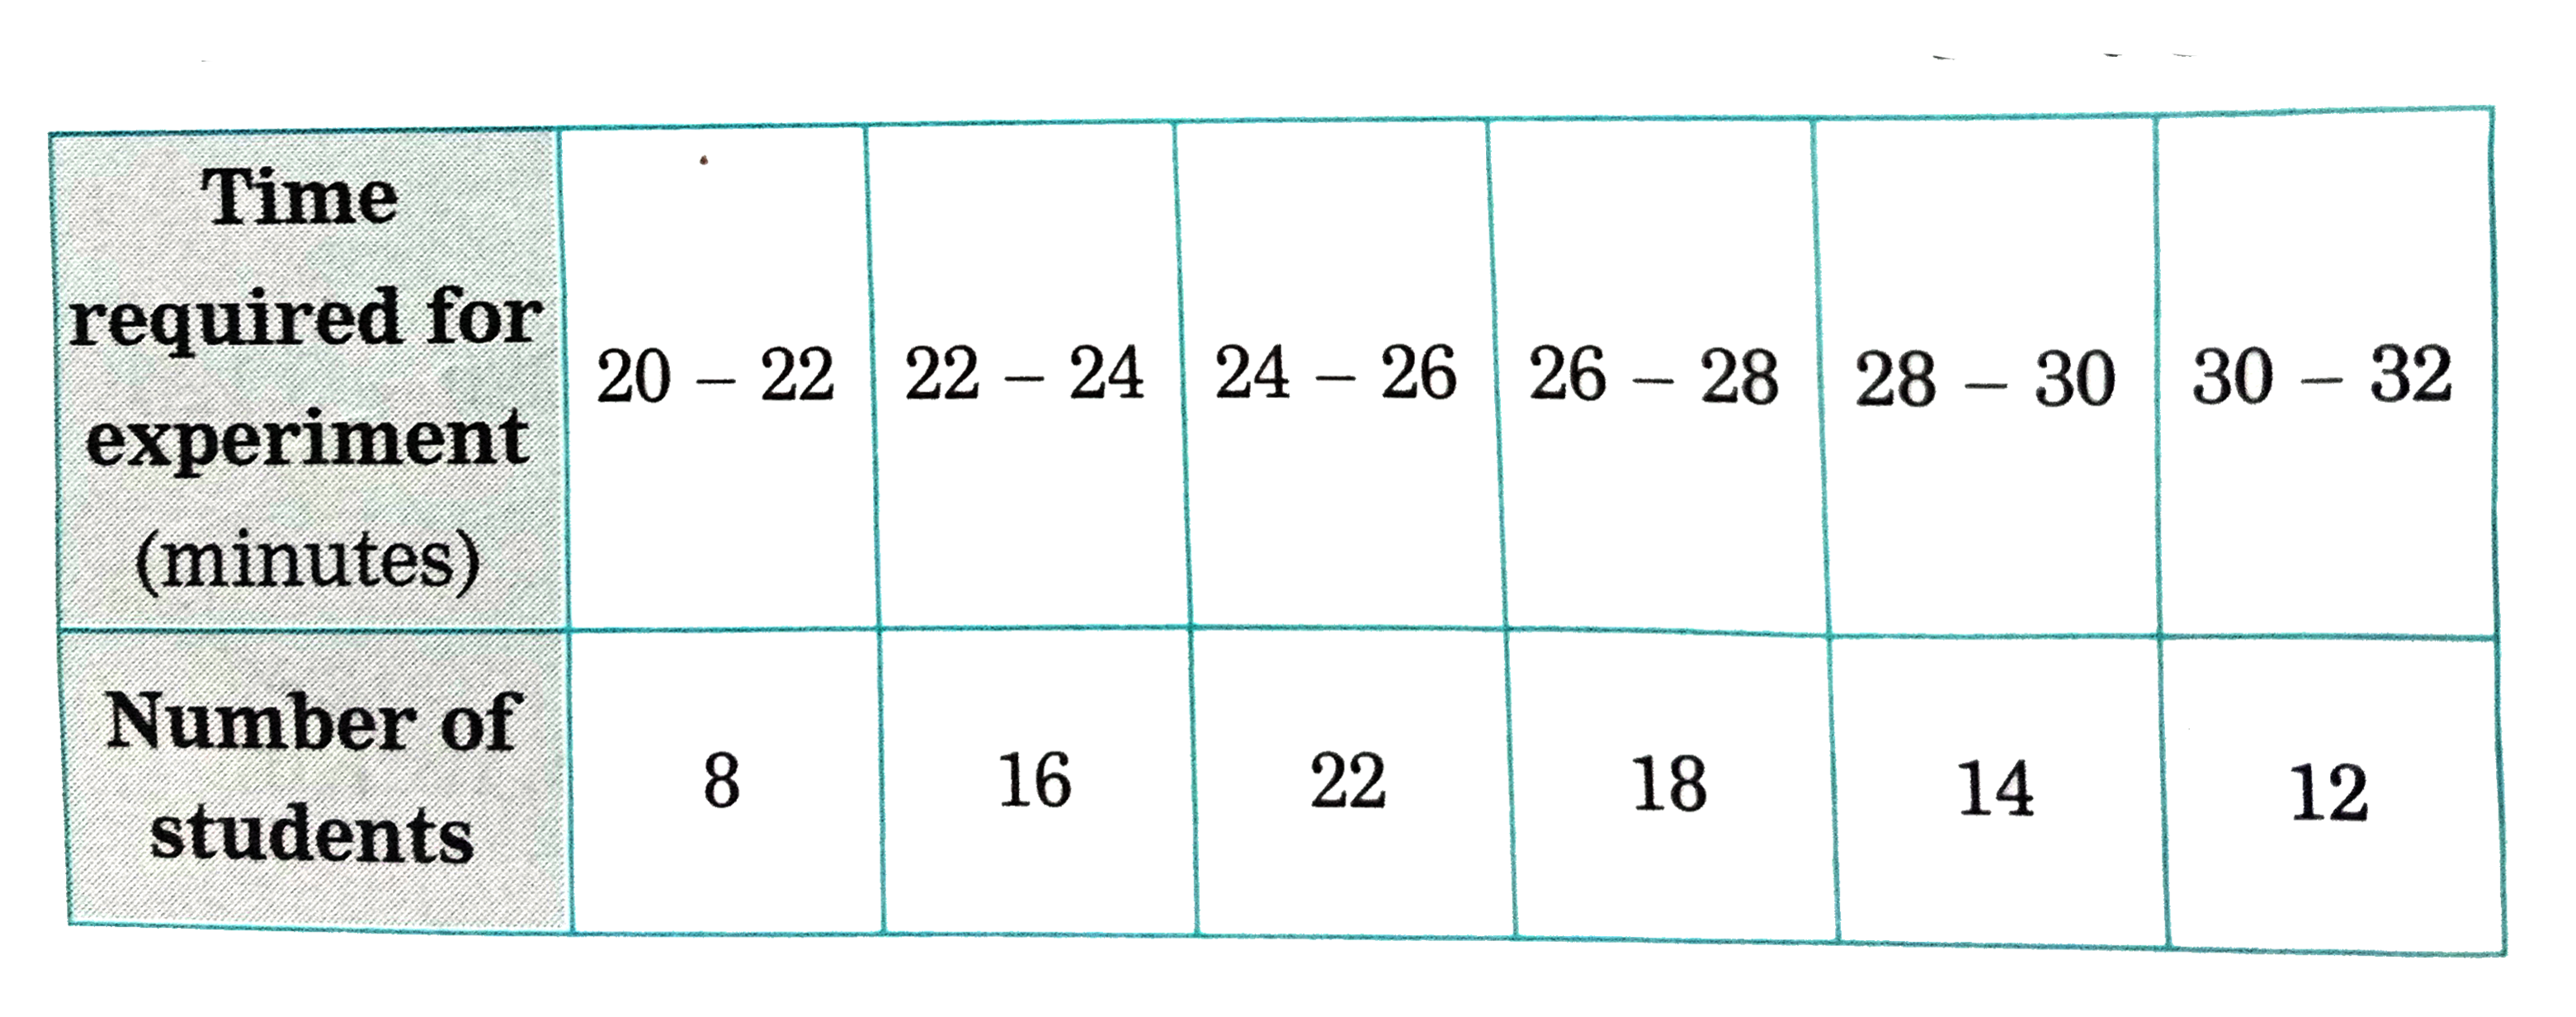
The time required for students to do a science experiment and the number of students is shown in the following grouped frequency distribution table. Show information by a histogram and also by a frequency polygon.
 View Solution
Prepare histogram and frequency polygon from the following data :
 View Solution
The following table is based on the marks of the first term examination of 10th class students . Show the information by a histogram. Also, draw a frequency polygon with the help of the histogram :
 View Solution

