From the frequency distribution table from the following data
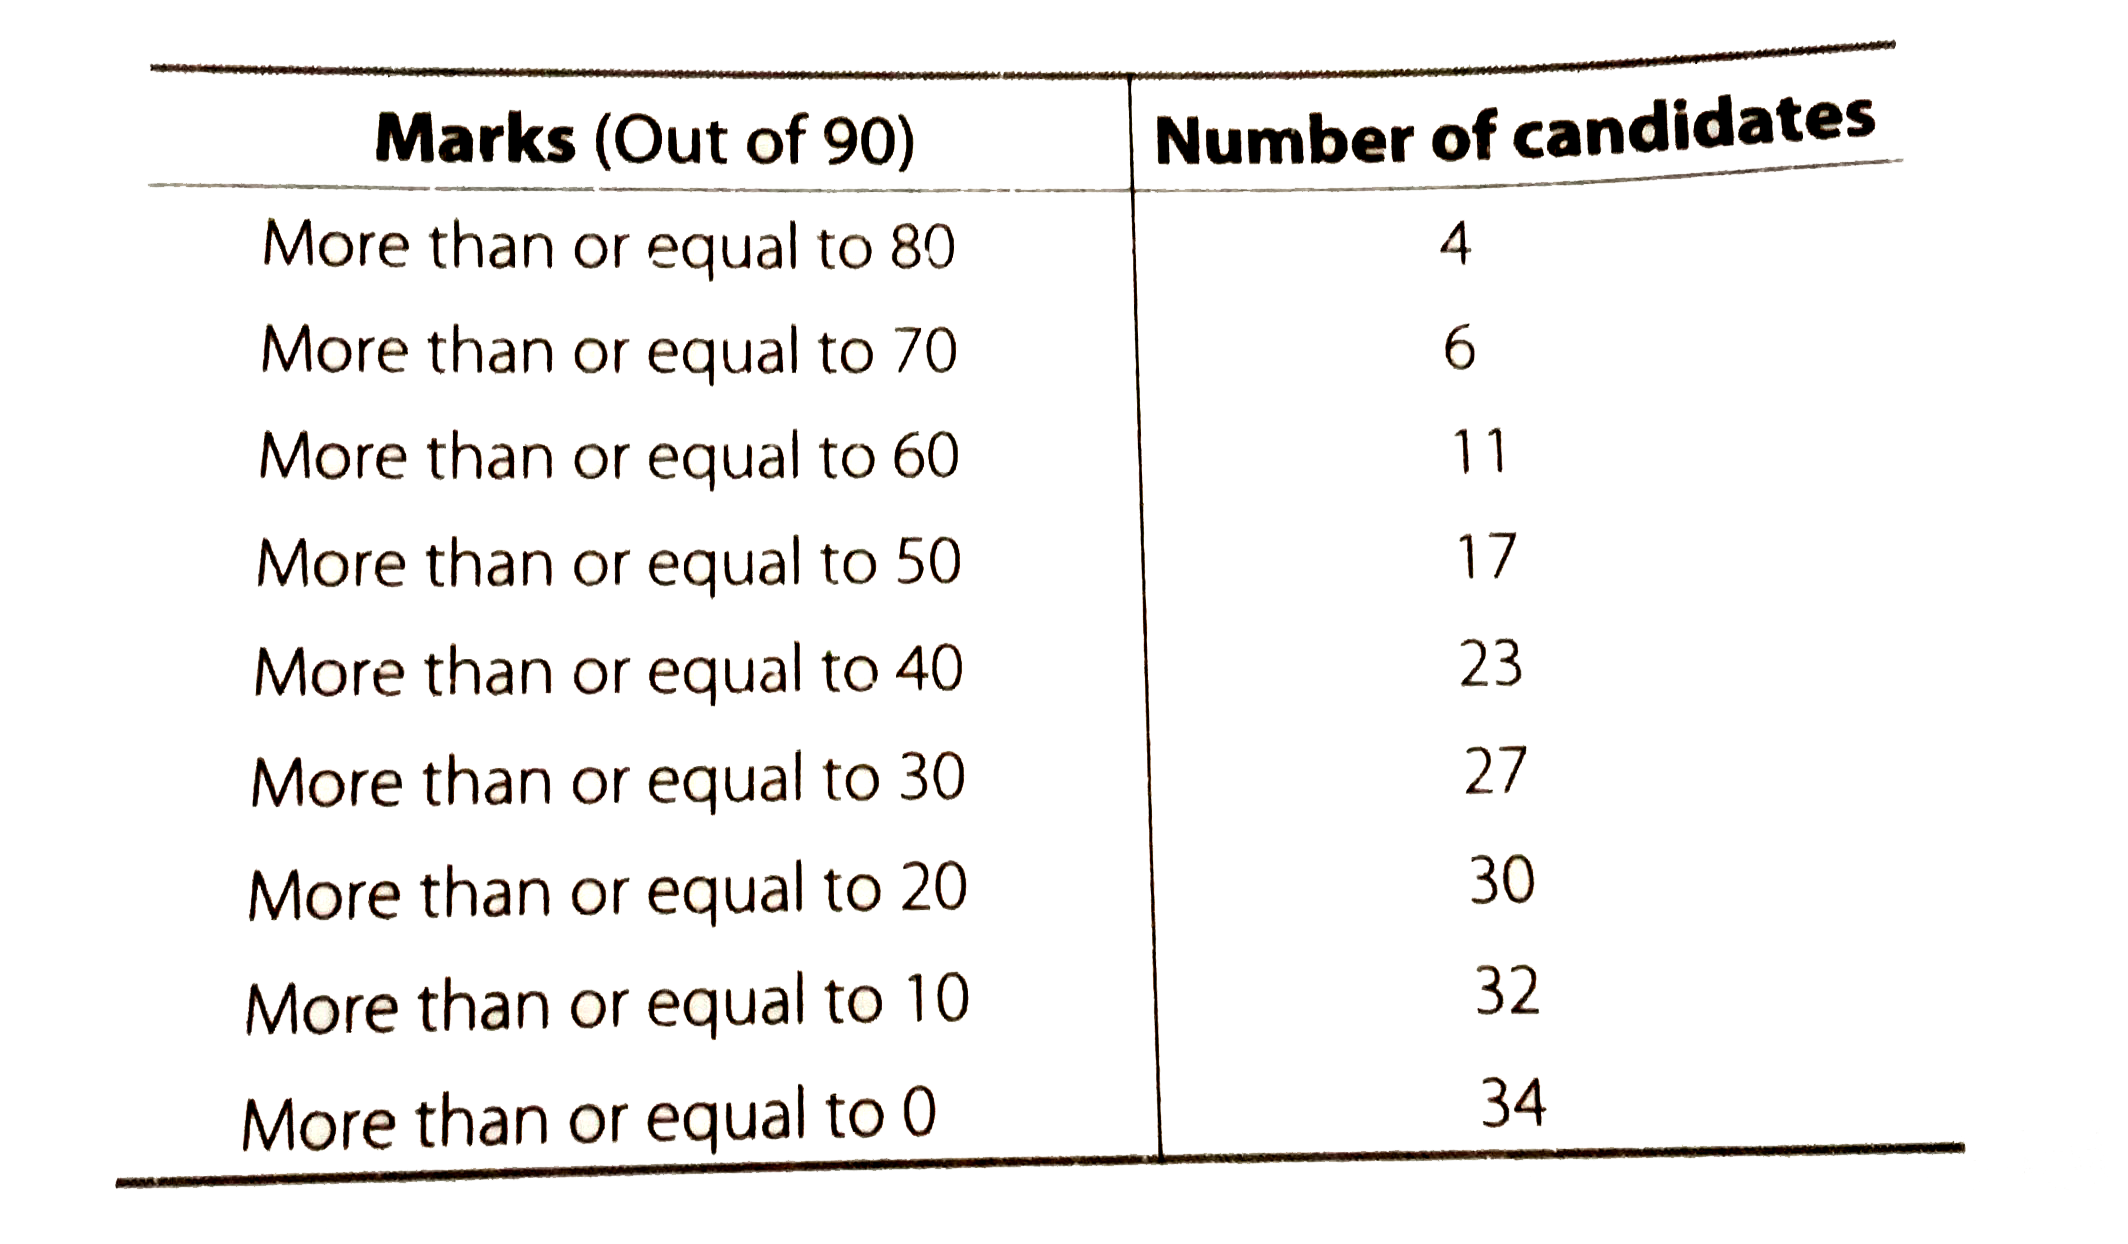
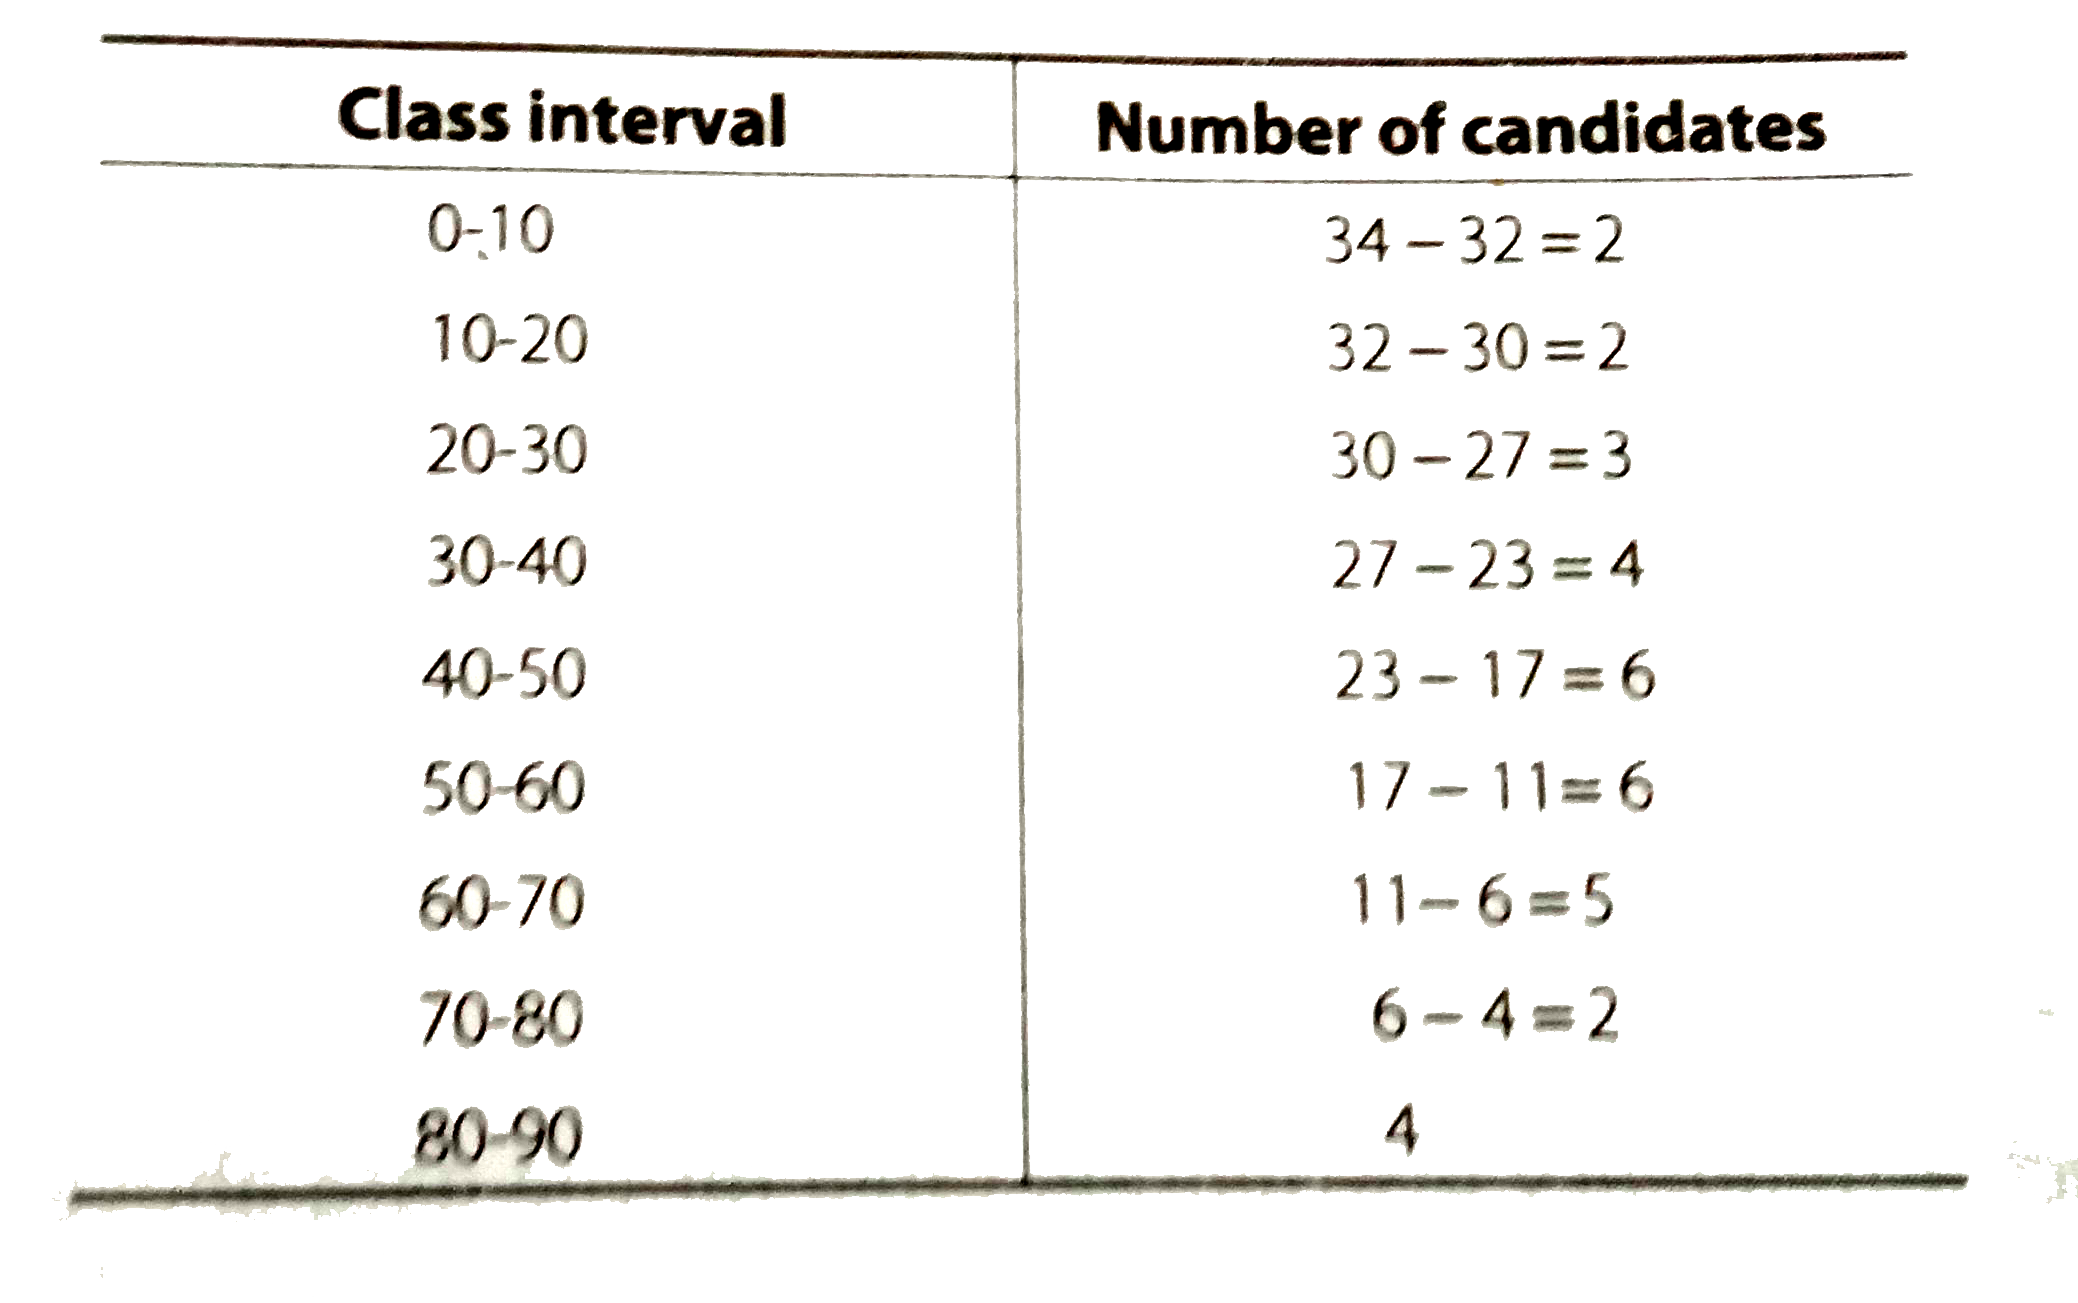
Herem we observe that, all 34 students have scored marks more than or equal to 0. Since, 32 students have scored marks more than or equal to 10. So, 34-32=2 students lies in the interval 0-10 and so on. Now, we construct the frequency distribution table.
Topper's Solved these Questions
- STATISTICS AND PROBABILITYBOOK - NCERT EXEMPLAR ENGLISHCHAPTER - STATISTICS AND PROBABILITYEXERCISE - LONG ASWERS QUESTIONS
14 Videos
- STATISTICS AND PROBABILITYBOOK - NCERT EXEMPLAR ENGLISHCHAPTER - STATISTICS AND PROBABILITYEXERCISE - VERY SHORT ANSWERS QUESTIONS
14 Videos
- REAL NUMBERSBOOK - NCERT EXEMPLAR ENGLISHCHAPTER - REAL NUMBERSEXERCISE - LONG ANSWER TYPE QUESTIONS
5 Videos
- SURFACE AREAS AND VOLUMESBOOK - NCERT EXEMPLAR ENGLISHCHAPTER - SURFACE AREAS AND VOLUMESEXERCISE - LONG ANSWER TYPE QUESTIONS
20 Videos
Similar Questions
Construct the frequency distribution table from the following cumulative frequency table :
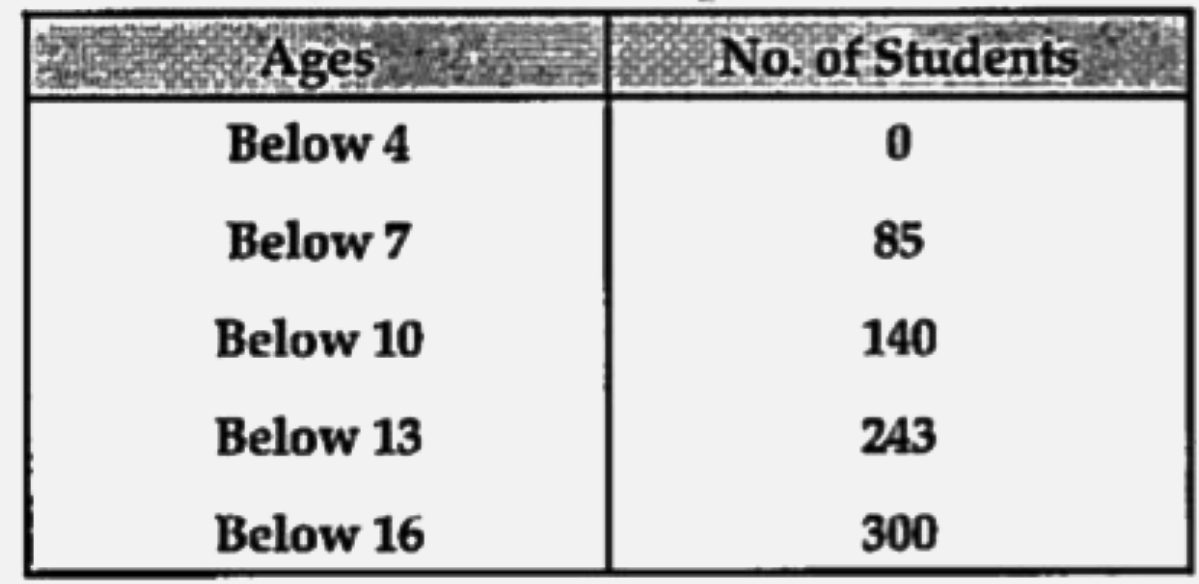
State the number of students in the age group 10 - 13.
View SolutionConstruct the frequency distribution table from the following cumulative frequency table :
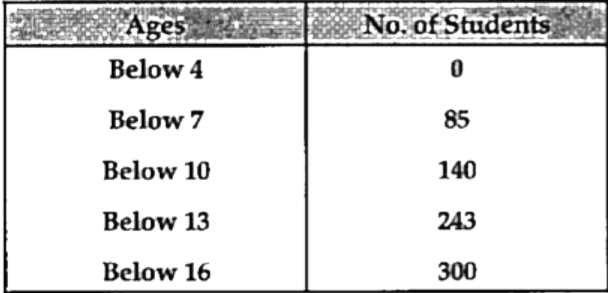
State the age - group which has the least number of students .
View SolutionConstruct the frequency distribution table from the following cumulative frequency table:
AgesNo of studentsBelow40Below785Below10140Below13243Below16300
State the age group which has the least number of students
View SolutionConstruct the frequency distribution table from the following cumulative frequency table:
AgesNo of StudentsBelow40Below785Below10140Below13243Below16300
State the number of students in the age group 10-13
View SolutionConstruct a frequency distribution table from the following cumulative frequency distribution :
Calss IntervalFrequency5−101810−153015−204620−257325−3090
View SolutionConstruct a frequency distribution table from the following cumulative frequency distribution :
Calss IntervalCumulative Frequency10−19820−291930−392340−4930
View SolutionConstruct a frequency distributions table from the following cumulatvive frequency table.
Class interval Cumulative Frequency 0−91510−192320−293830−395640−496850−5990
View SolutionContruct a cumulative frequency distributions table from the following frequency table:
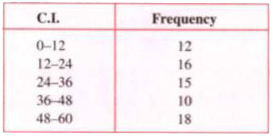
View SolutionContruct a cumulative frequency distributions table from the following frequency table:
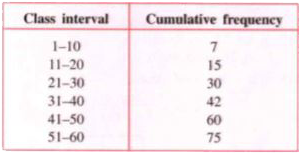
View SolutionPrepare a continuous grouped frequency distribution from the following data
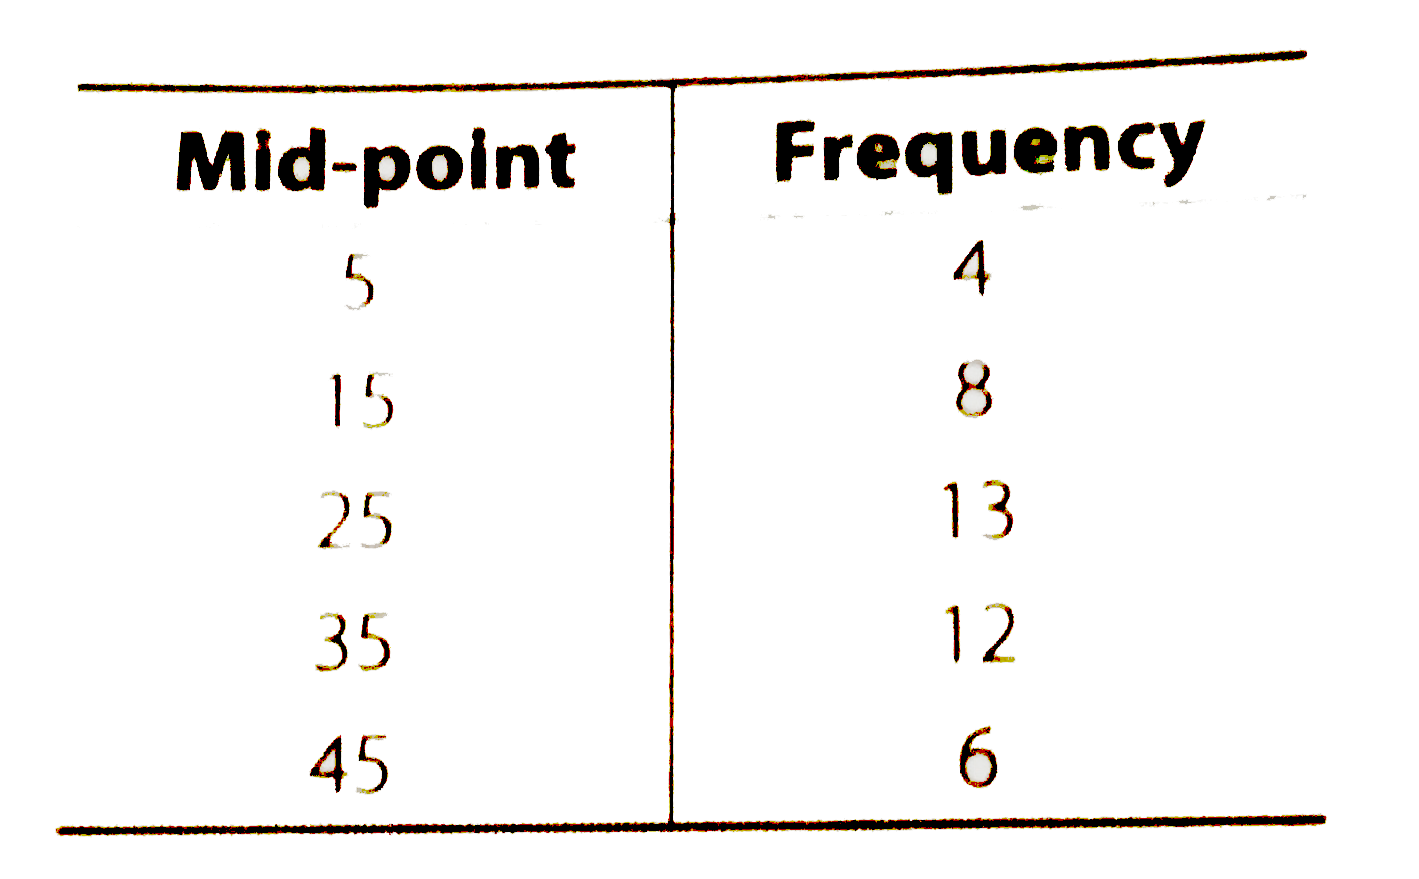
Also, find the size of class intervals.
View Solution
