Given below is a cumulative frequency distribution table showing the ages of people living in a locality: Age in years No. of persons Above 108 Above 96 Above 84 Above 72 Above 60 Above 48 Above 36 Above 24 Above 12 Above 0 0 1 3 5 20 158 427 809 1026 1024 Prepare a frequency distribution table
We make class intervals 0−12,12−24,24−36,36−48,48−60,60−72,72−84,84−96and96−108.
The frequency of the classes are
0−12 is 1026−1124=98, 12−24 is 1026−809=217, 24−36 is 809−427=382, 36−48 is 427−158=269, 48−60 is 158−20=138 , 60−72 is 20−5=15, 72−84 is 5−3=2
84−96 is 3−1=2, 96−108 is 1−0=1
Here is the cumulative frequency distribution table.

Topper's Solved these Questions
Similar Questions
Knowledge Check
If sum of x observations is 216 and their mean is 27. Then the number of observations is:
A7B8C9D10
Form the frequency distribution table from the following data:
Construct the frequency distribution table for the above data.
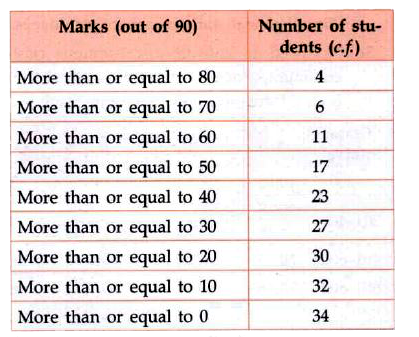
View SolutionConsider the following grouped frequency distribution :
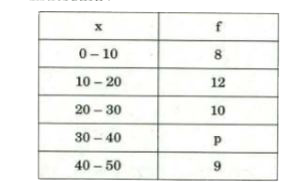
If the mean of the above data is 25·2, then what is the value of p?
View SolutionThe following table show tha cumulative frequency distribution of marks of 800 students in an examination.
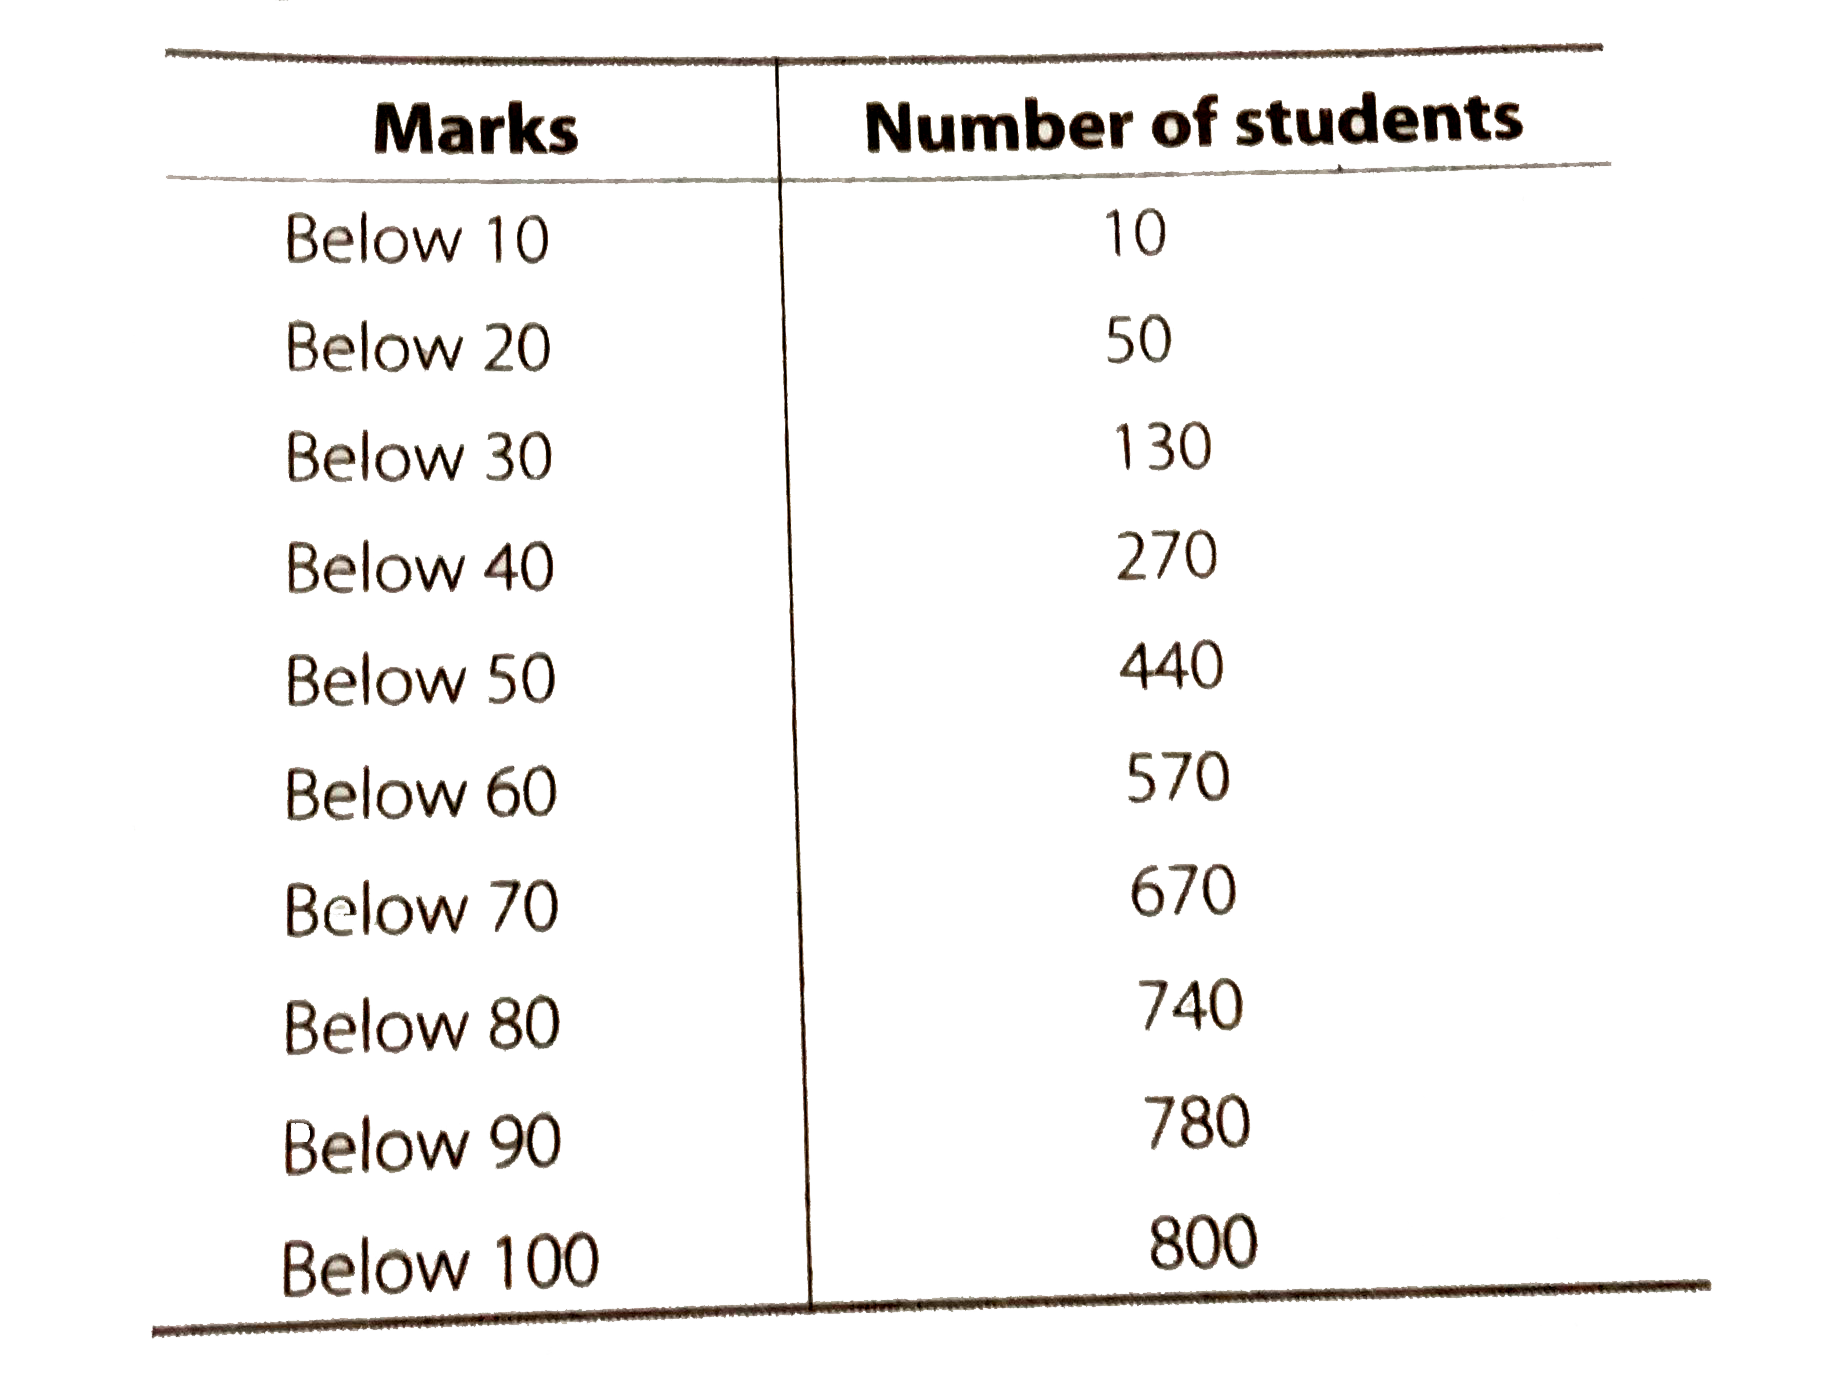
Construct a frequency distribution table for the data above.
View SolutionGiven below is the frequency distribution of driving speeds (in km/hour) of the vehicles of 400 college students:
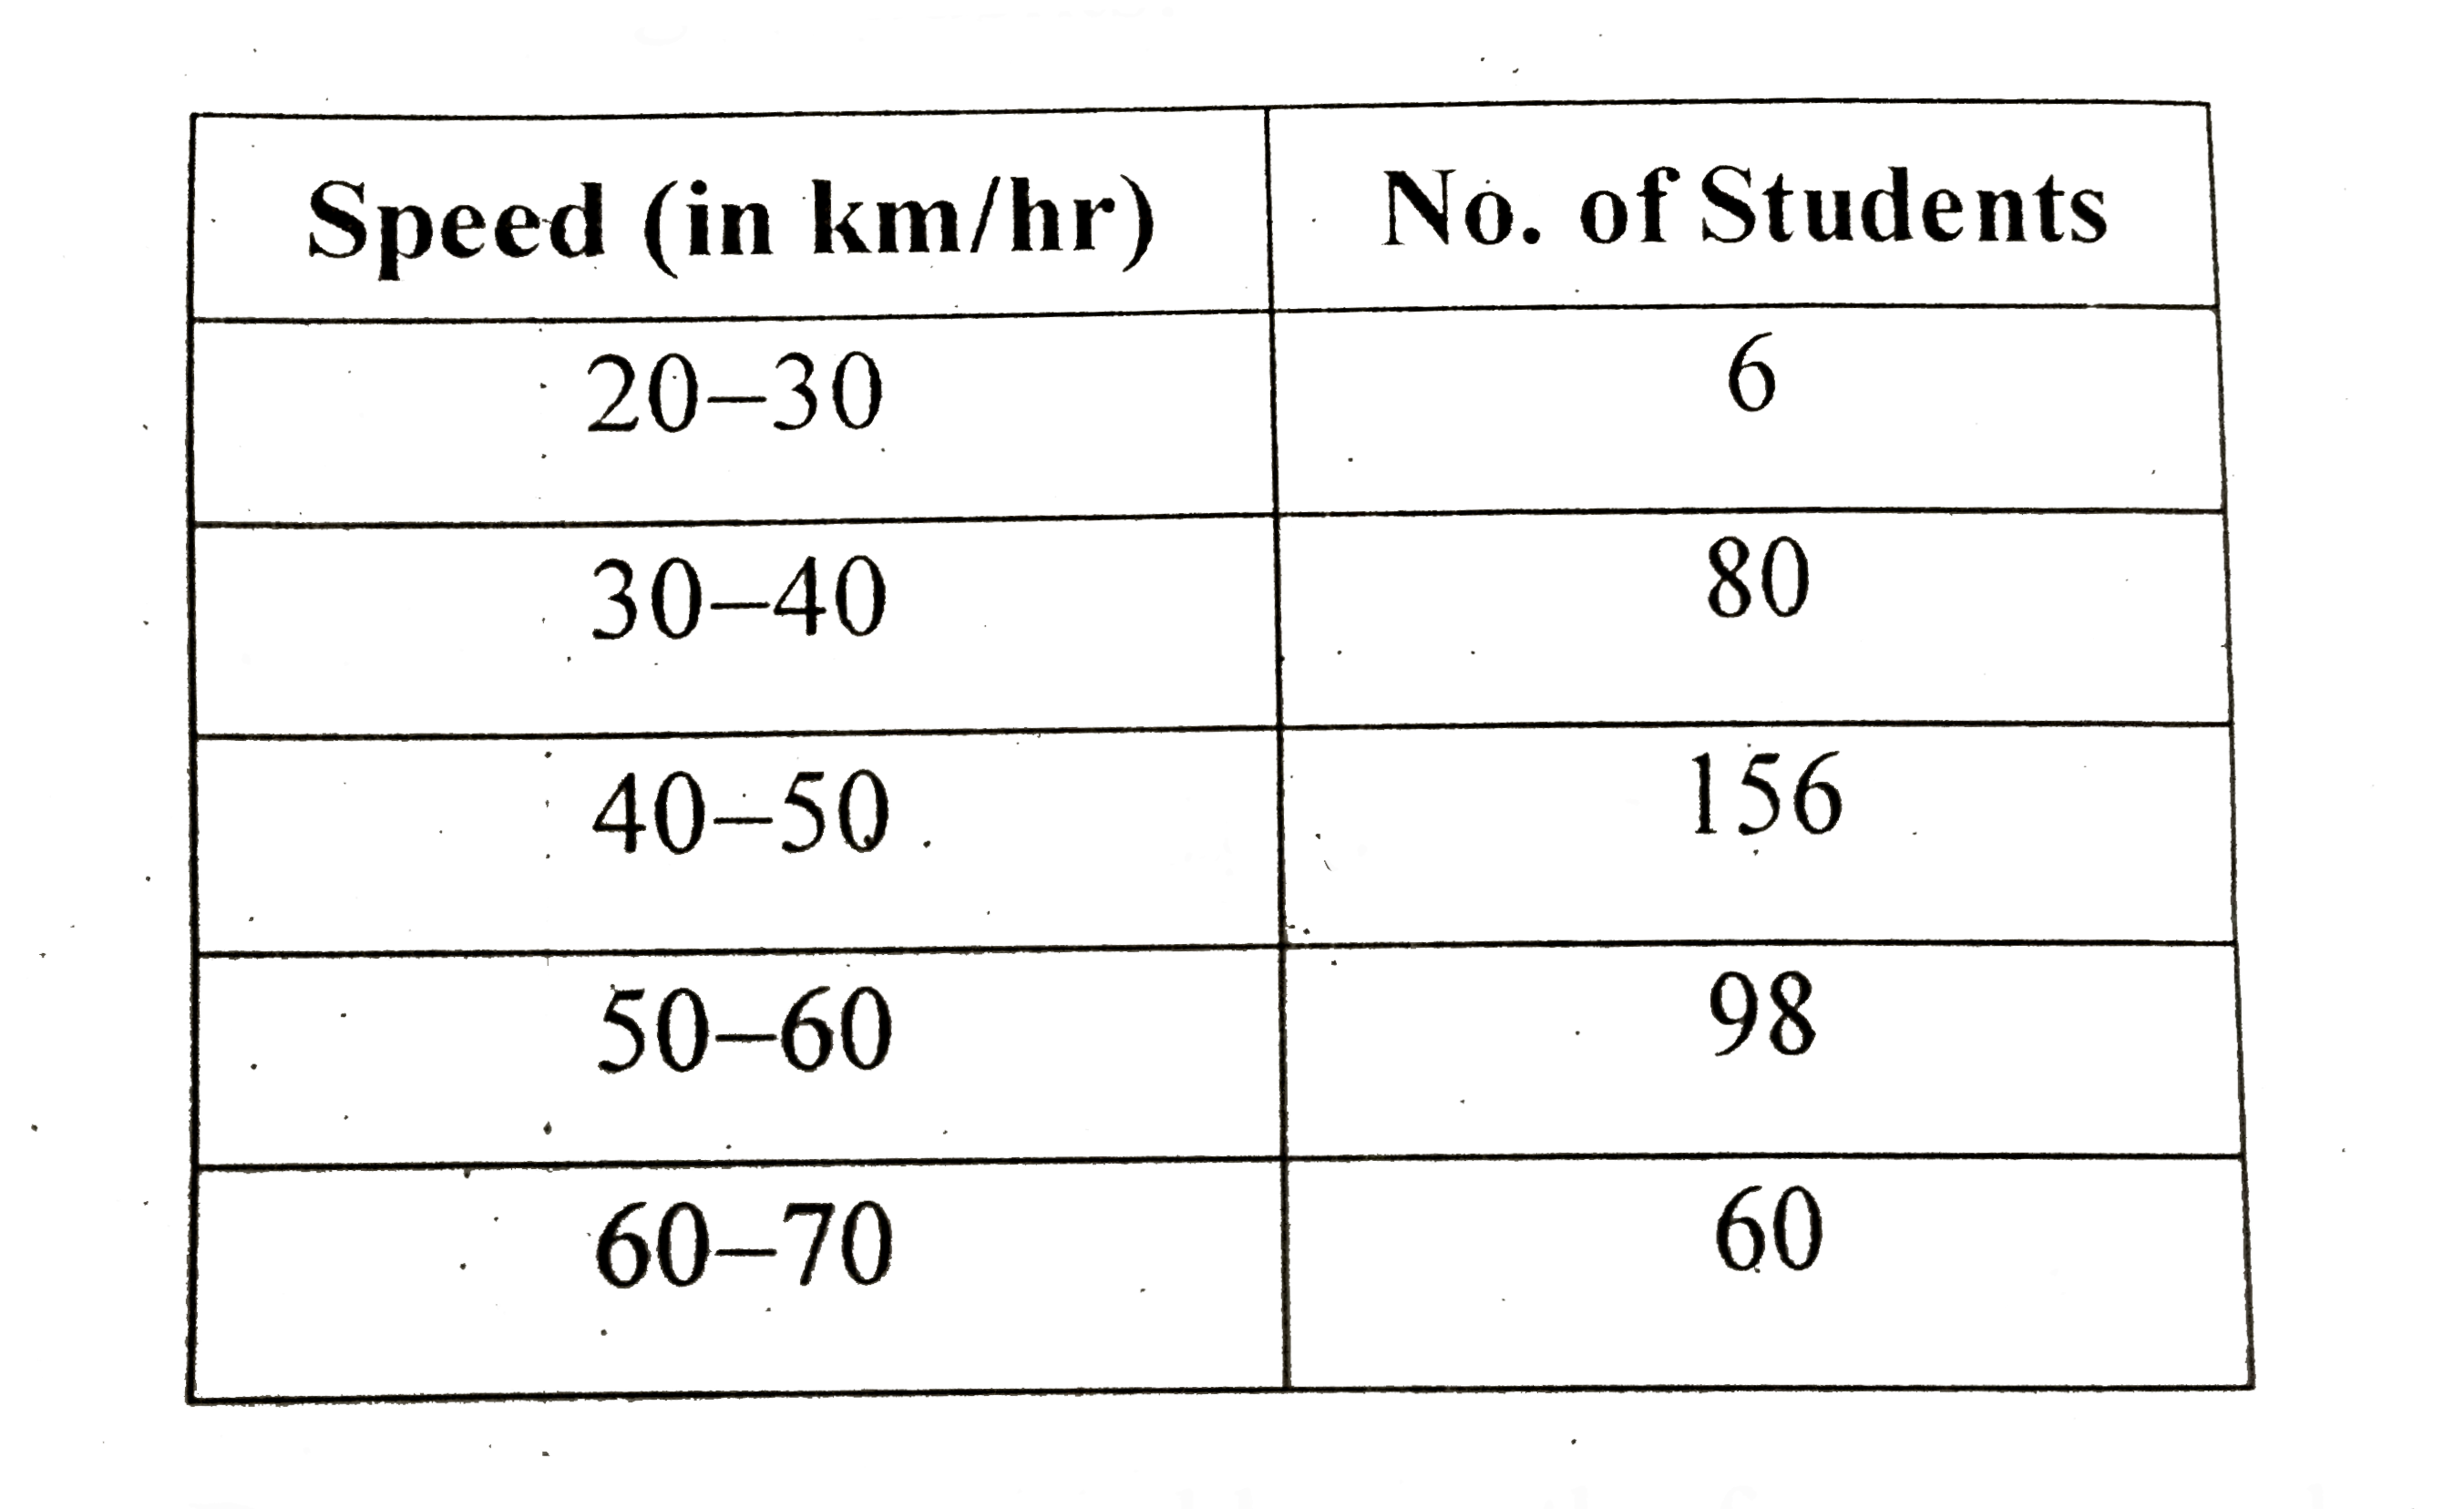
Draw Histogram and hence the frequency polygon for the above data.
View SolutionThe following frequency distribution table shows marks obtained by 180 students in Mathematics examination :
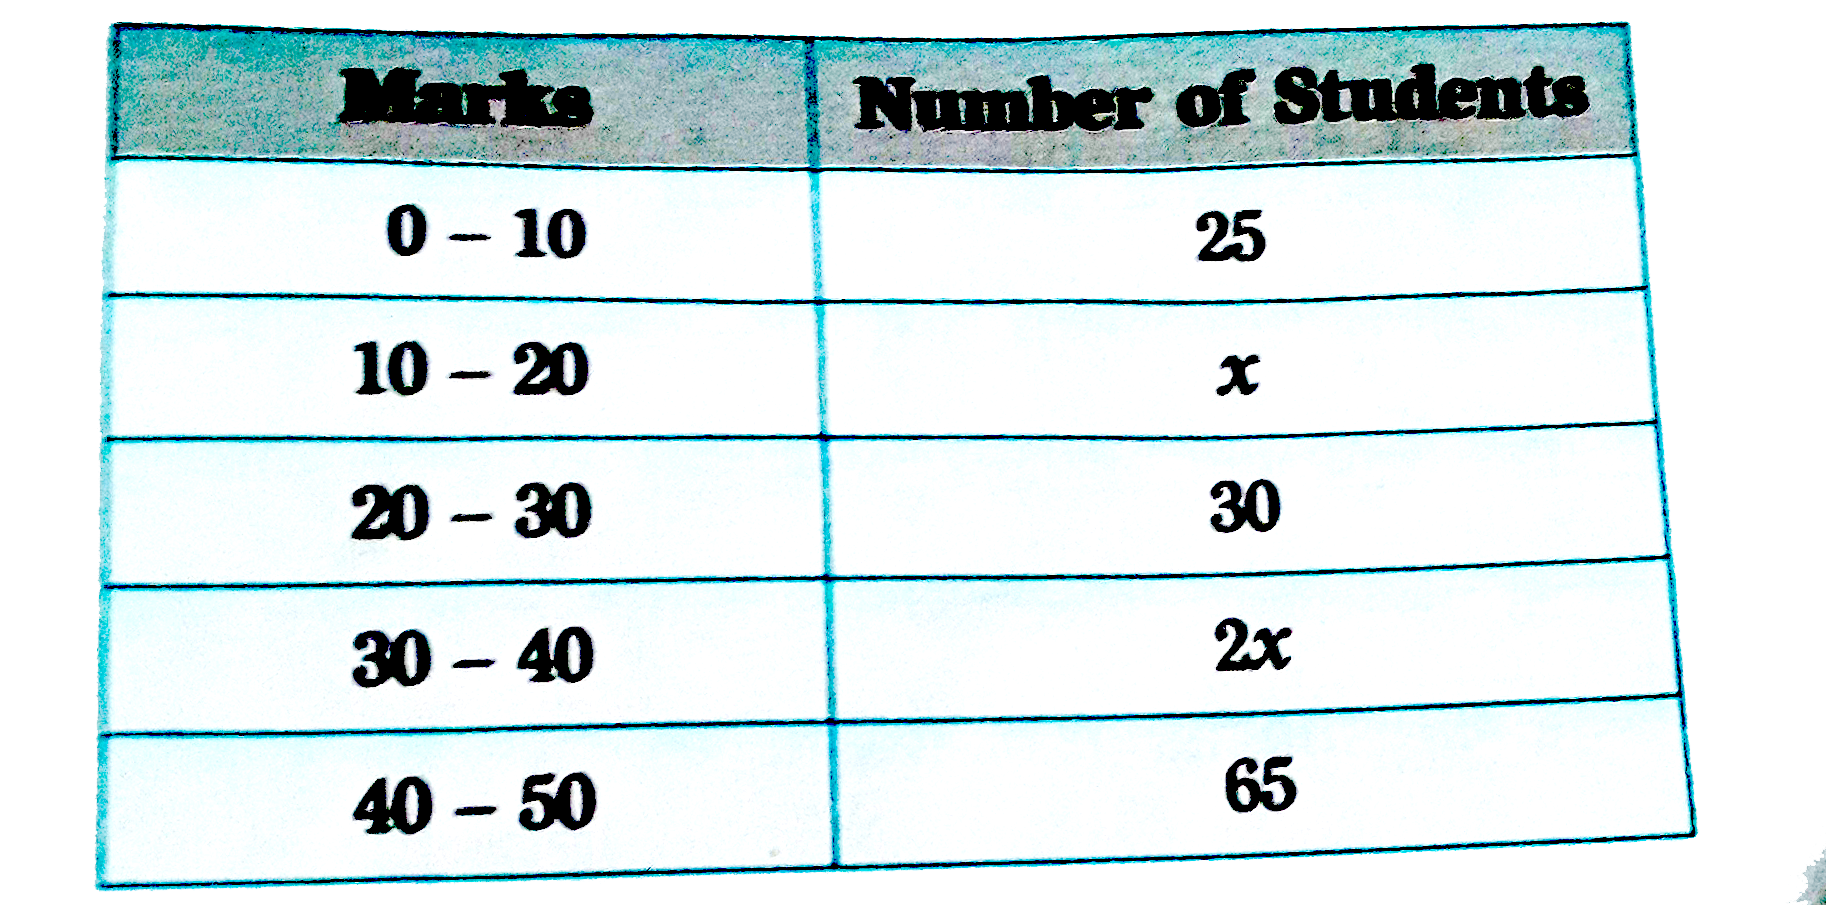
Find the value of x.
Also draw a histogram representing the above informations.
View SolutionFind mode of the following frequency distribution.

The mean of above distribution is 53. Empirical formula to find approximate value of median.
View SolutionThe construction of cummulative frequency table is useful in determining the
(i)Mean
(ii)Median
(iii)Mode
(iv)All of the above
View Solution


