In Figure, the pie-chart shows the marks
obtained by a student in an examination. If the student secures 440 marks in
all, calculate his marks in each of the given subjects.
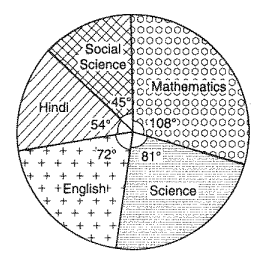
Step by step video & image solution for In Figure, the pie-chart shows the marks obtained by a student in an examination. If the student secures 440 marks in all, calculate his marks in each of the given subjects. by Maths experts to help you in doubts & scoring excellent marks in Class 8 exams.
Updated on:21/07/2023Topper's Solved these Questions
Similar Questions
Study the pie chart given below depicting the marks scored by a student in an examination out of 540. Find the marks obtained by him in each subject.
View SolutionThe table given below represents the marks obtained by 5 students in 4 different subjects. Each student was given marks out of 100 in each of the given subjects.

In which subject the total marks of all the students is highest ?
View Solution
Knowledge Check
The following pie chart shows the marks obtained by a student in an examination, who scored 720 marks in all. Study the diagram and answer the questions given below.
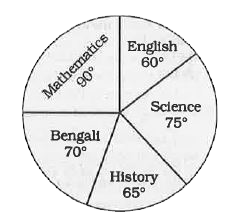
The following pie chart shows the marks obtained by a student in an examination, who scored 720 marks in all. Study the diagram and answer the questions given below.
The subject in which the student scored 180 marks isAMathematicsBBengaliCEnglishDScienceThe following pie chart shows the marks obtained by a student in an examination, who scored 720 marks in all. Study the diagram and answer the questions given below.
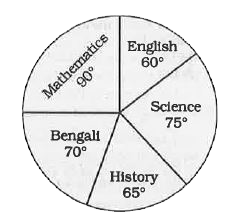
The subject in which the student scored 1623% of his total score isABengaliBHistoryCEnglishDMathematics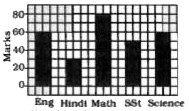
The above bar graph show the marks obtained by a students in an examination. What is the average marks obtained by the student ?A55B56C57D58
The given graph shows the marks obtained by students in an examination
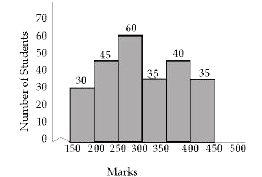
The number of students who obtained less than 300 marks is what percent more than the number of students who obtained 350 or more marks
View SolutionThe following pie chart shows the marks obtained by a student in an examination, who scored 720 marks in all. Study the diagram and answer the questions given below.
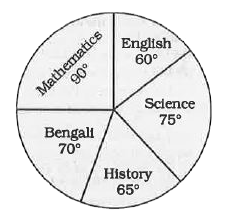
The following pie chart shows the marks obtained by a student in an examination, who scored 720 marks in all. Study the diagram and answer the questions given below.
The marks scored in Mathematics and English together differ from the total marks scored in Bengali, History and Science by
View SolutionThe following pie chart shows the marks obtained by a student in an examination, who scored 720 marks in all. Study the diagram and answer the questions given below.
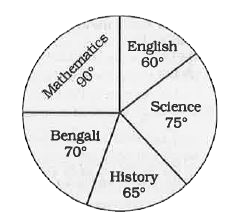
The following pie chart shows the marks obtained by a student in an examination, who scored 720 marks in all. Study the diagram and answer the questions given below.
The marks scored in English, differ from the marks scored in Science by
View SolutionGiven data shows marks of 32 students in an examination. Mean of the marks will be

View SolutionThe following pie chart shows the marks obtained by a student in an examination, who scored 720 marks in all. Study the diagram and answer the questions given below.
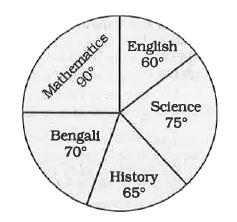
The marks scored in Science are
View Solution
