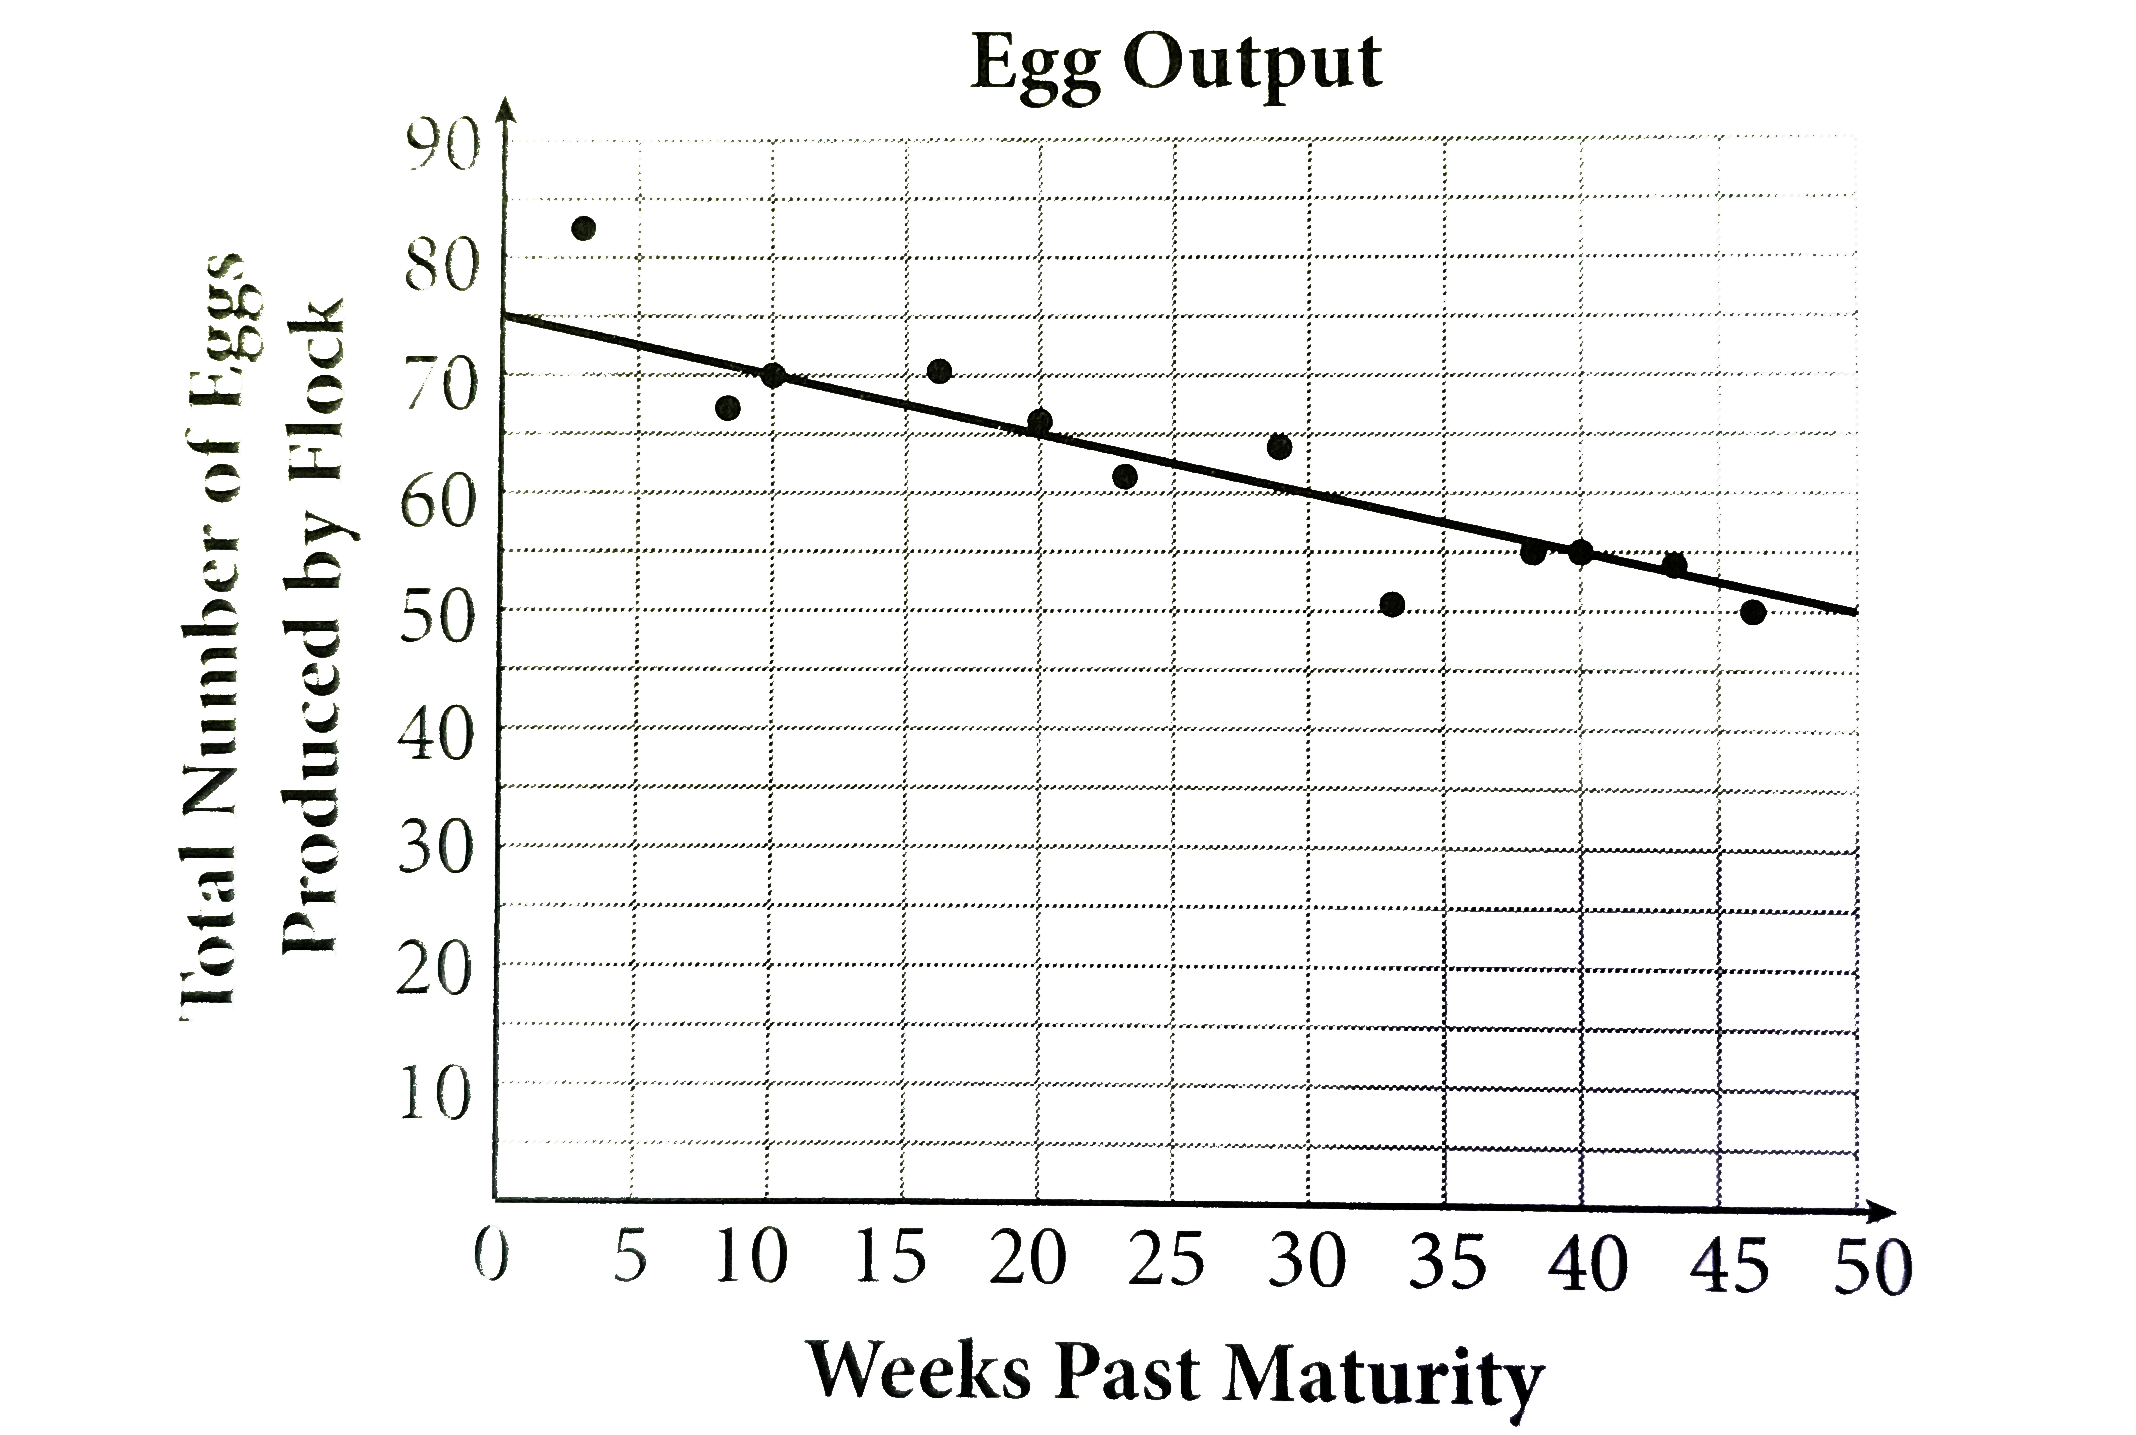
Most chickens reach maturity and begin laying eggs at around 20 weeks of age. From this point forward, however, as the chicken ages,its eges its egg production decreases. A farmer was given a flock of 100 chickens (all of which were the same age) and asked to meaure daily egg output for the entire flock at random intervals starting at maturity until the chickens were 70 weeks old. The data are recorded in the scatteplot below and the line of best fit has been drawn.

Based on the line of bast fit, what is the predicted number of eggs that will be produced by the flock when it is 33 weeks past maturity ?
33
50
58
64
The correct Answer is:C
In this case, you merely need to match the y-value on the line of best fit with the x-value of 33, since the x-axis of the graph represents the number of weeks after maturity. Take carer to use the line of best fit rather than an individual point on the graph, (B) is a trap answer. At x=33, the y-value of the line of best fit seems to be just shy of 60. Thus, (C ) is correct.
Topper's Solved these Questions
- SCATTERPLOTSBOOK - KAPLANCHAPTER - SCATTERPLOTSEXERCISE - LINE OF BEST FIT
1 Videos
- SCATTERPLOTSBOOK - KAPLANCHAPTER - SCATTERPLOTSEXERCISE - SCATTERPLOT MODELING
1 Videos
- SCATTERPLOTSBOOK - KAPLANCHAPTER - SCATTERPLOTSEXERCISE - SCATTERPLOT MODELING
1 Videos
- SAT MATH: TIMING ANS SECTION MANAGEMENT STRATEGIESBOOK - KAPLANCHAPTER - SAT MATH: TIMING ANS SECTION MANAGEMENT STRATEGIESEXERCISE - TRY ON YOU OWN
5 Videos
- SYSTEMS OF LINEAR EQUATIONSBOOK - KAPLANCHAPTER - SYSTEMS OF LINEAR EQUATIONSEXERCISE - NUMBER OF POSSIBLE SOLUTIONS
1 Videos
Similar Questions
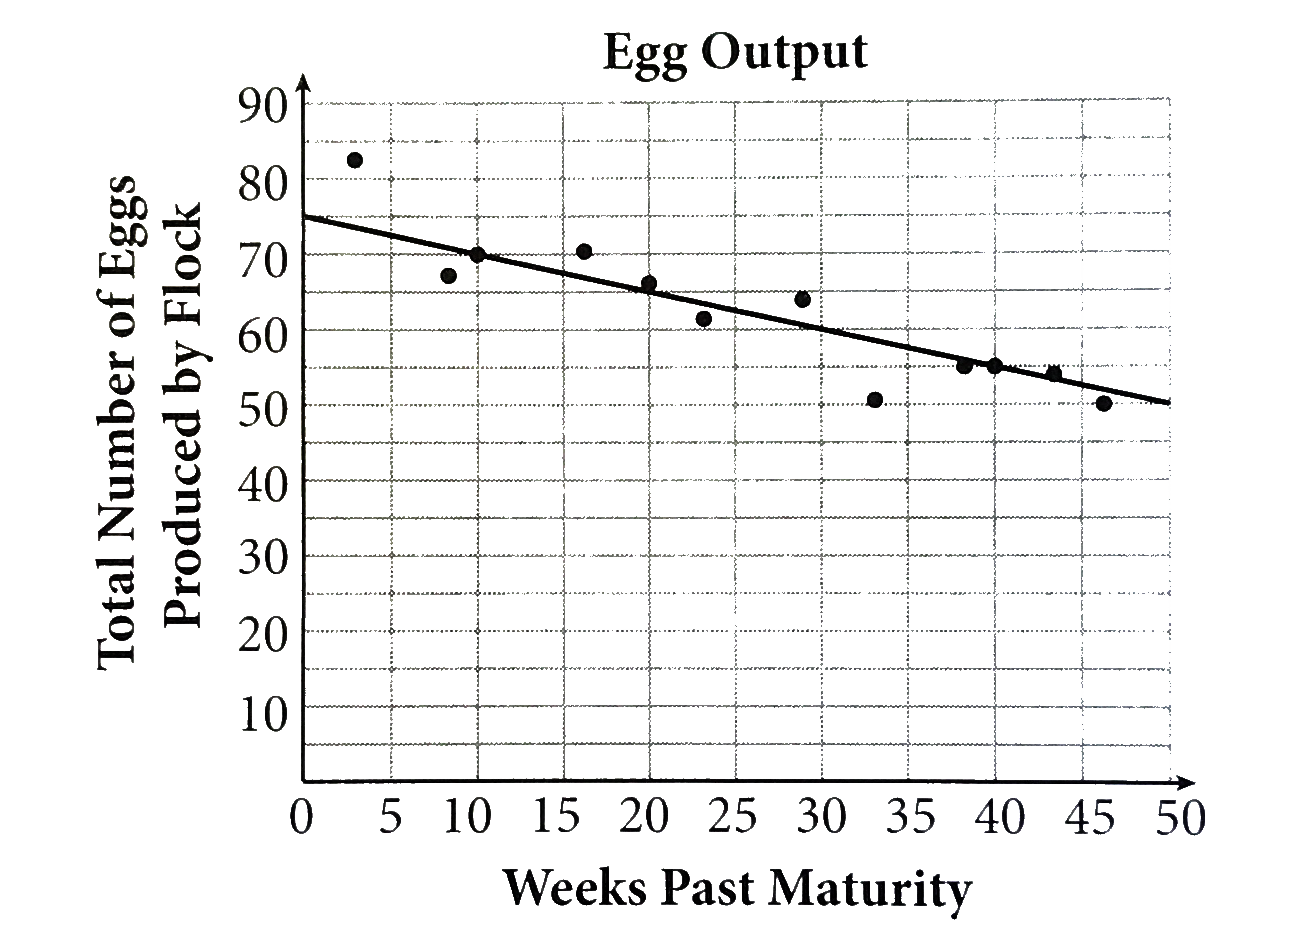
Most chickens reach maturity and begin laying eggs at around 20 weeks of age. From this point forward, however, as the chicken ages,its eges its egg production decreases. A farmer was given a flock of 100 chickens (all of which were the same age) and asked to meaure daily egg output for the entire flock at random intervals starting at maturity until the chickens were 70 weeks old. The data are recorded in the scatteplot below and the line of best fit has been drawn.

How many times did the farmer's data differ by more than 5 eggs from the number of eggs predicted by the line of best fit ?
View SolutionA mammal which lays eggs is
View SolutionThe young chicken raised specially for meat are called.
View SolutionIn Yucca the pollinator deposits its eggs
View SolutionThe offspring of two creeper chicken are
View SolutionChicken pox is caused by
View SolutionChicken pox is caused by
View SolutionTwo bad eggs are accidently mixed up with ten good ones. Three eggs are drawn at random with replacement from this lot. compute the mean for the number of bad eggs drawn.
View SolutionThe ratio of the sale of eggs on a Sunday to that of the whole week of a grocery shop was 2:9. If the total sale of eggs in the same week was Rs. 360, find the sale of eggs on Sunday.
View SolutionApproximate age of sexual maturity in human beings is
View Solution
