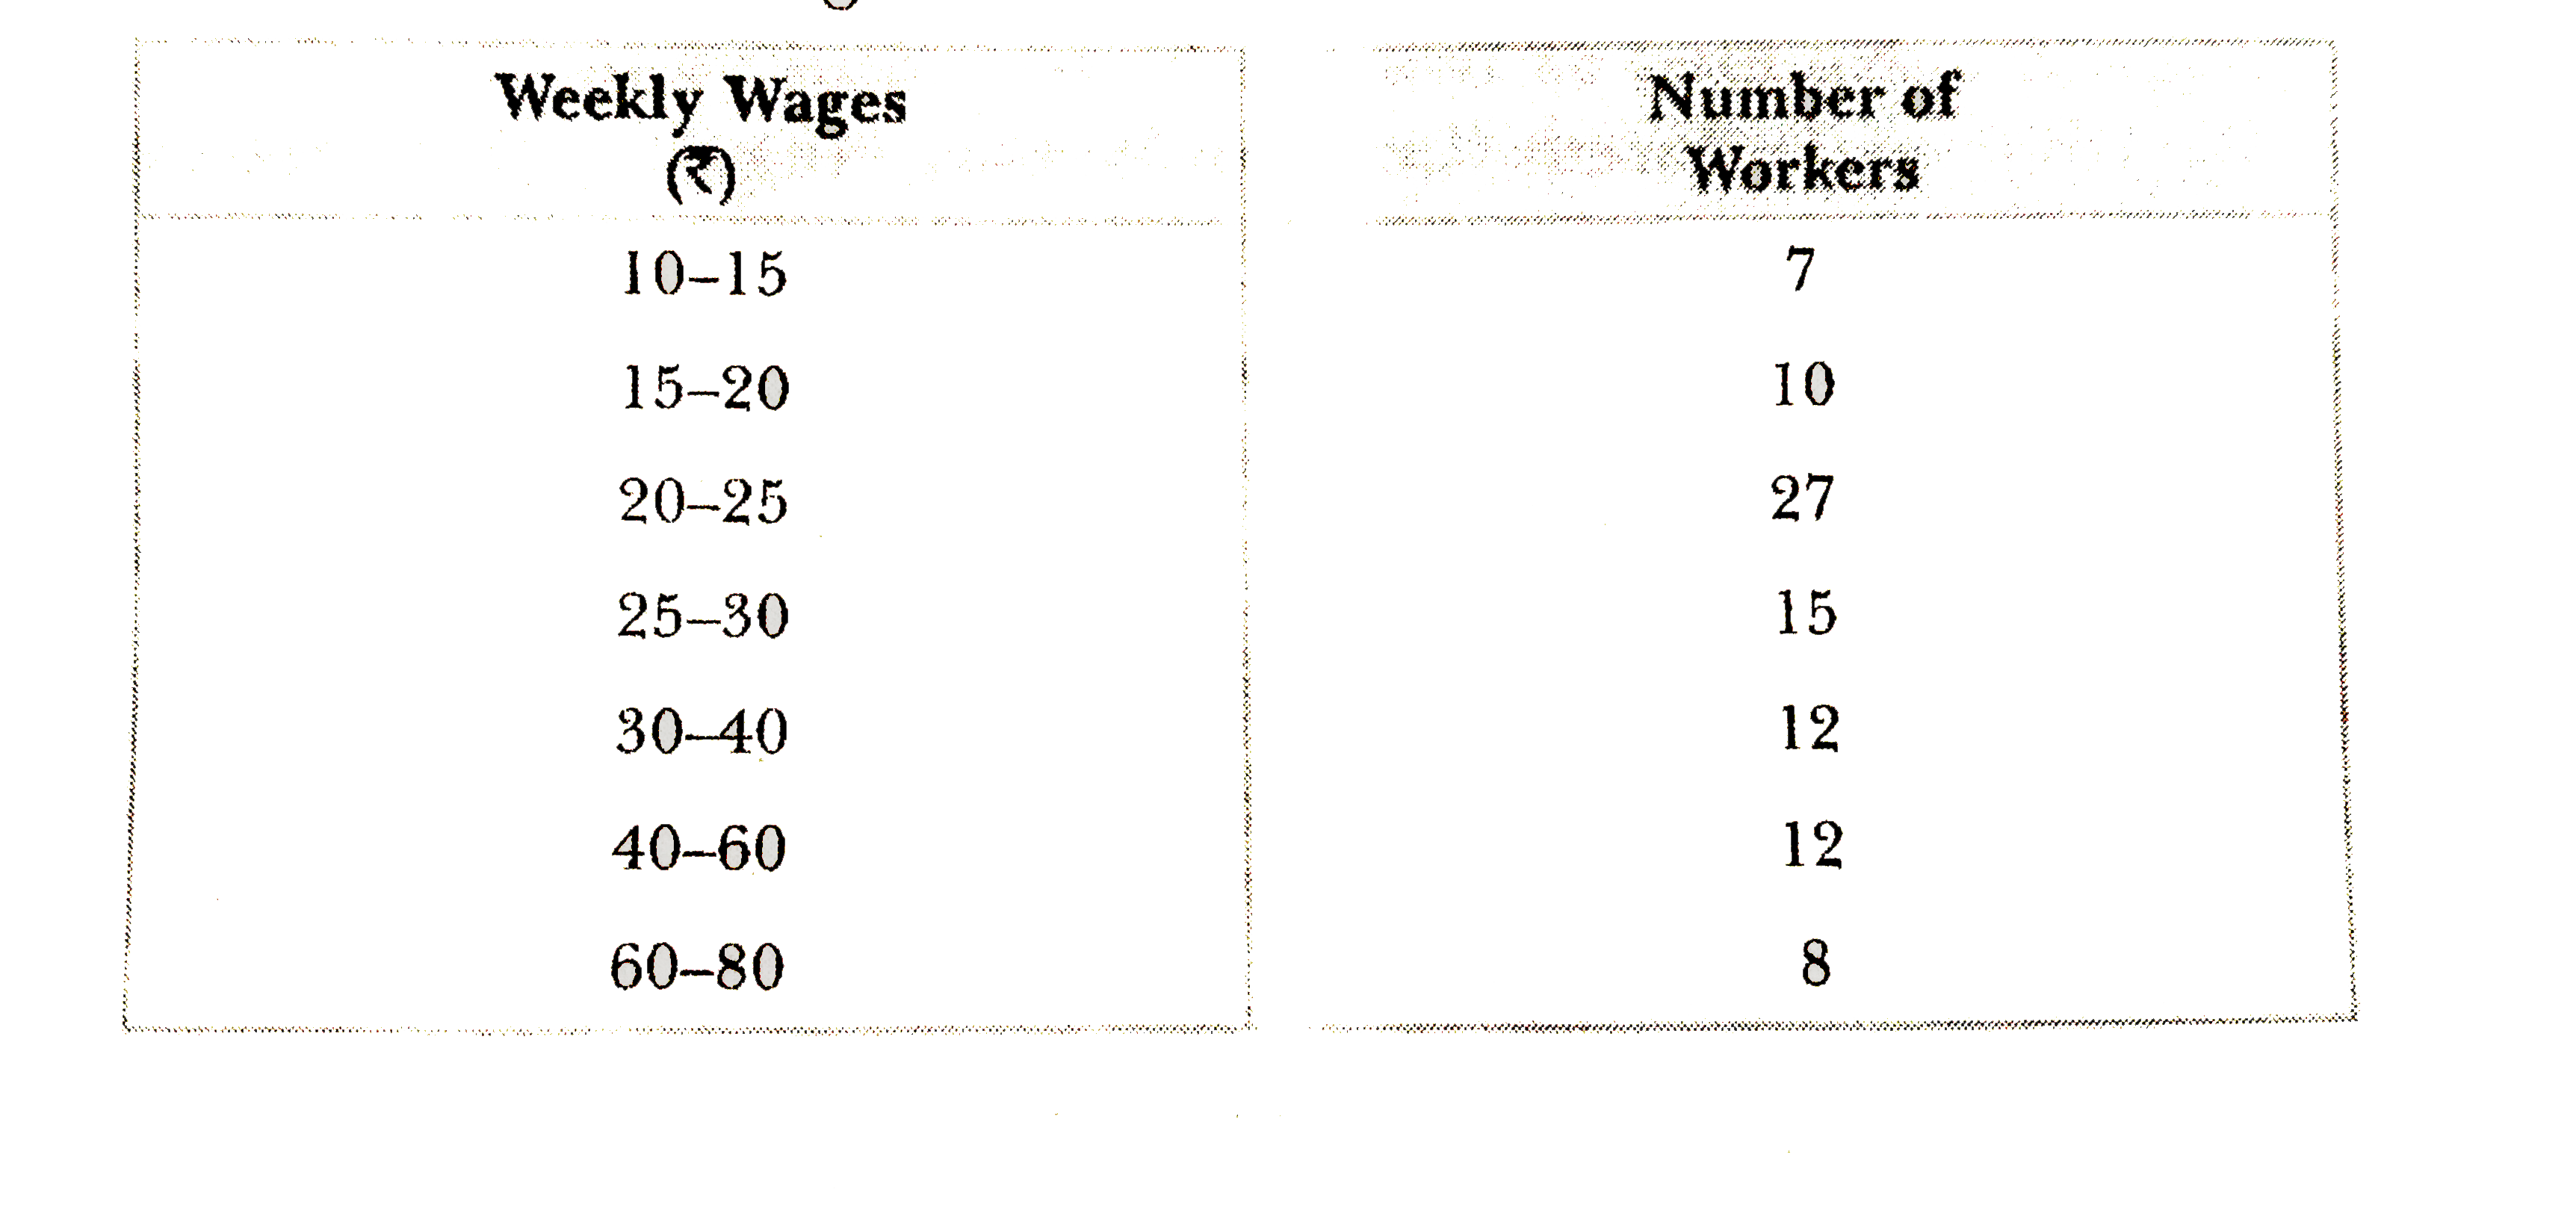
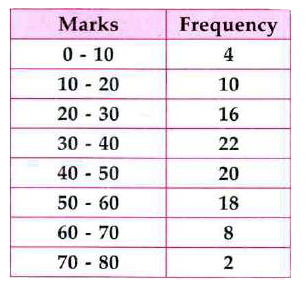
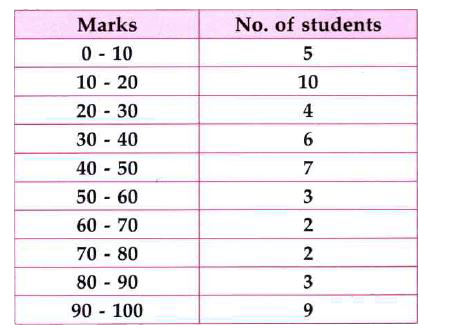
Represent the following data using a histogram.

Step by step video & image solution for Represent the following data using a histogram. by Maths experts to help you in doubts & scoring excellent marks in Class 10 exams.
Topper's Solved these Questions
- BOOK - NAVNEET PUBLICATION - MAHARASHTRA BOARDCHAPTER - STATISTICSEXERCISE - EXAMPLES3videos
STATISTICS
- BOOK - NAVNEET PUBLICATION - MAHARASHTRA BOARDCHAPTER - STATISTICSEXERCISE - MISCELLANEOUS24videos
STATISTICS
- BOOK - NAVNEET PUBLICATION - MAHARASHTRA BOARDCHAPTER - STATISTICSEXERCISE - Assignment 6.34videos
STATISTICS
- BOOK - NAVNEET PUBLICATION - MAHARASHTRA BOARDCHAPTER - SIMILARITYEXERCISE - SUBJECTIVE TYPE20videos
SIMILARITY
- BOOK - NAVNEET PUBLICATION - MAHARASHTRA BOARDCHAPTER - THEOREMS EXERCISE - CIRCLE15videos
THEOREMS
Similar Questions
Represent the following data by histogram:
 View Solution
Represent the following data, using a percentage bar diagram :
 View Solution
Draw a frequency polygon from the following data by using (i) histogram , and (ii) without using histogram :
 View Solution
Present the following data in the form of a histogram :
 View Solution
Present the following data in the form of a histogram :
 View Solution
Draw a histogram to represent the following data.
 View Solution
The following table gives the marks scored by 100 students in an entrance examination

Represent this data in the form of a histogram.View SolutionFor the following data, draw a histogram and a frequency polygon
 View Solution
The marks obtained by 60 students of a class in a methematics test are given

Represent the above data by means of a histogram.View SolutionThe following table shows the number of illitrate persons in the age group (10-58 Years) in a town. Represents the given data by means of a histogram.
 View Solution

