Scientists plotted data for two animal populations on a scatterplot: population A, which they graphed along the x-axis, and population B, which they graphed along the y-axis. The data showed a strong negative correlation. Which of the following statements is justified ?
The rise in population A caused the decline in population B.
The decline in population B caused the rise in population A.
Because the correlation is negative, there cannot be causation between the two populations.
The rise in populatin A is correlated to the decline in population B, but causation is unknown.
The correct Answer is:D
The fact that the two variables are strongly correlated, whether it be negatively or positively, shows only that there is a relationship between the variables. It does not indicate whether the change in one variable caused the change in the other. For example, p[opulation A might thrive in wet climates, while population B does not, and in the years studied, rainfall may have increased, which caused the changes in the populations. Eliminate (A) and (B). Conversely, the negative correlation does not discount the possibility of causation, rather, the data does not allow you to draw a conclusion about causation, so eliminate (C ). This means (D) is the correct answer.
Topper's Solved these Questions
- SCATTERPLOTSBOOK - KAPLANCHAPTER - SCATTERPLOTSEXERCISE - LINE OF BEST FIT
1 Videos
- SCATTERPLOTSBOOK - KAPLANCHAPTER - SCATTERPLOTSEXERCISE - SCATTERPLOT MODELING
1 Videos
- SCATTERPLOTSBOOK - KAPLANCHAPTER - SCATTERPLOTSEXERCISE - SCATTERPLOT MODELING
1 Videos
- SAT MATH: TIMING ANS SECTION MANAGEMENT STRATEGIESBOOK - KAPLANCHAPTER - SAT MATH: TIMING ANS SECTION MANAGEMENT STRATEGIESEXERCISE - TRY ON YOU OWN
5 Videos
- SYSTEMS OF LINEAR EQUATIONSBOOK - KAPLANCHAPTER - SYSTEMS OF LINEAR EQUATIONSEXERCISE - NUMBER OF POSSIBLE SOLUTIONS
1 Videos
Similar Questions
Knowledge Check
Suppose a scatterplot shows a weak negative linear coorelation. Which of the following statements is true ?
AThe slope of the lone of best fit will be a number less than -1.BThe slope of the lone of best fit will be a number between -1 and 0.CThe data points will follow, but not closely, the line of best fit, which has a negative slope.DThe data points will be closely gathered around the line of best, fit, which has a negative slope.Which of the following graphs best shows a strong negative association between d and t ?
A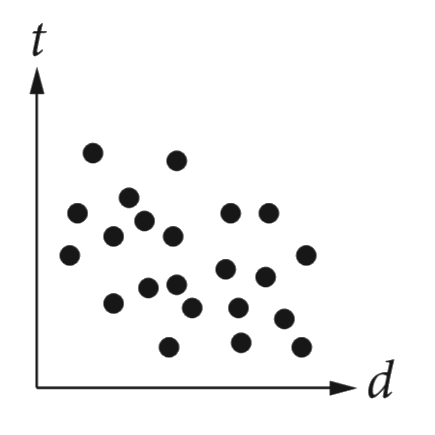 B
B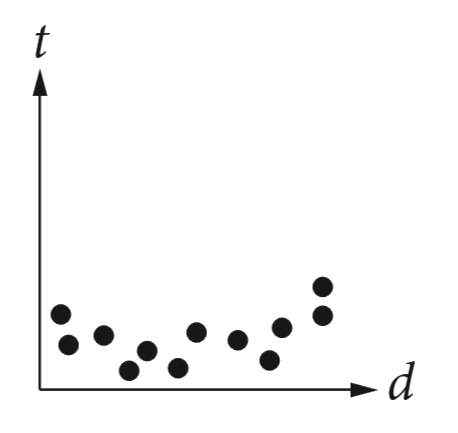 C
C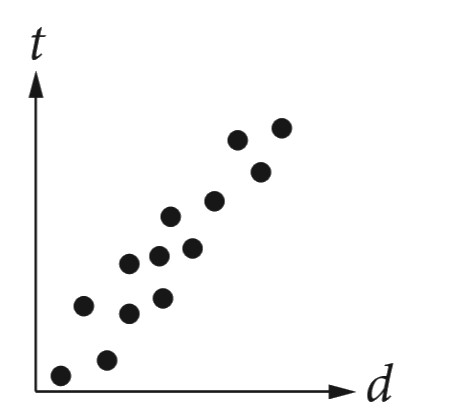 D
D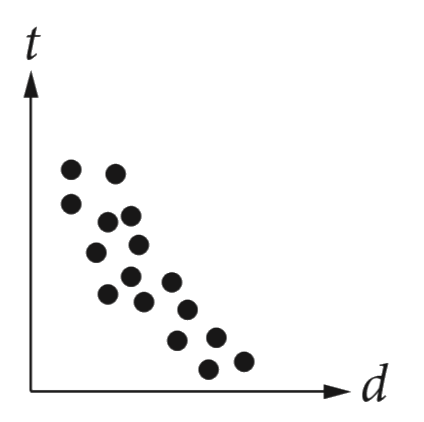
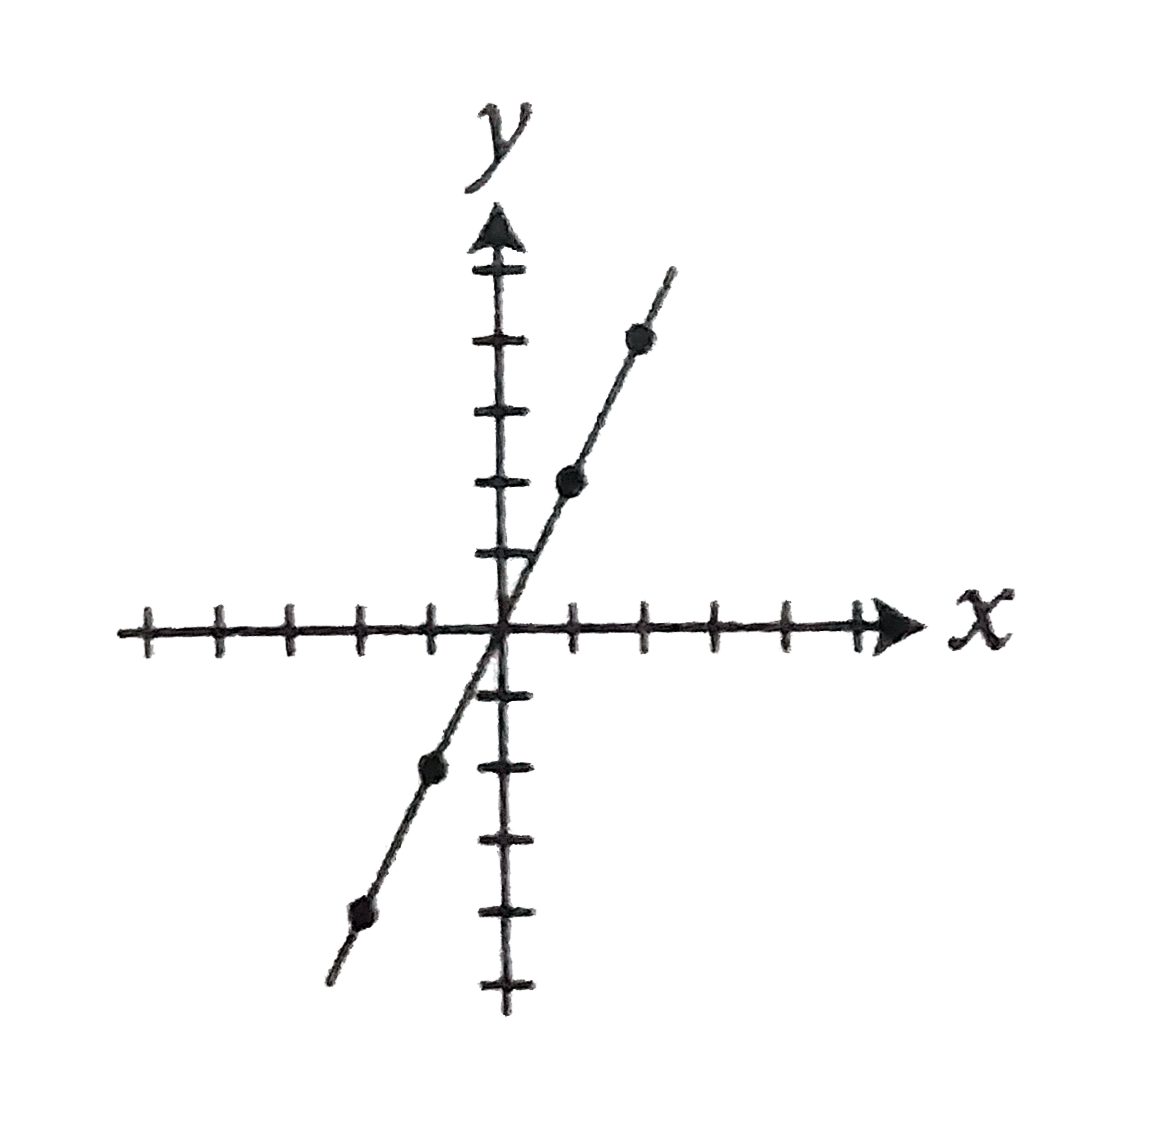
The graph above shows y=2x. Which of the following graphs represents y=|2x|?A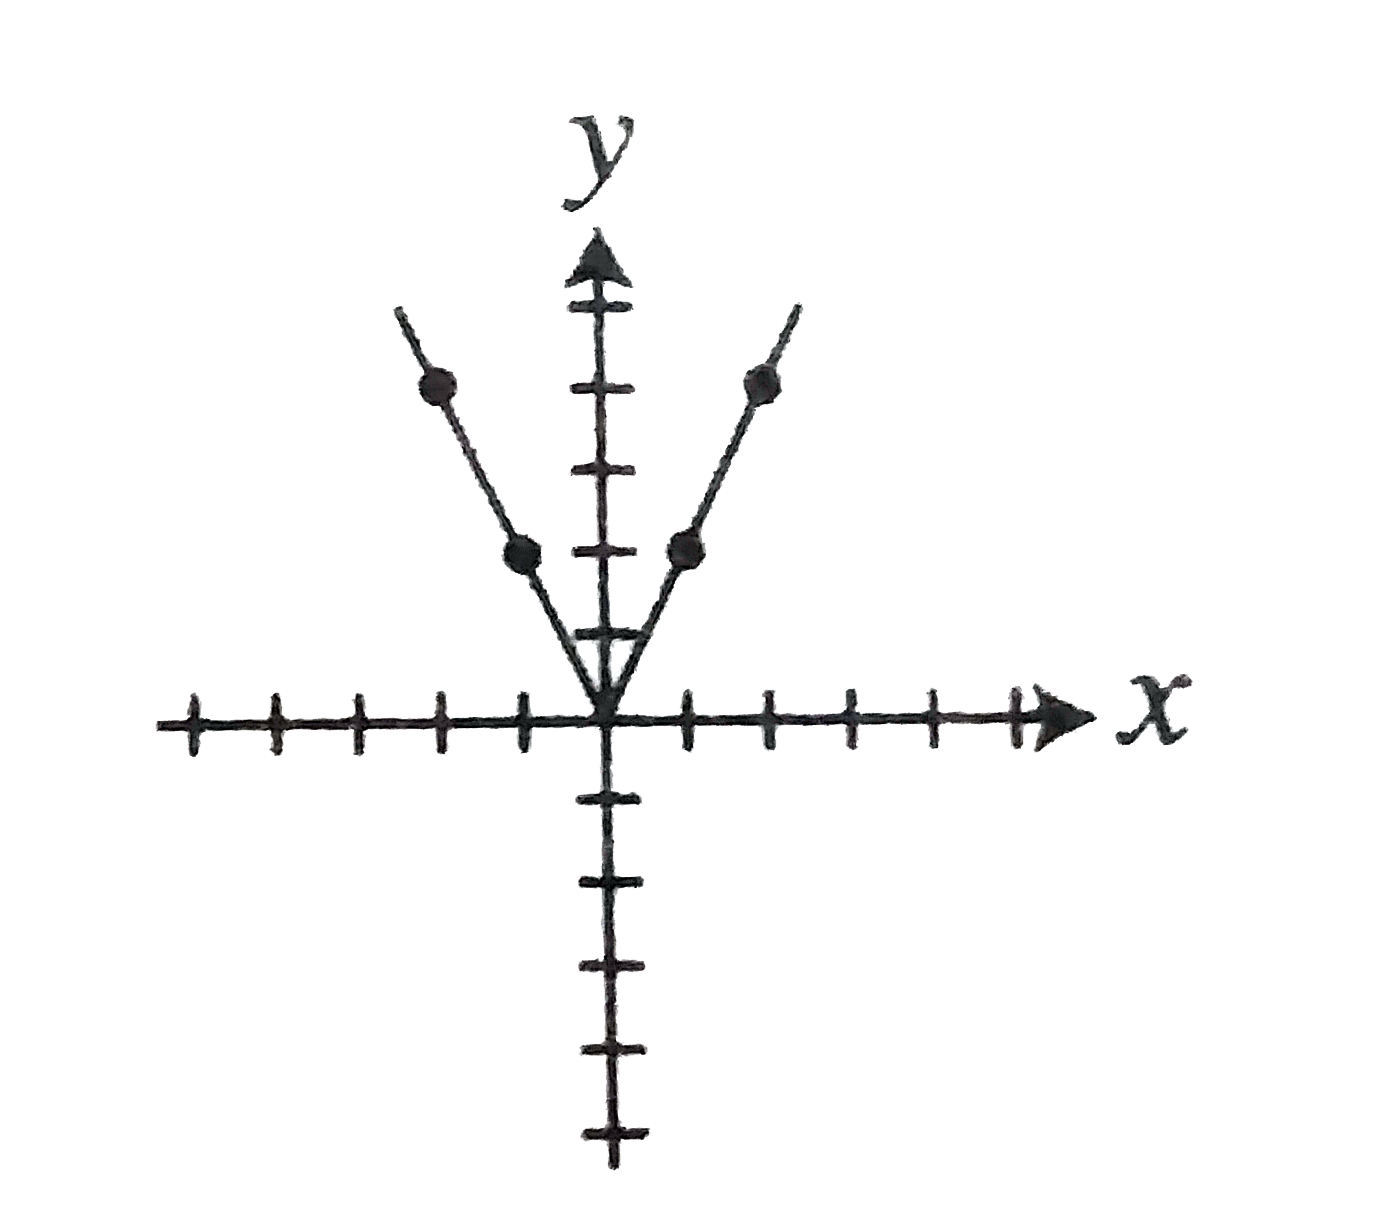 B
B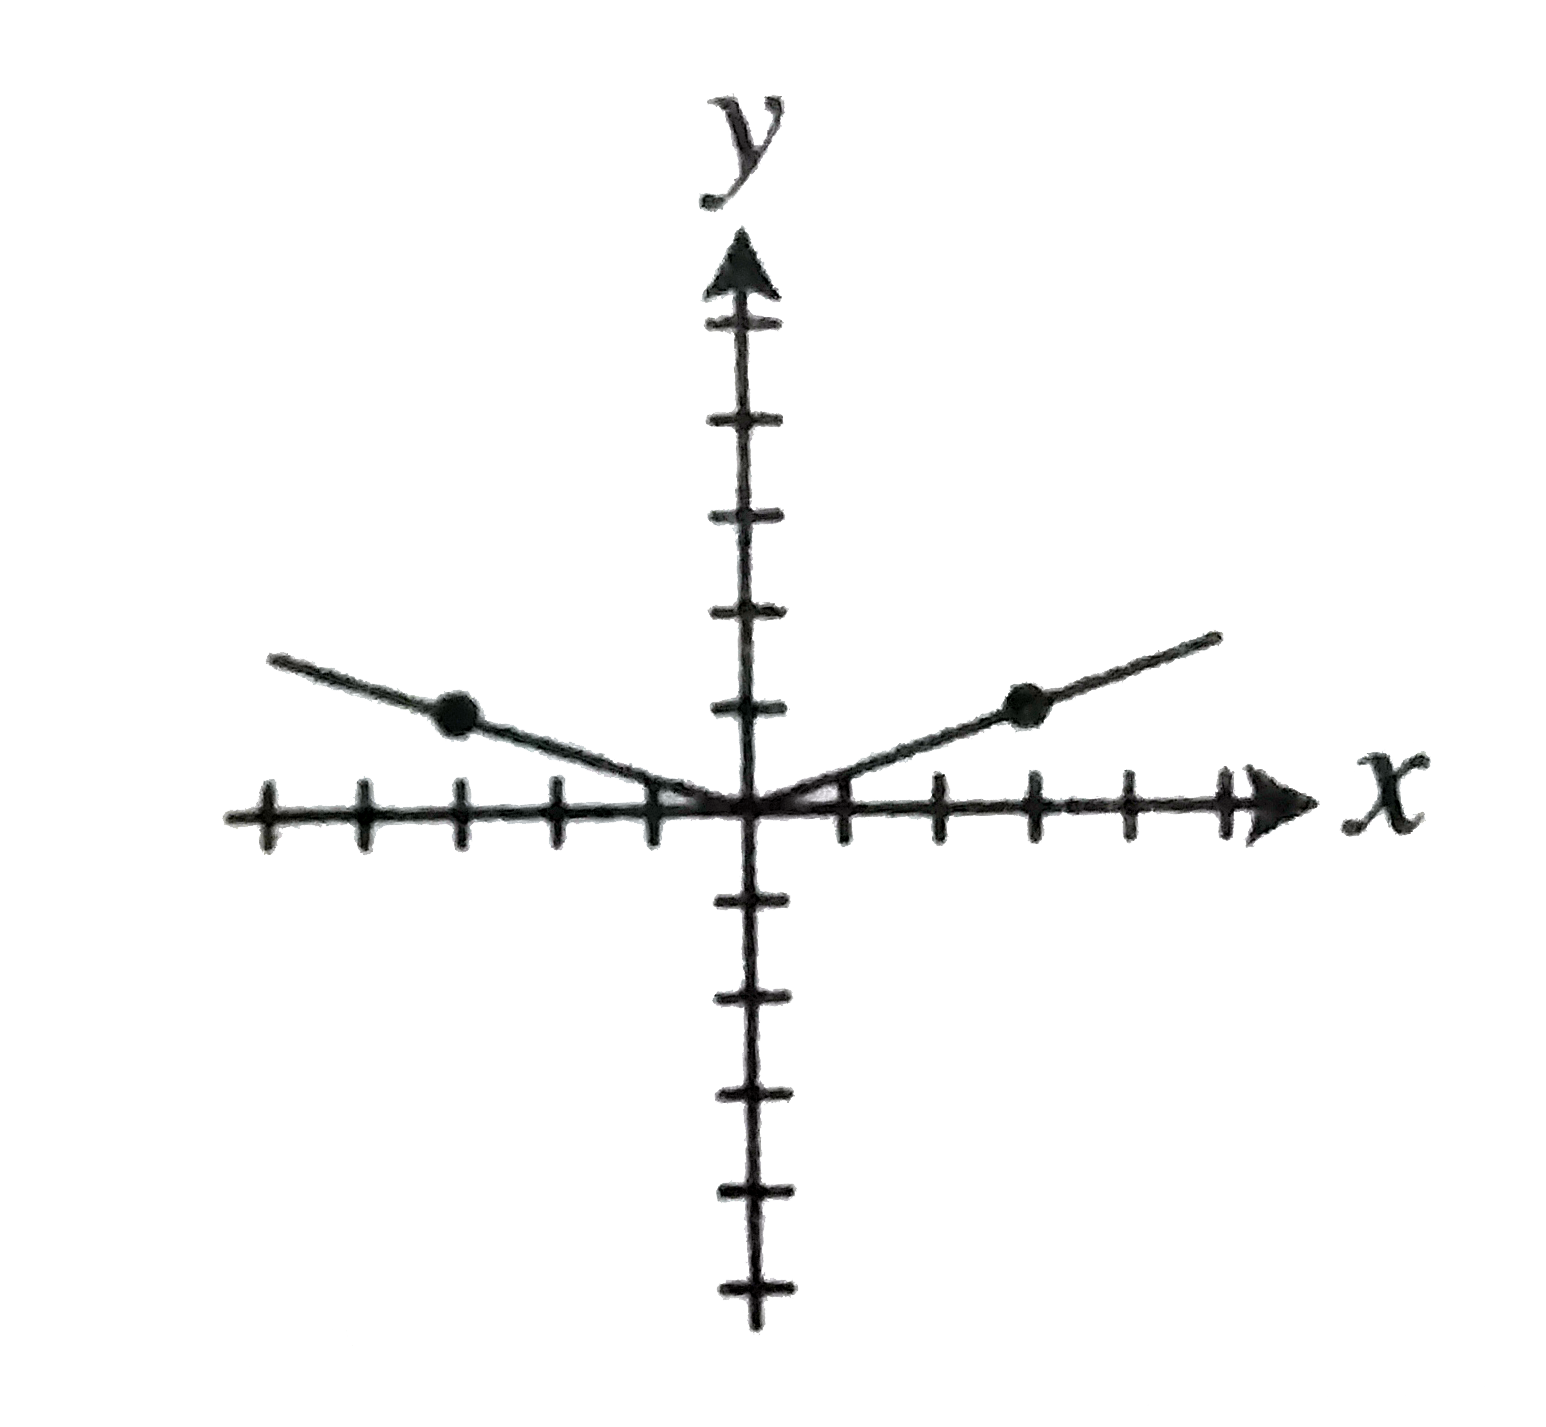 C
C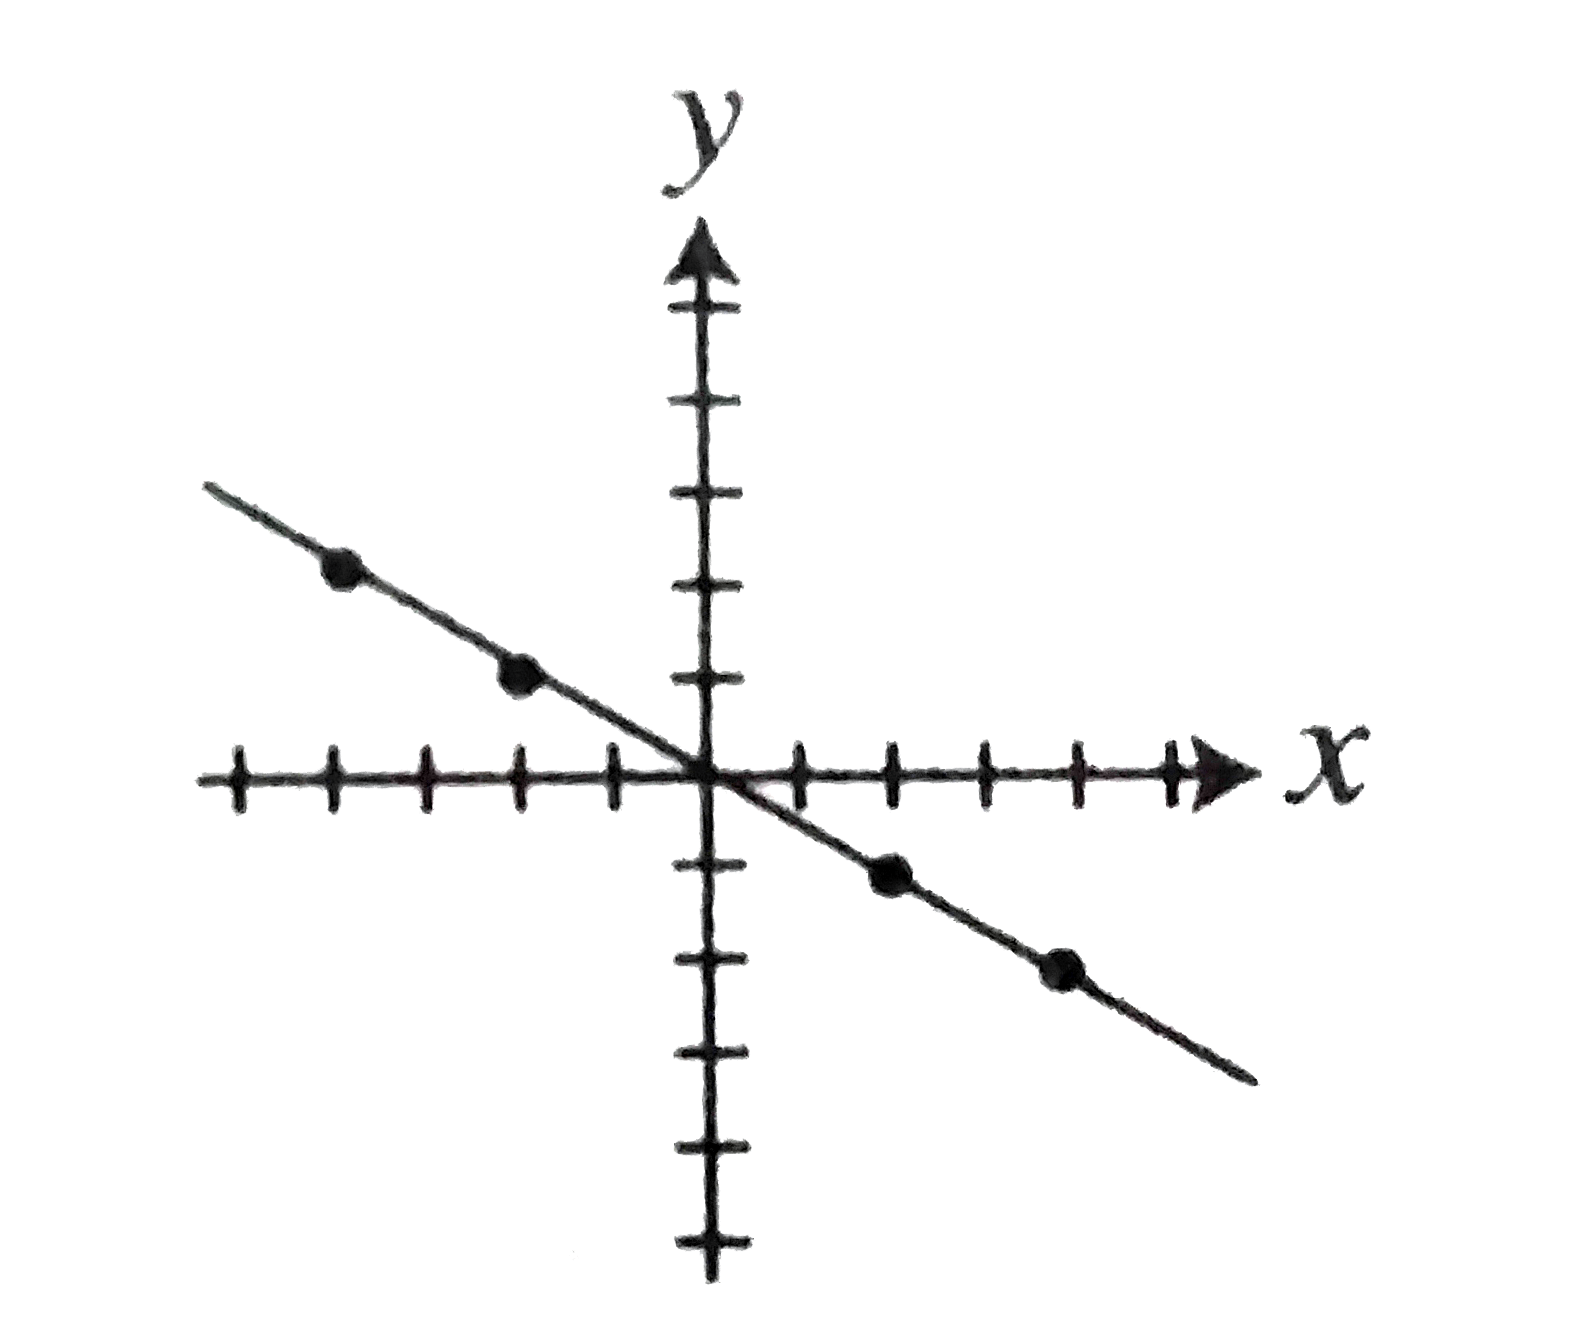 D
D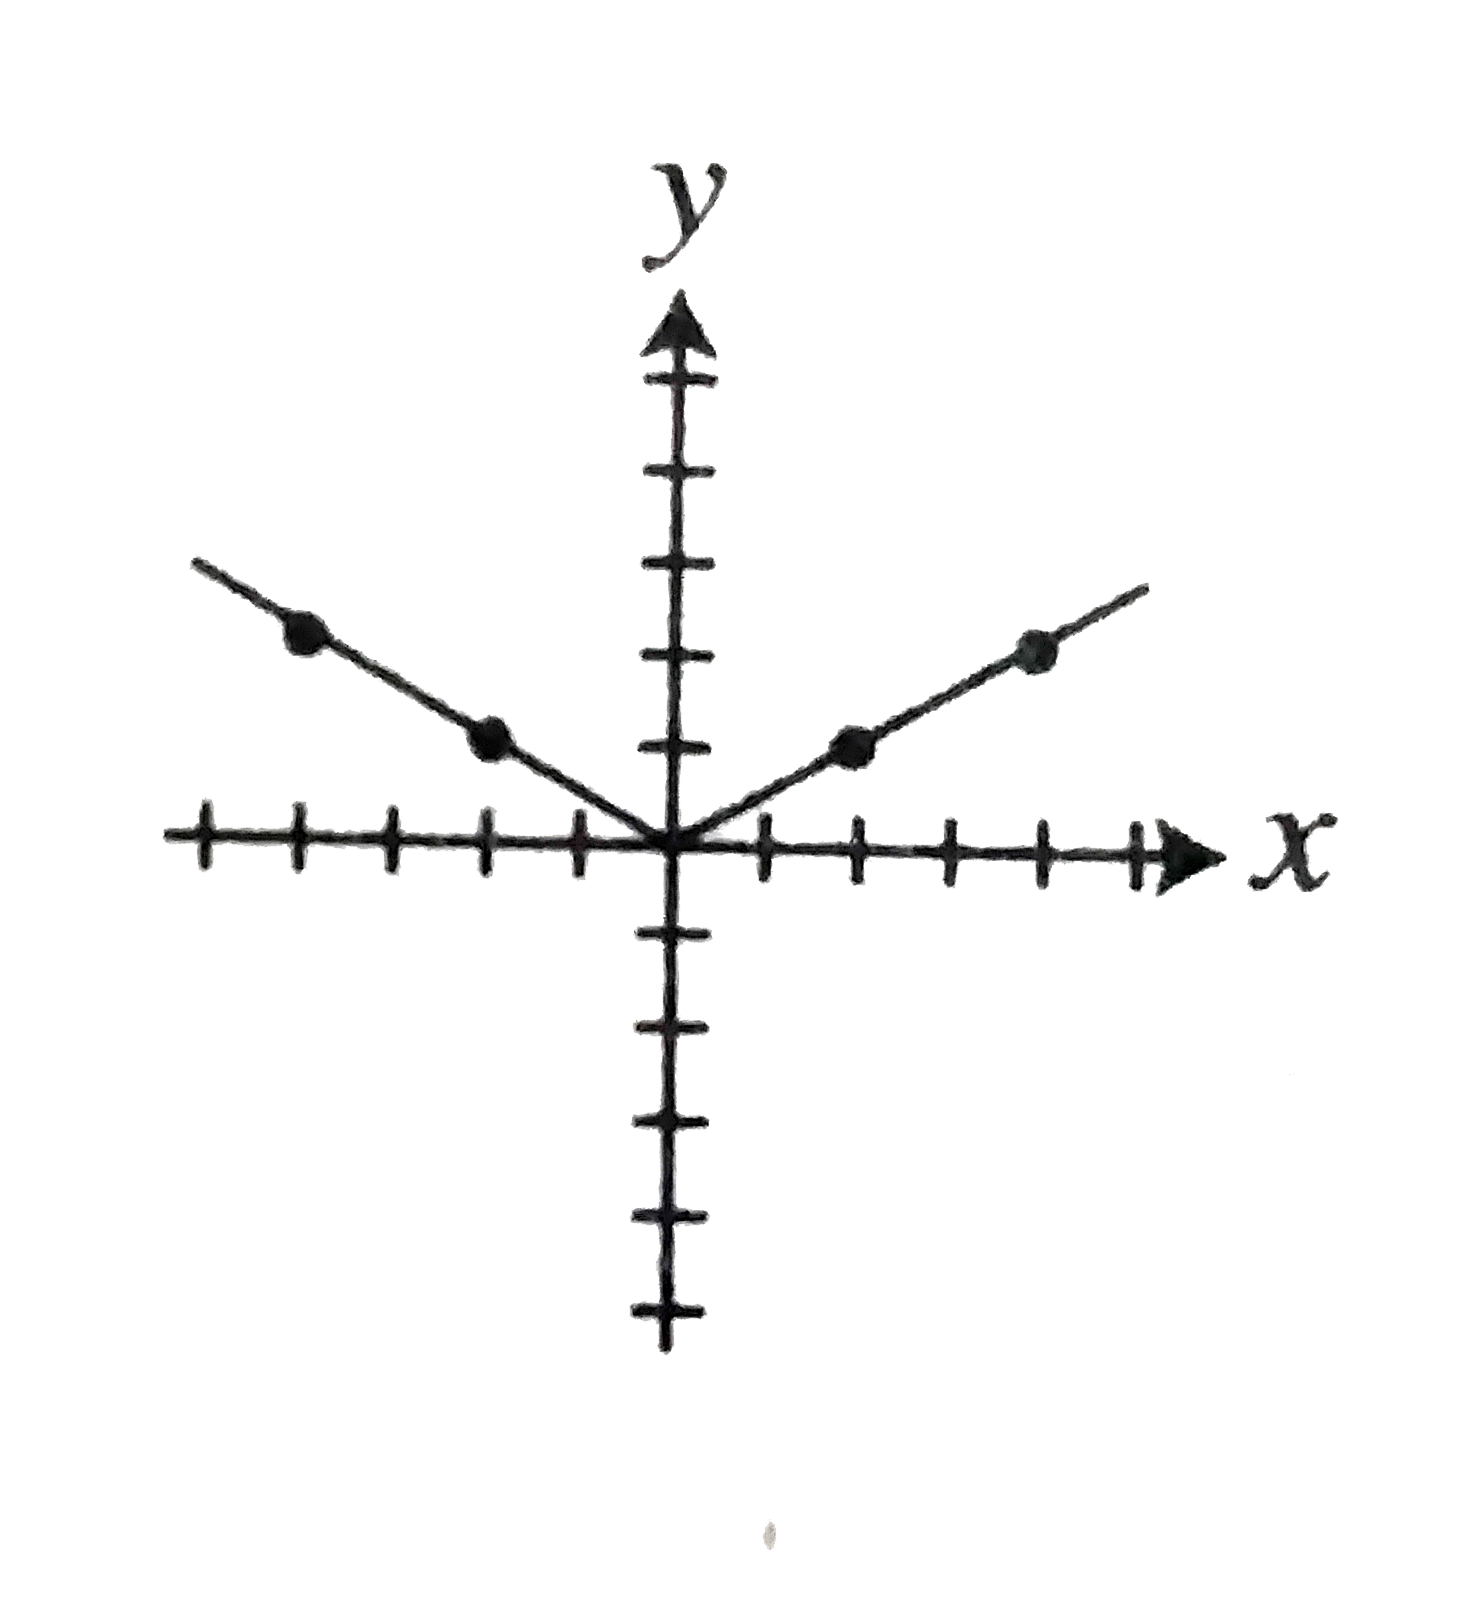
Which of the following x - t graphs shows an object moving with negative acceleration?

View SolutionIn a graph of population, on x-axis time and on y-axis population is plotted. A parallel line to x-axis shows:
View SolutionFigure shows a plot of the potential energy as a function of x for a particle moving along the x-axis. Which of the following statement(s) is/are true?
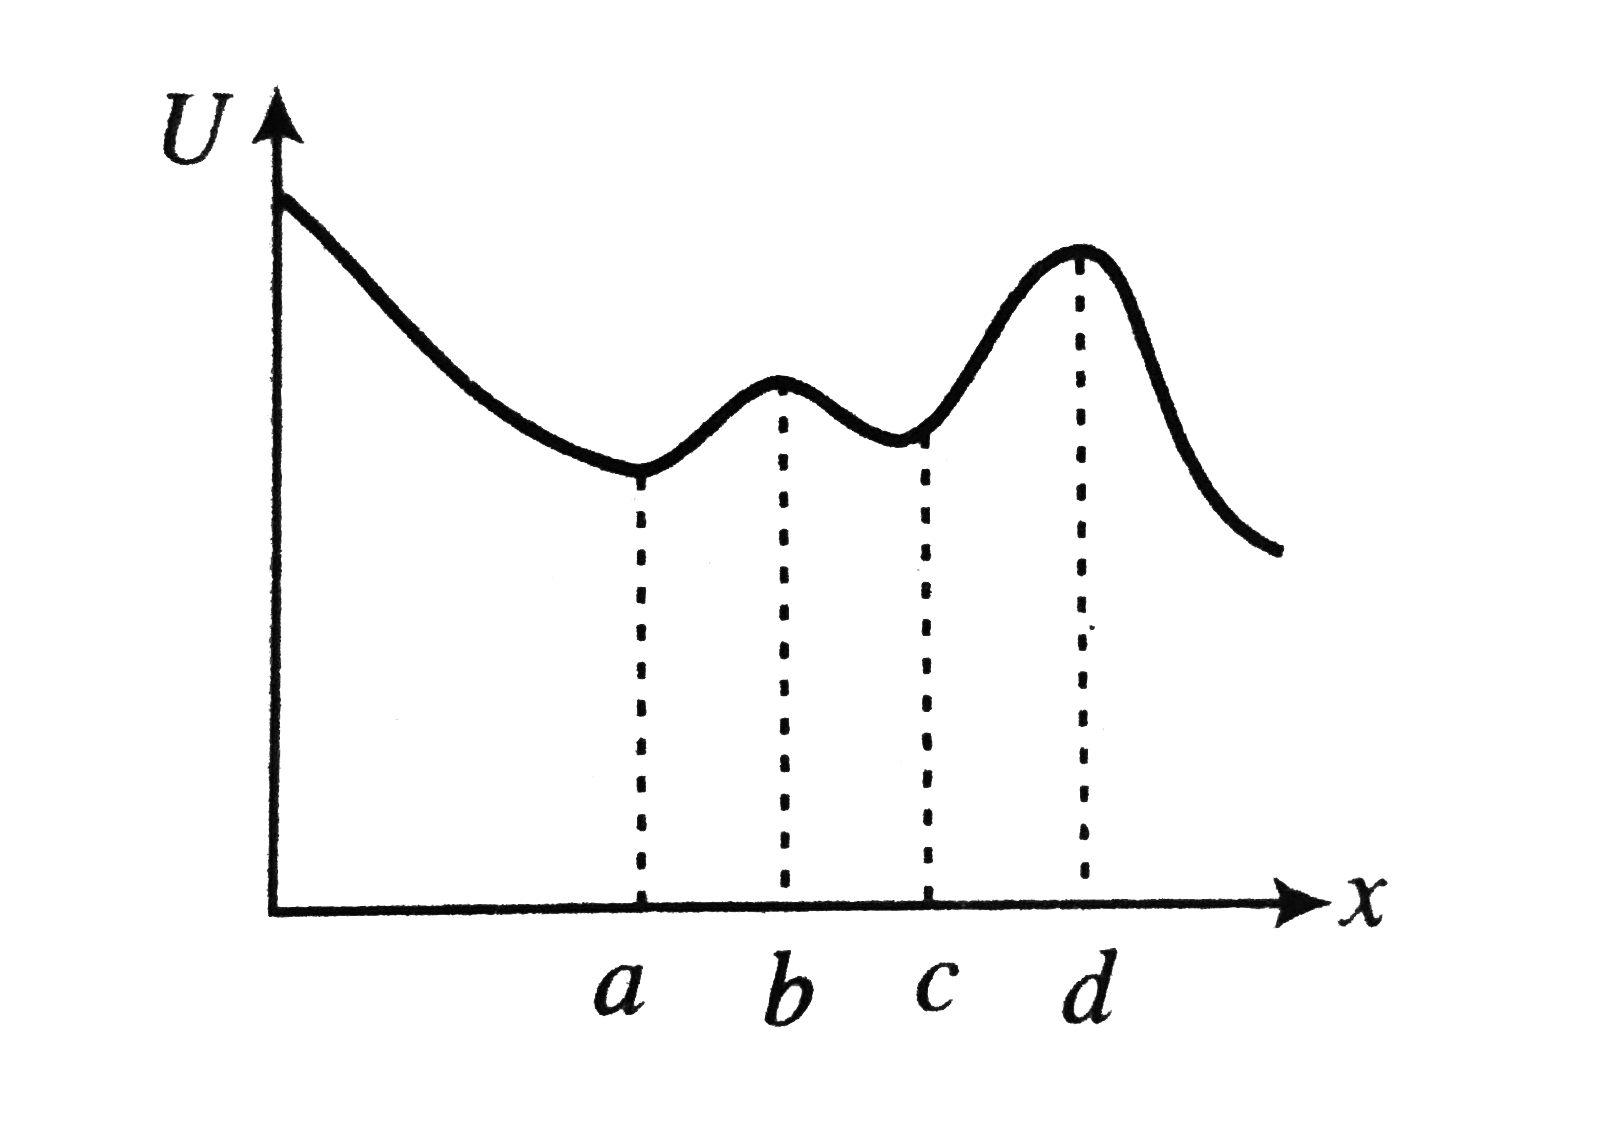
View SolutionFigure shows a plot of the potential energy as a function of x for a particle moving along the x-axis. Which of the following statement(s) is/are true?

View SolutionA graph is plotted with PV/T on y-axis and mass of the gas along x-axis for different gases. The graph is
View Solution
