The bar graph given alongside shows the amount of wheat purchasedby government during the year 1998-2002. Read the bar graph andwrite down your observations. In which year was(a) the wheat production maximum?(b) the wheat production minimum?
To solve the problem, we will analyze the bar graph data for the amount of wheat purchased by the government from 1998 to 2002. We will identify the years with maximum and minimum wheat production based on the values represented in the graph.
1. Identify the Years and Values:
- From the bar graph, we note the following amounts of wheat purchased (in thousands of tons):
- 1998: 15 (which means 15,000 tons)
- 1999: 25 (which means 25,000 tons)
- 2000: 20 (which means 20,000 tons)
- 2001: 20 (which means 20,000 tons)
- 2002: 30 (which means 30,000 tons)
2. Determine Maximum Wheat Production:
- We look for the highest value among the years listed.
- The values are: 15, 25, 20, 20, and 30.
- The maximum value is 30, which corresponds to the year 2002.
3. Determine Minimum Wheat Production:
- Next, we look for the lowest value among the years listed.
- The values are: 15, 25, 20, 20, and 30.
- The minimum value is 15, which corresponds to the year 1998.
Observations:
- The year with the maximum wheat production was 2002, with a total of 30,000 tons.
- The year with the minimum wheat production was 1998, with a total of 15,000 tons.
Final Answer:
(a) The wheat production was maximum in the year 2002.
(b) The wheat production was minimum in the year 1998.
- From the bar graph, we note the following amounts of wheat purchased (in thousands of tons):
- 1998: 15 (which means 15,000 tons)
- 1999: 25 (which means 25,000 tons)
- 2000: 20 (which means 20,000 tons)
- 2001: 20 (which means 20,000 tons)
- 2002: 30 (which means 30,000 tons)
- We look for the highest value among the years listed.
- The values are: 15, 25, 20, 20, and 30.
- The maximum value is 30, which corresponds to the year 2002.
- Next, we look for the lowest value among the years listed.
- The values are: 15, 25, 20, 20, and 30.
- The minimum value is 15, which corresponds to the year 1998.
- The year with the maximum wheat production was 2002, with a total of 30,000 tons.
- The year with the minimum wheat production was 1998, with a total of 15,000 tons.
(a) The wheat production was maximum in the year 2002.
(b) The wheat production was minimum in the year 1998.
Topper's Solved these Questions
- DATA HANDLINGBOOK - NCERT ENGLISHCHAPTER - DATA HANDLINGEXERCISE - EXERCISE 9.4
4 Videos
- DATA HANDLINGBOOK - NCERT ENGLISHCHAPTER - DATA HANDLINGEXERCISE - EXERCISE 9.1
7 Videos
- DATA HANDLINGBOOK - NCERT ENGLISHCHAPTER - DATA HANDLINGEXERCISE - SOLVED EXAMPLES
9 Videos
- BASIC GEOMETRICAL IDEASBOOK - NCERT ENGLISHCHAPTER - BASIC GEOMETRICAL IDEASEXERCISE - EXERCISE 4.6
4 Videos
- DECIMALSBOOK - NCERT ENGLISHCHAPTER - DECIMALSEXERCISE - EXERCISE 8.3
2 Videos
Similar Questions
The bar graph given alongside shows the amount of wheat purchased by government during the year 1998-2002.
Read the bar graph and write down your observations. In which year was
(a) the wheat production maximum?
(b) the wheat production minimum?
View SolutionRead the bar graph given below :
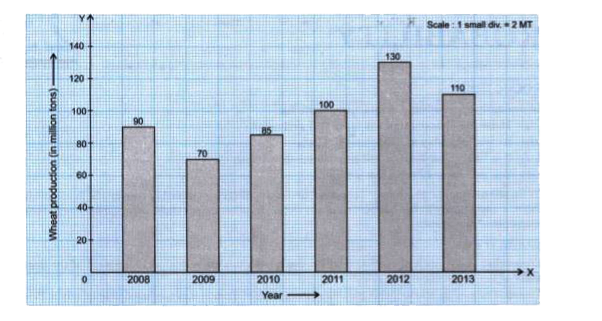
In which year there was maximum increase in production of wheat?
View SolutionRead the bar graph given below :
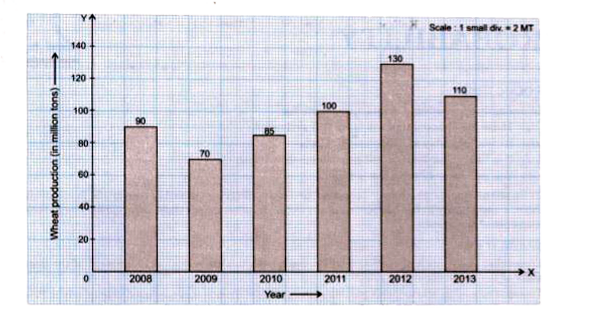
In which year the production was minimum?
View SolutionRead the bar graph and answer the following questions.
in which year the value of the export is greater than that of the import?
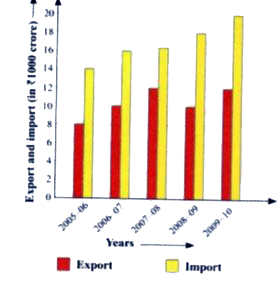
View SolutionRead the bar graph and answer the following questions.
In which year the difference of the values of export and import is maximum?
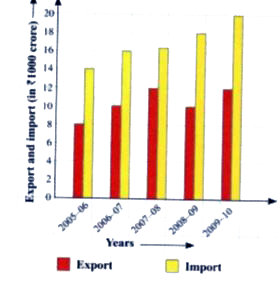
View SolutionRead the bar graph given below :
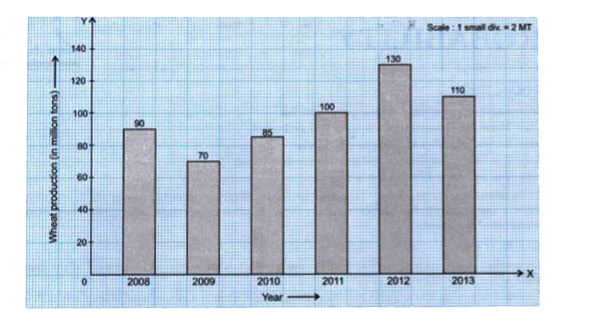
Find the percentage increase in wheat production in the year 2012.
View SolutionRead the bar graph given below :
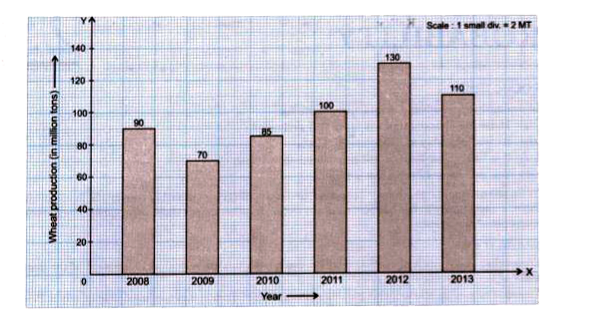
What was the wheat production in 2010?
View SolutionObserve the bar graph given below :
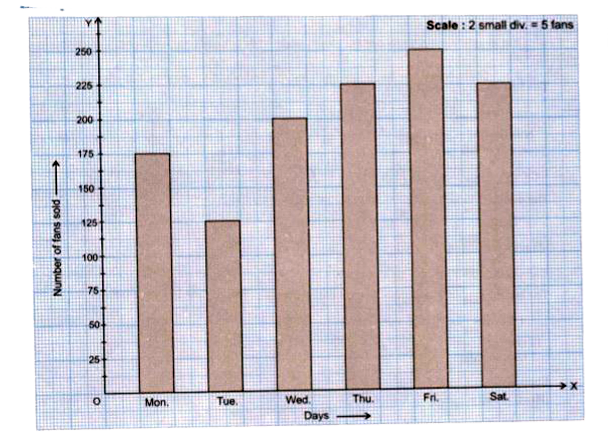
Read the bar graph carefully and answer the following questions :
On which day of the week was the sale maximum?
View SolutionThe graph shown in Figure exhibits the rate of interest on fixed deposits upto one year announced by the Reserve Bank of India in different years. Read the graph and find: In which period was the rate of interest maximum? In which period was the rate of interest minimum?
View SolutionObserve the bar graph given below :
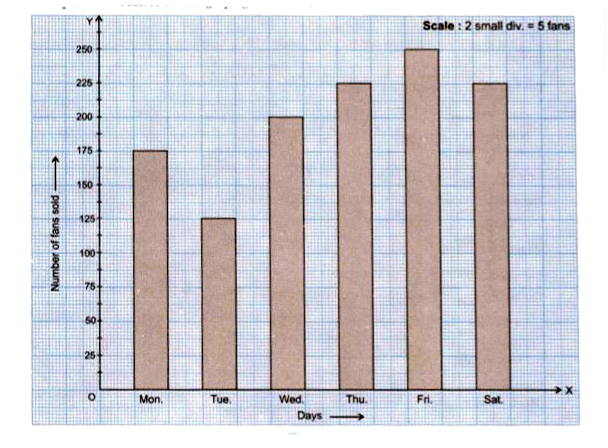
Read the bar graph carefully and answer the following questions :
What was the total sale during the week?
View Solution
