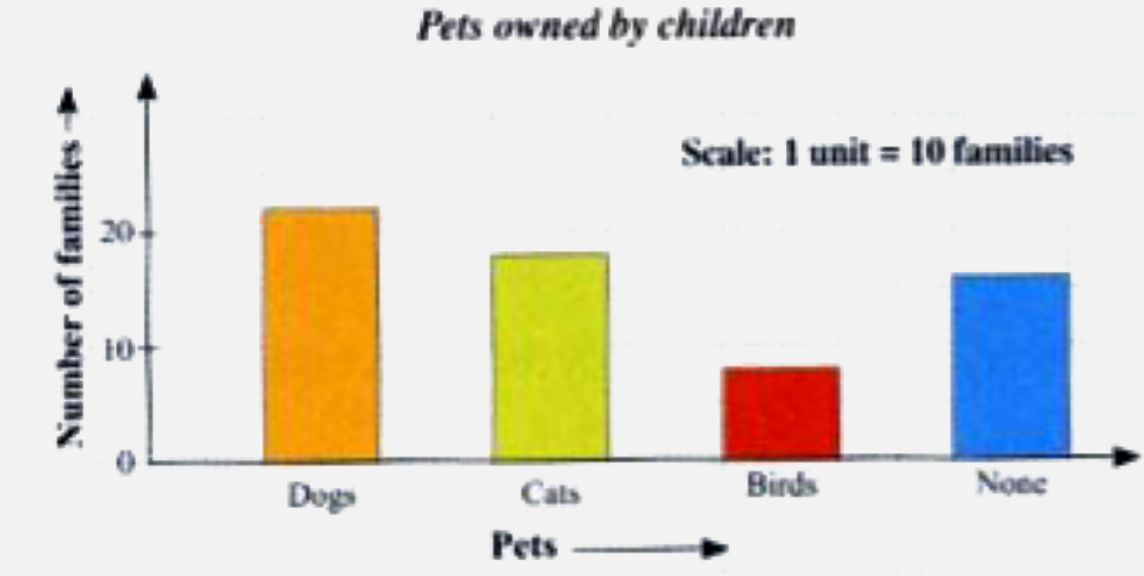
The following bar graph gives the data about the pets owned by families in a colony.

Read the graph and answer the following.
Which is the least common pet?
The correct Answer is:Bird
Step by step video & image solution for The following bar graph gives the data about the pets owned by families in a colony. Read the graph and answer the following. Which is the least common pet? by Maths experts to help you in doubts & scoring excellent marks in Class 7 exams.
Updated on:21/07/2023Topper's Solved these Questions
- DATA HANDLING AND MEASURES OF CENTRAL TENDENCYBOOK - ICSECHAPTER - DATA HANDLING AND MEASURES OF CENTRAL TENDENCYEXERCISE - REVISION EXERCISE
39 Videos
- DATA HANDLING AND MEASURES OF CENTRAL TENDENCYBOOK - ICSECHAPTER - DATA HANDLING AND MEASURES OF CENTRAL TENDENCYEXERCISE - WARM-UP EXERCISE
5 Videos
- DATA HANDLING AND MEASURES OF CENTRAL TENDENCYBOOK - ICSECHAPTER - DATA HANDLING AND MEASURES OF CENTRAL TENDENCYEXERCISE - EXERCIES 18.1
37 Videos
- CONSTRUCTIONS BOOK - ICSECHAPTER - CONSTRUCTIONS EXERCISE - REVISION EXERCISE
12 Videos
- DATA HANDLING BOOK - ICSECHAPTER - DATA HANDLING EXERCISE - EXERCISE 24D
13 Videos
Similar Questions
The following bar graph gives the data about the pets owned by families in a colony.

Read the graph and answer the following.
How many families do not have any pets?
View SolutionFollowing is a bar graph giving the approximate heights of five mountain peaks. Read the graph and answer the following questions.
Which is the highest peak and what is its height?

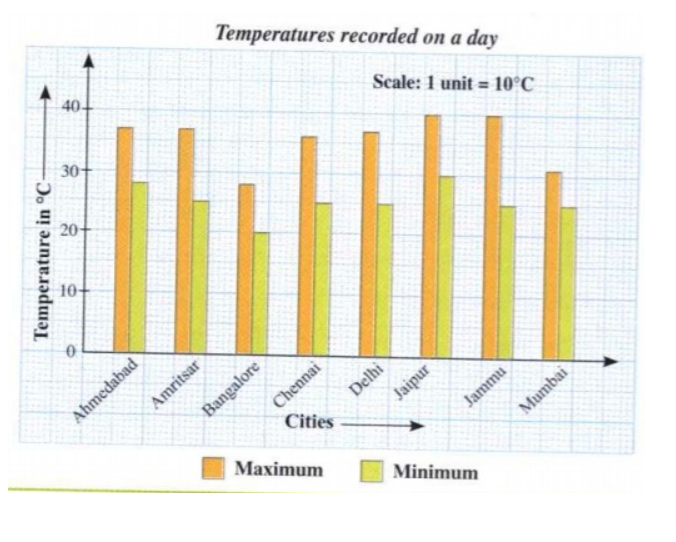
View SolutionThe following graph gives the minimum and maximum temperatures of various cities on a specific day. Read the graph and answer the following questions
Which are the hottest and the coldest cities on the given day?

View SolutionThe following graph gives the minimum and maximum temperatures of various cities on a specific day. Read the graph and answer the following questions
Which city has the largest difference between the minimum and the maximum temperatures on the given day?

View SolutionThe following bar graph represents the data for different sizes of shoes worn by the students in a school. Read the graph and answer the following questions.
(i)What are the different numbers of the shoe-worn by the students?
(ii)What is the number of students wearing shoe No. 6?
(iii)Which shoe number is worn by the maximum number of students?
(iv)Which shoe number is worn by the minimum number of students?
View SolutionThe following graph gives the minimum and maximum temperatures of various cities on a specific day. Read the graph and answer the following questions
Name the city which has the minimum difference between its minimum and maximum temperatures.

View SolutionThe following graph gives the minimum and maximum temperatures of various cities on a specific day. Read the graph and answer the following questions
Name the two cities where the maximum temperature of one city was less than the minimum temperature of the other city.

View SolutionFollowing is a bar graph giving the approximate heights of five mountain peaks. Read the graph and answer the following questions.
Find the ratio of the height of the highest peak to that of the lowest peak.

View SolutionGiven below is a bar graph showing the heights of five mountain peaks.
Read the bar graph carefully and answer the following questions:
(i) Which is the highest peak and what is its height?
(ii) What is the ratio of the heights of the highest peak and the next highest peak?
(iii) Arrange the heights of the given peaks in descending order.
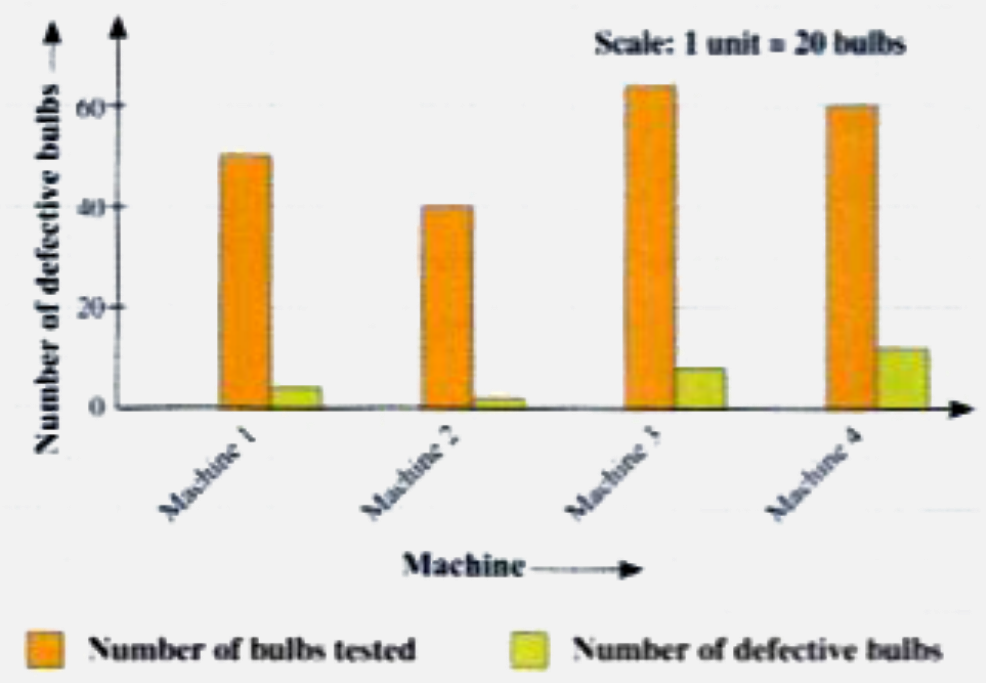
View SolutionA bulb manufacturing company tests the bulbs produced by four different machines. The following graph gives the number of bulbs tested that are produced by each machine and the number that are found to be defective.

Read the graph and answer the following.
Which is the best machine?
View Solution
