The following distribution gives the number of accidents met by 160 workers in a factory during a month. No. of accidents (x) : 0 1 2 3 4 No. of workers (f) : 70 52 34 3 1 Find the average number of accidents per worker.
Step by step video & image solution for The following distribution gives the number of accidents met by 160 workers in a factory during a month. No. of accidents (x) : 0 1 2 3 4 No. of workers (f) : 70 52 34 3 1 Find the average number of accidents per worker. by Maths experts to help you in doubts & scoring excellent marks in Class 10 exams.
Topper's Solved these Questions
Similar Questions
The following table gives the number of children of 150 families in a village No. of children (x) : 0 1 2 3 4 5 No. of families (f) : 10 21 55 42 15 7 Find the average number of children per family.
View SolutionIn the first proof reading of a book containing 300 pages the following distribution of misprints was obtained: No. of misprints per page (x) : 0 1 2 3 4 5 No. of pages (f) : 154 95 36 9 5 1 Find the average number of misprints per page.
View Solution
Knowledge Check
- Question 1 - Select One
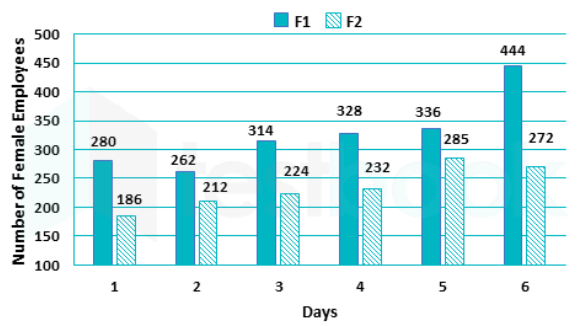
The Bar graph given below presents the number of female employees working in two factories on six different days of a week.

What is the difference (correct up to two decimal places) in the average number of females working per day in a factory F1 and the average number of females working per day in a factory F2?A87.33B125.33C92.17D96.25
The following distribution gives the daily income of 50 workers of a factory: Daily income (in Rs): 100-120 120-140 140-160 160-180 180-200 Number of workers: 12 14 8 6 10 Convert the above distribution to a less than type cumulative frequency distribution and draw its ogive.
View SolutionThe following table gives the daily income of 50 workers of a factory: Daily income (in Rs): 100-120 120-140 140-160 160-180 180-200 Number of workers: 12 14 8 6 10 Find the mean, mode and median of the above data.
View SolutionConsider the following information regarding the number of men and women workers in three factories. I, II and III. Men workers Women workers I 30 25 II 25 31 III 27 26 Represent the above information in the form of 3×2 matrix. What does the entry in the third row and second column represent?
View SolutionConsider the following information regarding the number of men and women workers in three factories I, II and III.
Men workers Women workers
I 30 25
II 25 31
III 27 26
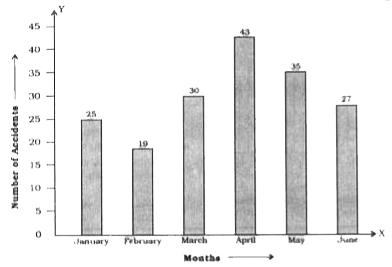
Represent the above information in the form of a 3×2matrix. What does the entry in the third row and second column represent?View SolutionThe bar-chart is showing the number of accidents in a city during the first six month of a year. Examine the bar chart and answer the following questions.

By what number, is the number of accidents that occurred in April is greater than the average number of accidents that occured during the 6 months period ?View SolutionConsider the following distribution of daily wages of 50 workers of a factory. Daily wages: 100-120 120-140 140-160 160-180 180-200 (in Rs). Number of 12 14 8 6 10 workers: Find the mean daily wages of the workers of the factory by using an appropriate method.
View SolutionThe following table gives the number of finished articles turned out per day be different number of workers in a factors. Find the standard deviation of the daily output of finished articles. Find the variance and standard deviation of the following frequency distribution:
Number of article:, 18, 19, 20, 21, 22, 23, 24, 25, 26, 27
No. of workers:, 3, 7, 11, 14, 18, 17, 13, 8, 5, 4View Solution

