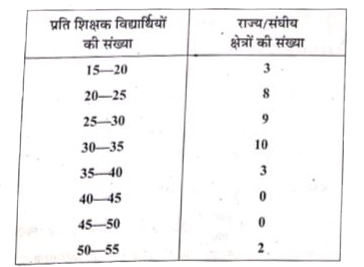
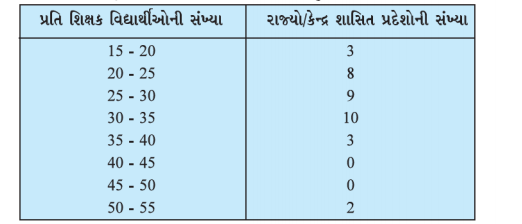
The following distribution gives the state-wise , teacher -student ratio in higher secondary schools of India . Find the mode and mean of this data . Interpret the two measures .
Number of studentsNumber of states15−20320−25825−30930−351035−40340−45045−50050−552Solution in Telugu
The correct Answer is:Mean= 30.625,Mode=29.22
Step by step video, text & image solution for The following distribution gives the state-wise , teacher -student ratio in higher secondary schools of India . Find the mode and mean of this data . Interpret the two measures . {:("Number of students","Number of states"),(15-20,3),(20-25,8),(25-30,9),(30-35,10),(35-40,3),(40-45,0),(45-50,0),(50-55,2):} by Maths experts to help you in doubts & scoring excellent marks in Class 10 exams.
Updated on:21/07/2023Topper's Solved these Questions
- STATISTICSBOOK - VGS PUBLICATION-BRILLIANTCHAPTER - STATISTICSEXERCISE - EXERCISE 14 .3
7 Videos
- STATISTICSBOOK - VGS PUBLICATION-BRILLIANTCHAPTER - STATISTICSEXERCISE - EXERCISE 14 .4
2 Videos
- STATISTICSBOOK - VGS PUBLICATION-BRILLIANTCHAPTER - STATISTICSEXERCISE - EXERCISE 14 .1
9 Videos
- SIMILAR TRIANGLES BOOK - VGS PUBLICATION-BRILLIANTCHAPTER - SIMILAR TRIANGLES EXERCISE - CREATIVE BITS FOR CCE MODEL EXAMINATION
90 Videos
- SUMMATIVE ASSESSMENTBOOK - VGS PUBLICATION-BRILLIANTCHAPTER - SUMMATIVE ASSESSMENTEXERCISE - SUMMATIVE ASSESSMENT
61 Videos
Similar Questions
The following frequency distribution gives the monthly consumption of electricity of 68 consumers of a locality . Find the mean of the data
Monthly consumption(in units)Number of consumers65−85485−1055105−12513125−14520145−16514165−1858185−2054
View SolutionThe following distribution gives the daily income of 50 workers of a factory .
Daily (in Rupees)Number of workers250−30012300−35014350−4008400−4506450−50010
Convert the distribution above to a lessthan type cumulative frequency distribution, and draw its ogive .
View SolutionA survey was conducted by a group of students as a part of their environment awareness programme , in which they collected the follwing data regarding the number of plants in 20 houses in a locality . Find the mean number of plants per house .
Number of plantsNumber of houses0−212−424−616−858−10610−12212−143
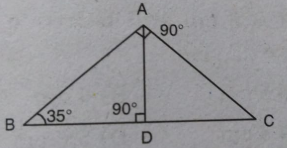
View SolutionFrom the figure ,∠DAC……….

View SolutionRamu says, "If log10x=0, value of x=0". Do you agree with him ? Give reason.
View SolutionThe following distribution gives the state-wise teacher-student ratio in higher secondary schools of India. Find the mode and mean of this data. Interpret the two measures.
View Solutionनिम्नलिखित बंटन भारत के उच्चतर माध्यमिक स्कूलो में राज्यों के अनुसार शिक्षक - विधार्थी अनुपात को दर्शाता है। इन आकड़ो के बहुलक और माध्य ज्ञात कीजिए। दोनों मापको की व्यख्या कीजिए।

View Solutionनिम्नलिखित बंटन भारत के उच्चतर माध्यमिक स्कूलों में, राज्यों के अनुसार, शिक्षक - विधार्थी अनुपात को दर्शाता है । इन आँकड़ों का बहुलक ज्ञात कीजिए ।

View SolutionThe following distribution gives the state-wise teacher-student ratio in higher secondary schools of India. Find the mode and mean of this data. Interpret the two measures.


View SolutionThe following button shows the teacher-student ratio by state in higher secondary schools in India. Find the polymer and mean of these data. Explain both the parameters.
View SolutionThere are 20 teachers in a school of 500 students. The ratio of the number of teachers to the number of students is
View SolutionThe teacher-student ratio values in secondary schools by state are given in the following frequency and subtraction degree. Calculate the multiplicity and mean of the data. And comment on these two central values.
View SolutionThe following distribution indicates the teacher-student ratio, according to states in higher secondary schools in India. Find the polymer of these data.
View SolutionThe following distribution distribution given the state-wise, teacher-student ratio in higher secondary schools of India. Find the mean of this data.

View SolutionThe following distribution distribution given the state-wise, teacher-student ratio in higher secondary schools of India. Find the mode and mean of this data. Interpret the two measures.

View Solution
