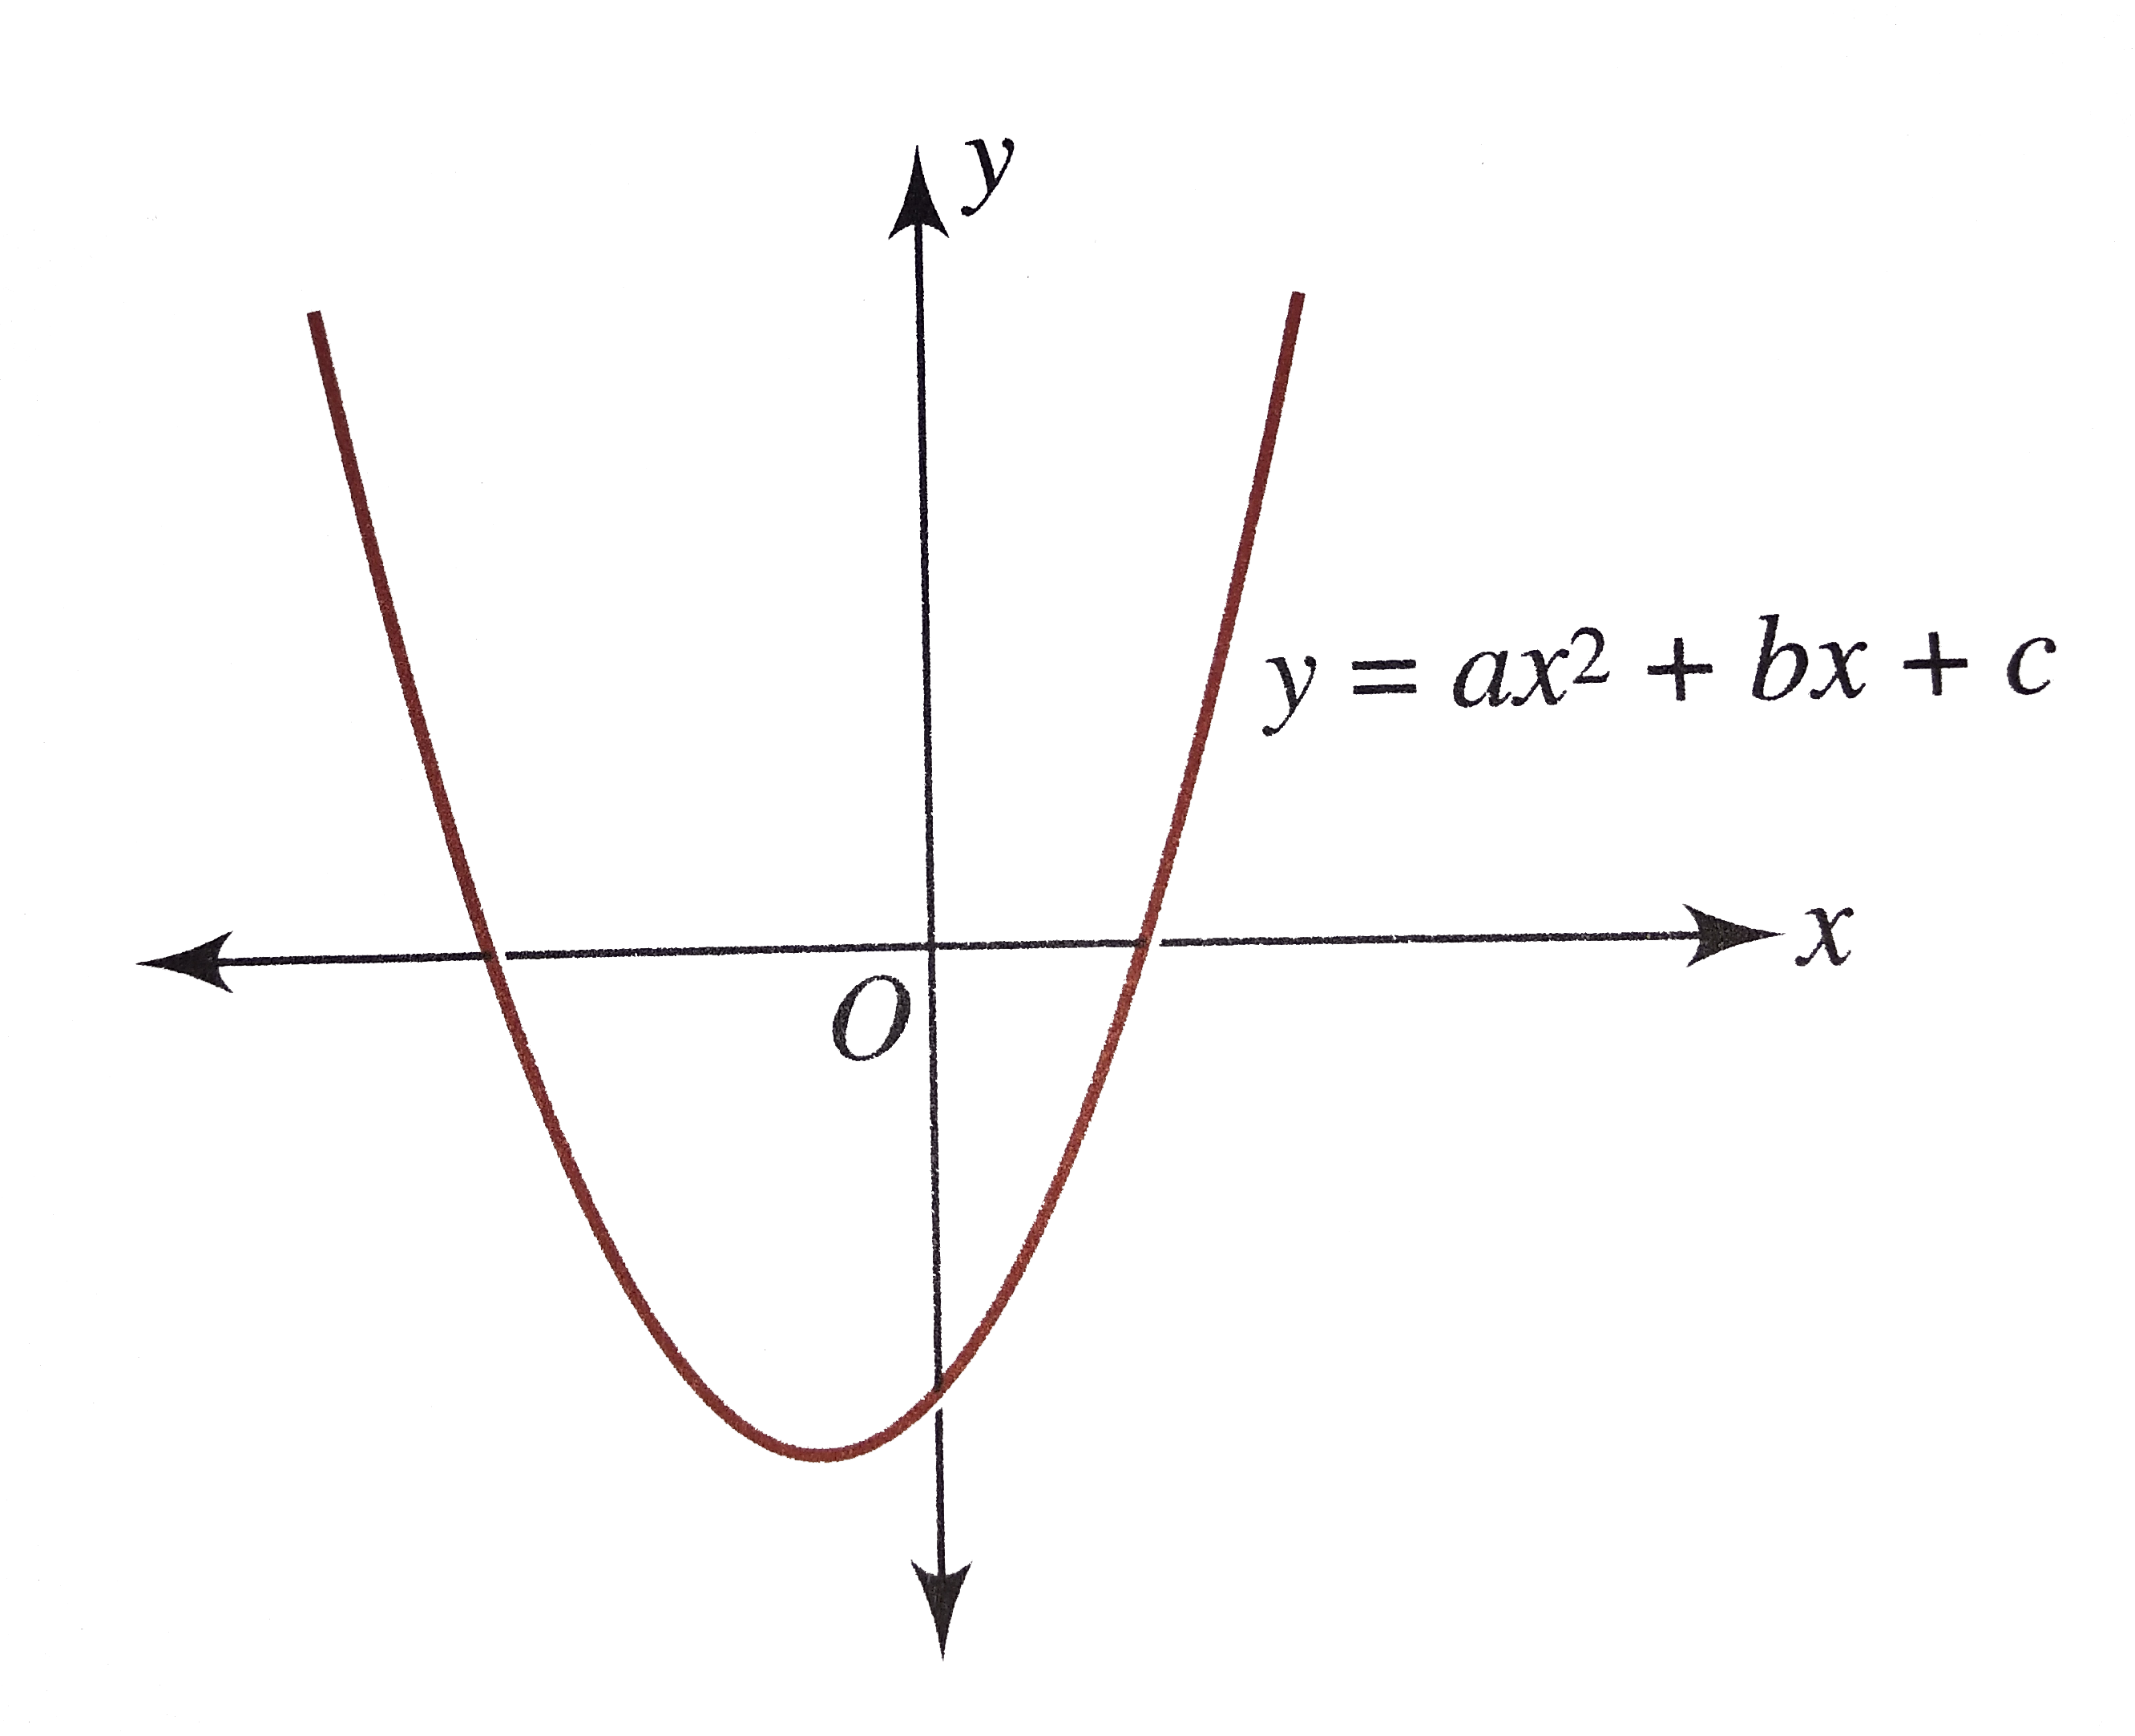
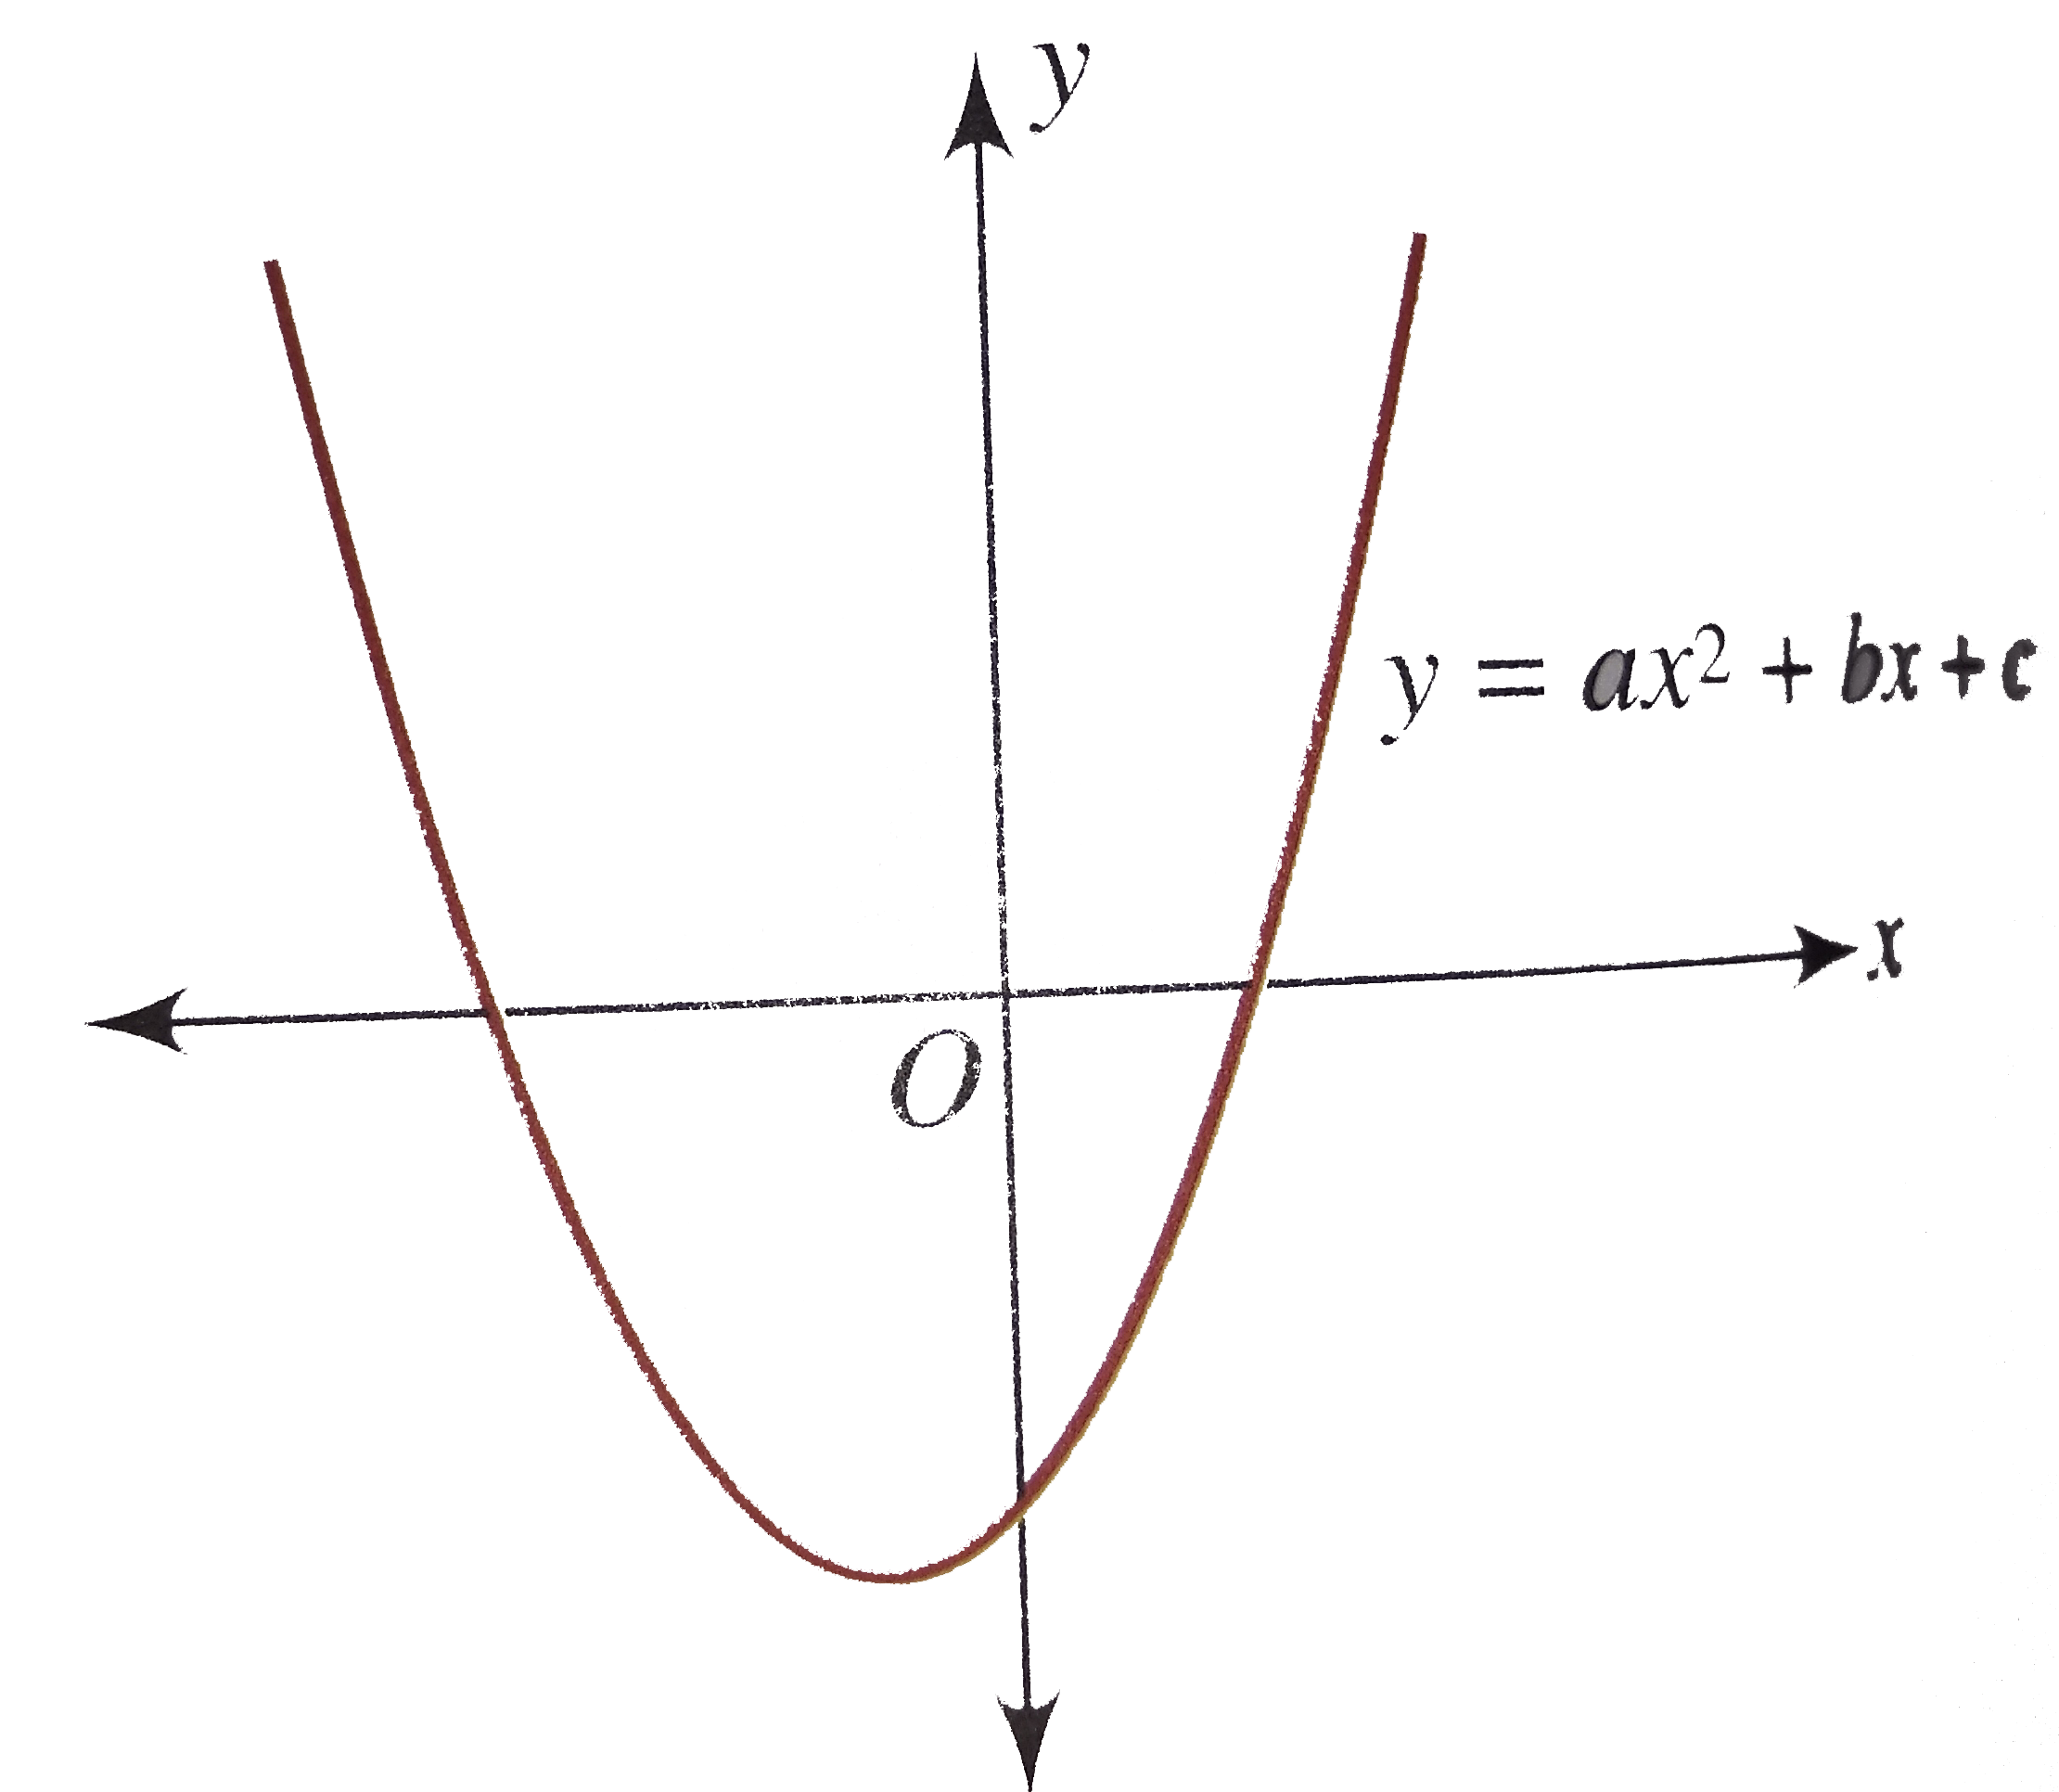
The following figure shows the graph of f(x)=ax2+bx+c, then find the sign of values of a,bandc.

Video Solution
Text Solution
From the graph, f(0)=c<0 (as the graph intersects the y-axis on the negative side)
Also the graph is concave upward ⇒a>0
Further the vertex lies on the left-hand side of the y-axis.
So the abscissa or the vertex −b2a<0
⇒b>0(as a>0)

|
Topper's Solved these Questions
- GRAPHS OF ELEMENTARY FUNCTIONS BOOK - CENGAGECHAPTER - GRAPHS OF ELEMENTARY FUNCTIONS EXERCISE - Exercise
34 Videos
- GRAPHS OF POLYNOMIAL AND RATIONAL FUNCTIONSBOOK - CENGAGECHAPTER - GRAPHS OF POLYNOMIAL AND RATIONAL FUNCTIONSEXERCISE - Exercise
13 Videos
- GRAPHS OF TRIGONOMETRIC FUNCTIONSBOOK - CENGAGECHAPTER - GRAPHS OF TRIGONOMETRIC FUNCTIONSEXERCISE - Exercise
22 Videos
Similar Questions
Knowledge Check
If f(x)=ax2+bx+c find f1(1).
Aa+2bB2a−bCa−2bD2a+b
If fig shows the graph of f(x)=ax2+bx+c,then Fig ac<0 b. bc>0 c. ab>0 d. abc<0
View SolutionIf f(x)=ax2+bx+c,a+b+c=0 then one root is
View SolutionLet f(x)=ax2+bx+c,if a>0 then f(x) has minimum value at x=
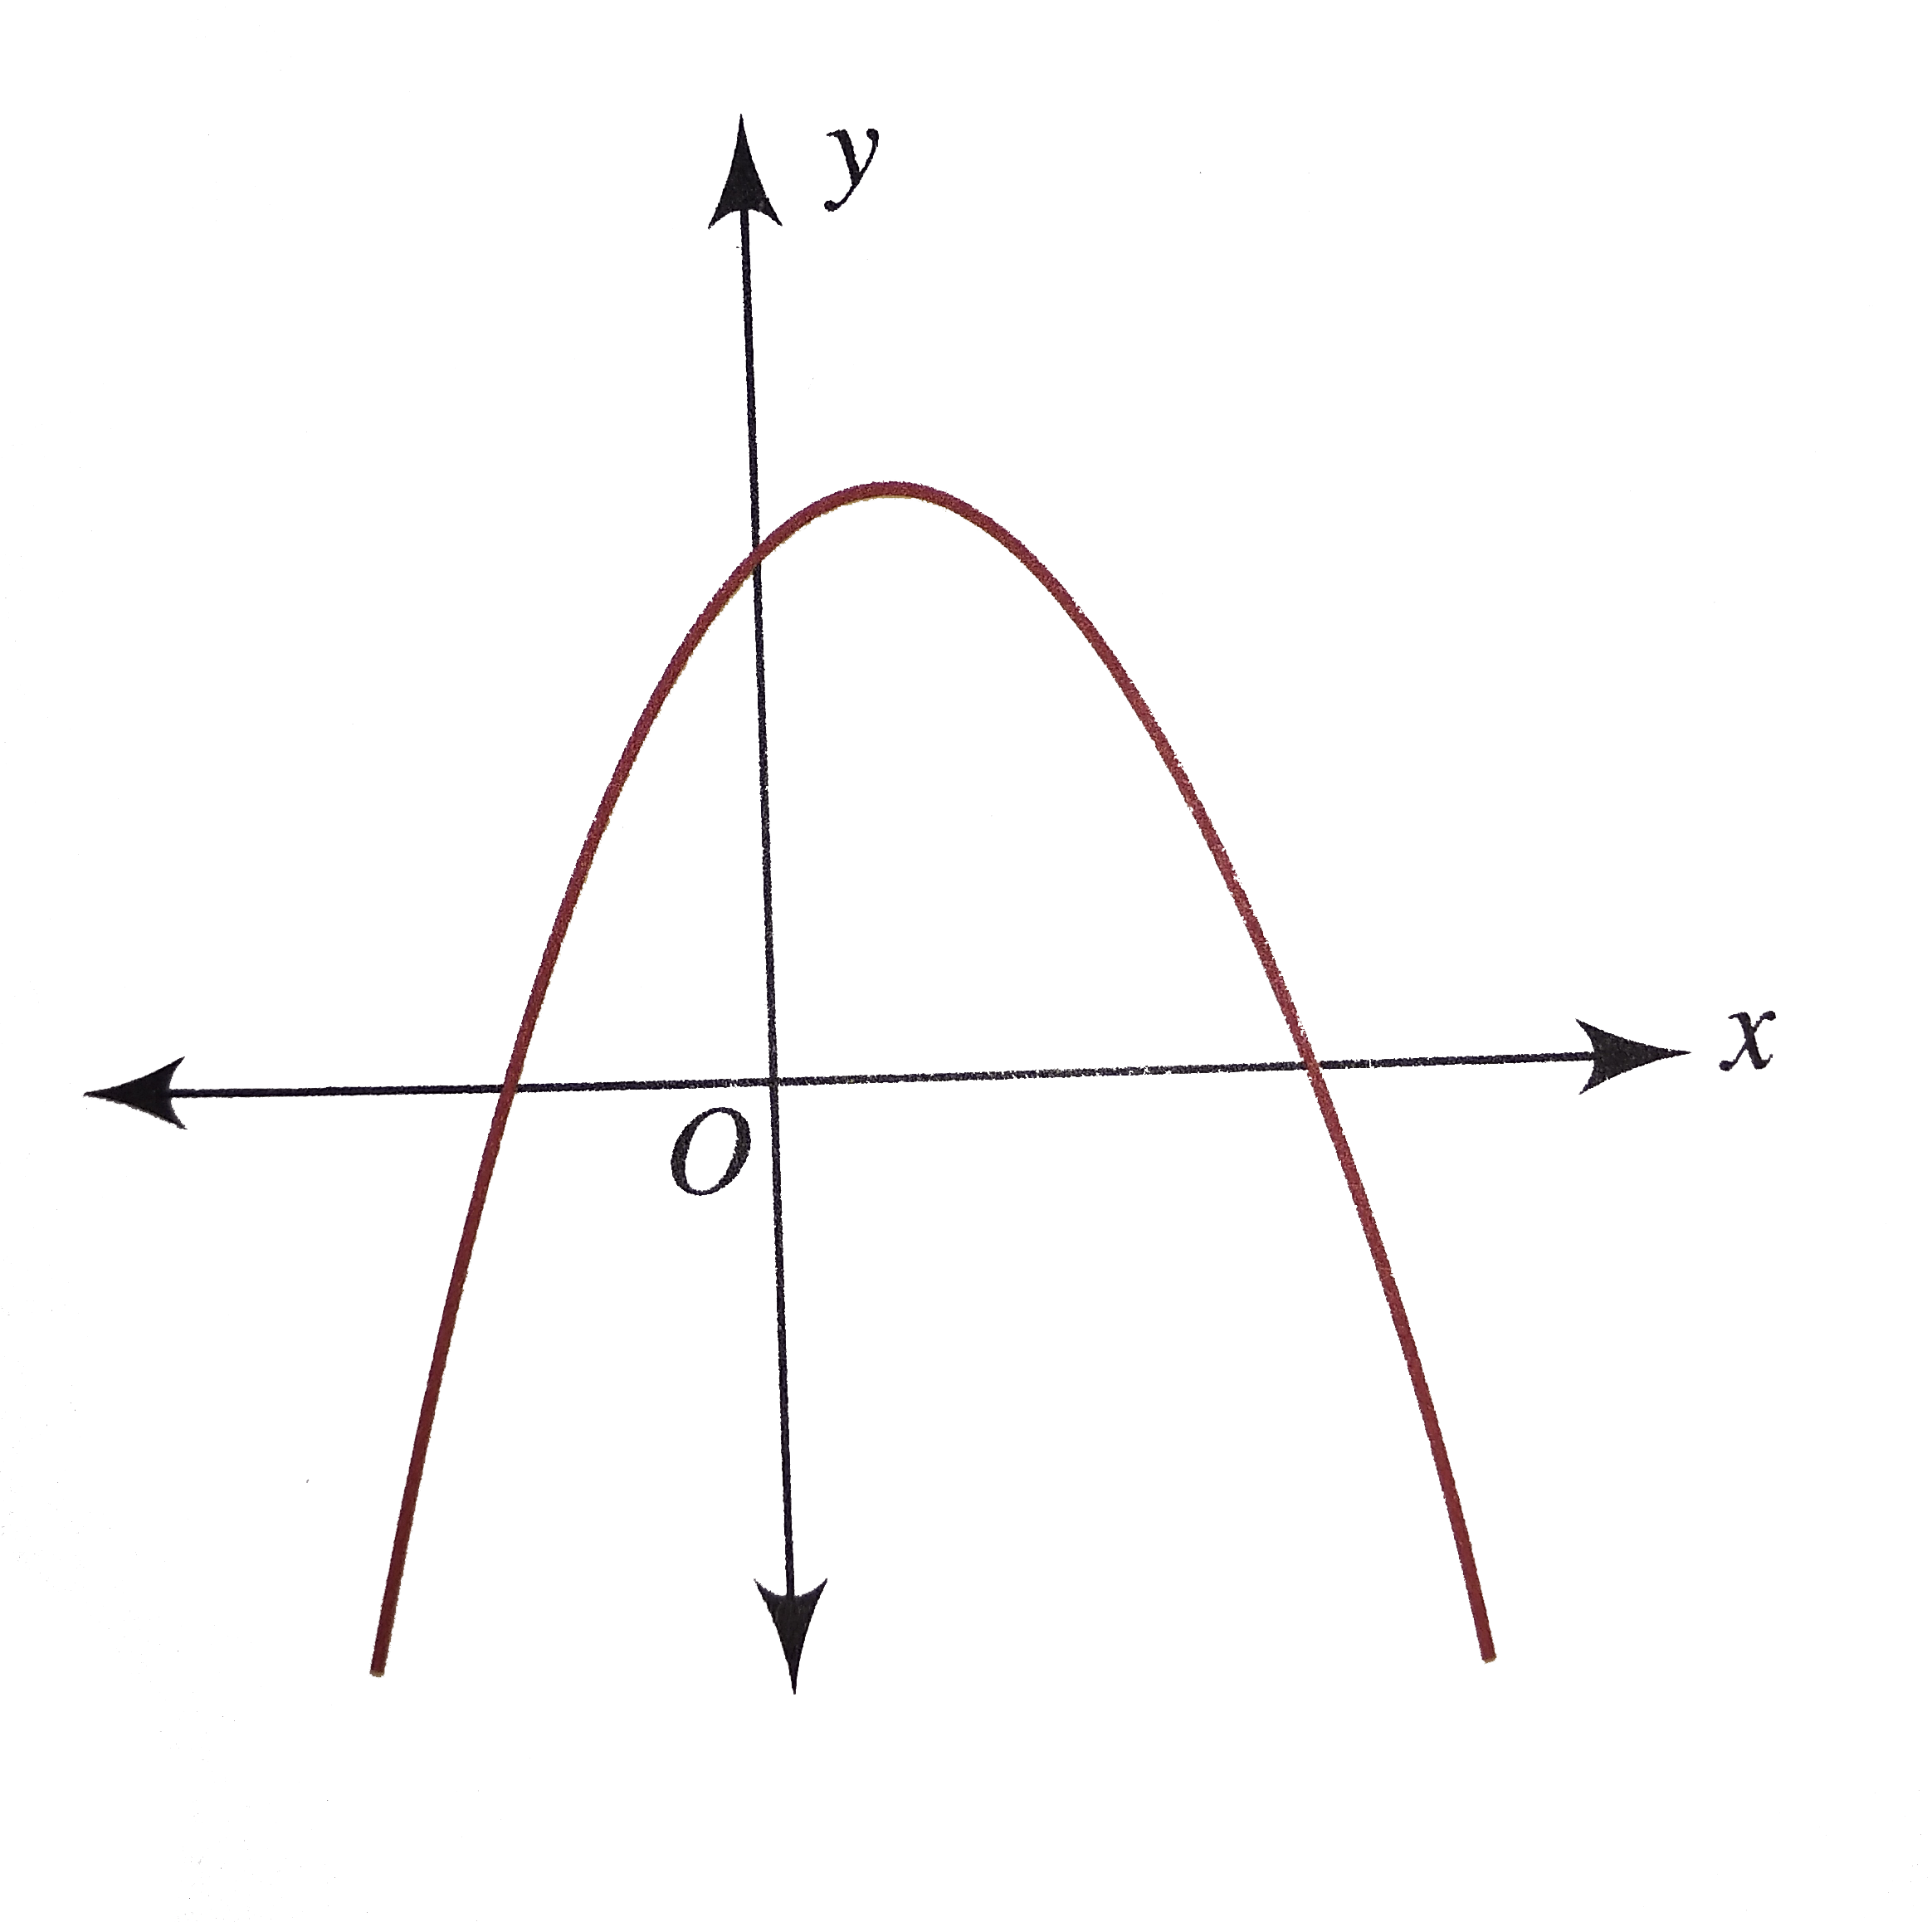
View SolutionConsider the graph of f(x)=ax2+bx+c in the adjacent figure. We can conclude that
View SolutionIf (x−α) is the H.C.F of x2+ax+b and x2+bx+a, then find the value of and a+b+1
View SolutionIf (x−α) is the H.C.F of x2+ax+b and x2+bx+a, then find the value of and a+b+1
View SolutionIf (x−α) is the H.C.F of x2+ax+b and x2+bx+a, then find the value of and a+b+1
View Solution

