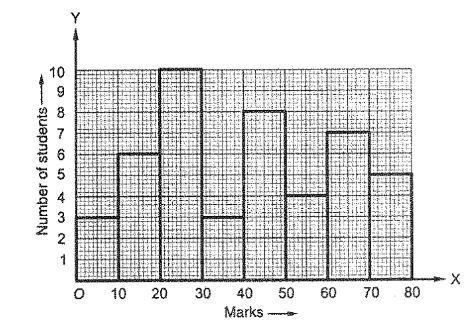
The following histogram depicts the marks
obtained by 45 students of a class:
Figure:
Look at the histogram and answer the following
questions:
What is the class size?
How many students obtained less than 10 marks?
How many students obtained 30 or more marks but
less than 40?
What is the interval of highest marks and how
many students are there in this interval?
If passing marks are 30, what is the number of
failures?

The correct Answer is:1. Class size = 10
2. 3 students
3. 3 students
4. 5 students
5. 19 students
Step by step video & image solution for The following histogram depicts the marks obtained by 45 students of a class: Figure: Look at the histogram and answer the following questions: What is the class size? How many students obtained less than 10 marks? How many students obtained 30 or more marks but less than 40? What is the interval of highest marks and how many students are there in this interval? If passing marks are 30, what is the number of failures? by Maths experts to help you in doubts & scoring excellent marks in Class 8 exams.
Updated on:21/07/2023Topper's Solved these Questions
- DATA HANDLING-I (CLASSIFICATION AND TABULATION DATA)BOOK - RD SHARMA ENGLISHCHAPTER - DATA HANDLING-I (CLASSIFICATION AND TABULATION DATA)EXERCISE - All Questions
27 Videos
- DATA HANDLING-III (PIE CHARTS OR CIRCLE GRAPHS)BOOK - RD SHARMA ENGLISHCHAPTER - DATA HANDLING-III (PIE CHARTS OR CIRCLE GRAPHS)EXERCISE - All Questions
37 Videos
Similar Questions
Below is the histogram depicting marks obtained by 43 students of a class: 1. Write the number of students getting the highest marks. 2. What is the class size?
View SolutionThe table shows the marks obtained by 25 students in a class test. Find the mean of the marks obtained

View SolutionIn a Mathematics test, the following marks were obtained by 40 students. Arrange these marks in a table using tally marks.(a) Find how many students obtained marks equal to or more than 7.(b) How many students obtained marks below 4?
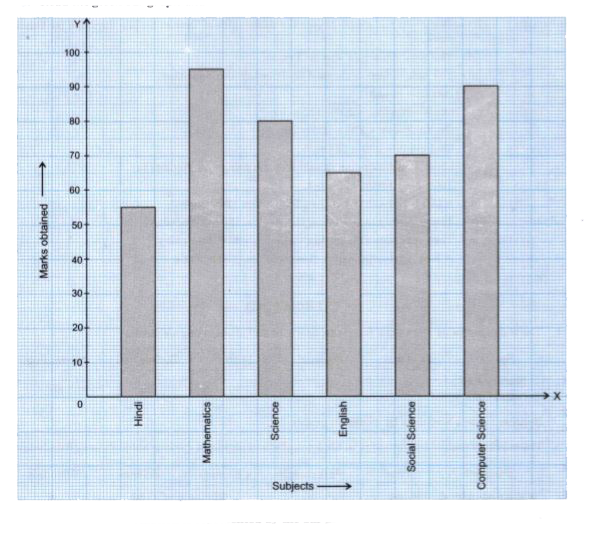
View SolutionRead the given bar graph and answer the question that follow :

How many marks were obtained in English?
View SolutionThe number of hours television watched in a day by the students of a particular class during holidays is shown in the following histogram: Look at the histogram and answer the following questions: 1. For how many hours the maximum number of students watch TV? 2. How many students watch TV for less than 4 hours? 3. How many students spend more than 5 hours in watching TV?
View SolutionIn a class of 40 students, the marks obtained (out of 50) are as given below:

Draw a histogram to represent the given data.
View SolutionThe following pie-chart gives the marks scored in an examination by a student in various subjects. If the total marks obtained by the student were 540, answer the following questions.
View SolutionDraw a histogram for the marks of students given below:

View SolutionDraw a histogram for the marks of students given below:

View SolutionIf for somex∈R, the frequency distribution of the marks obtained by 20 students in a test is:

Then the mean of the marks is:
View Solution
