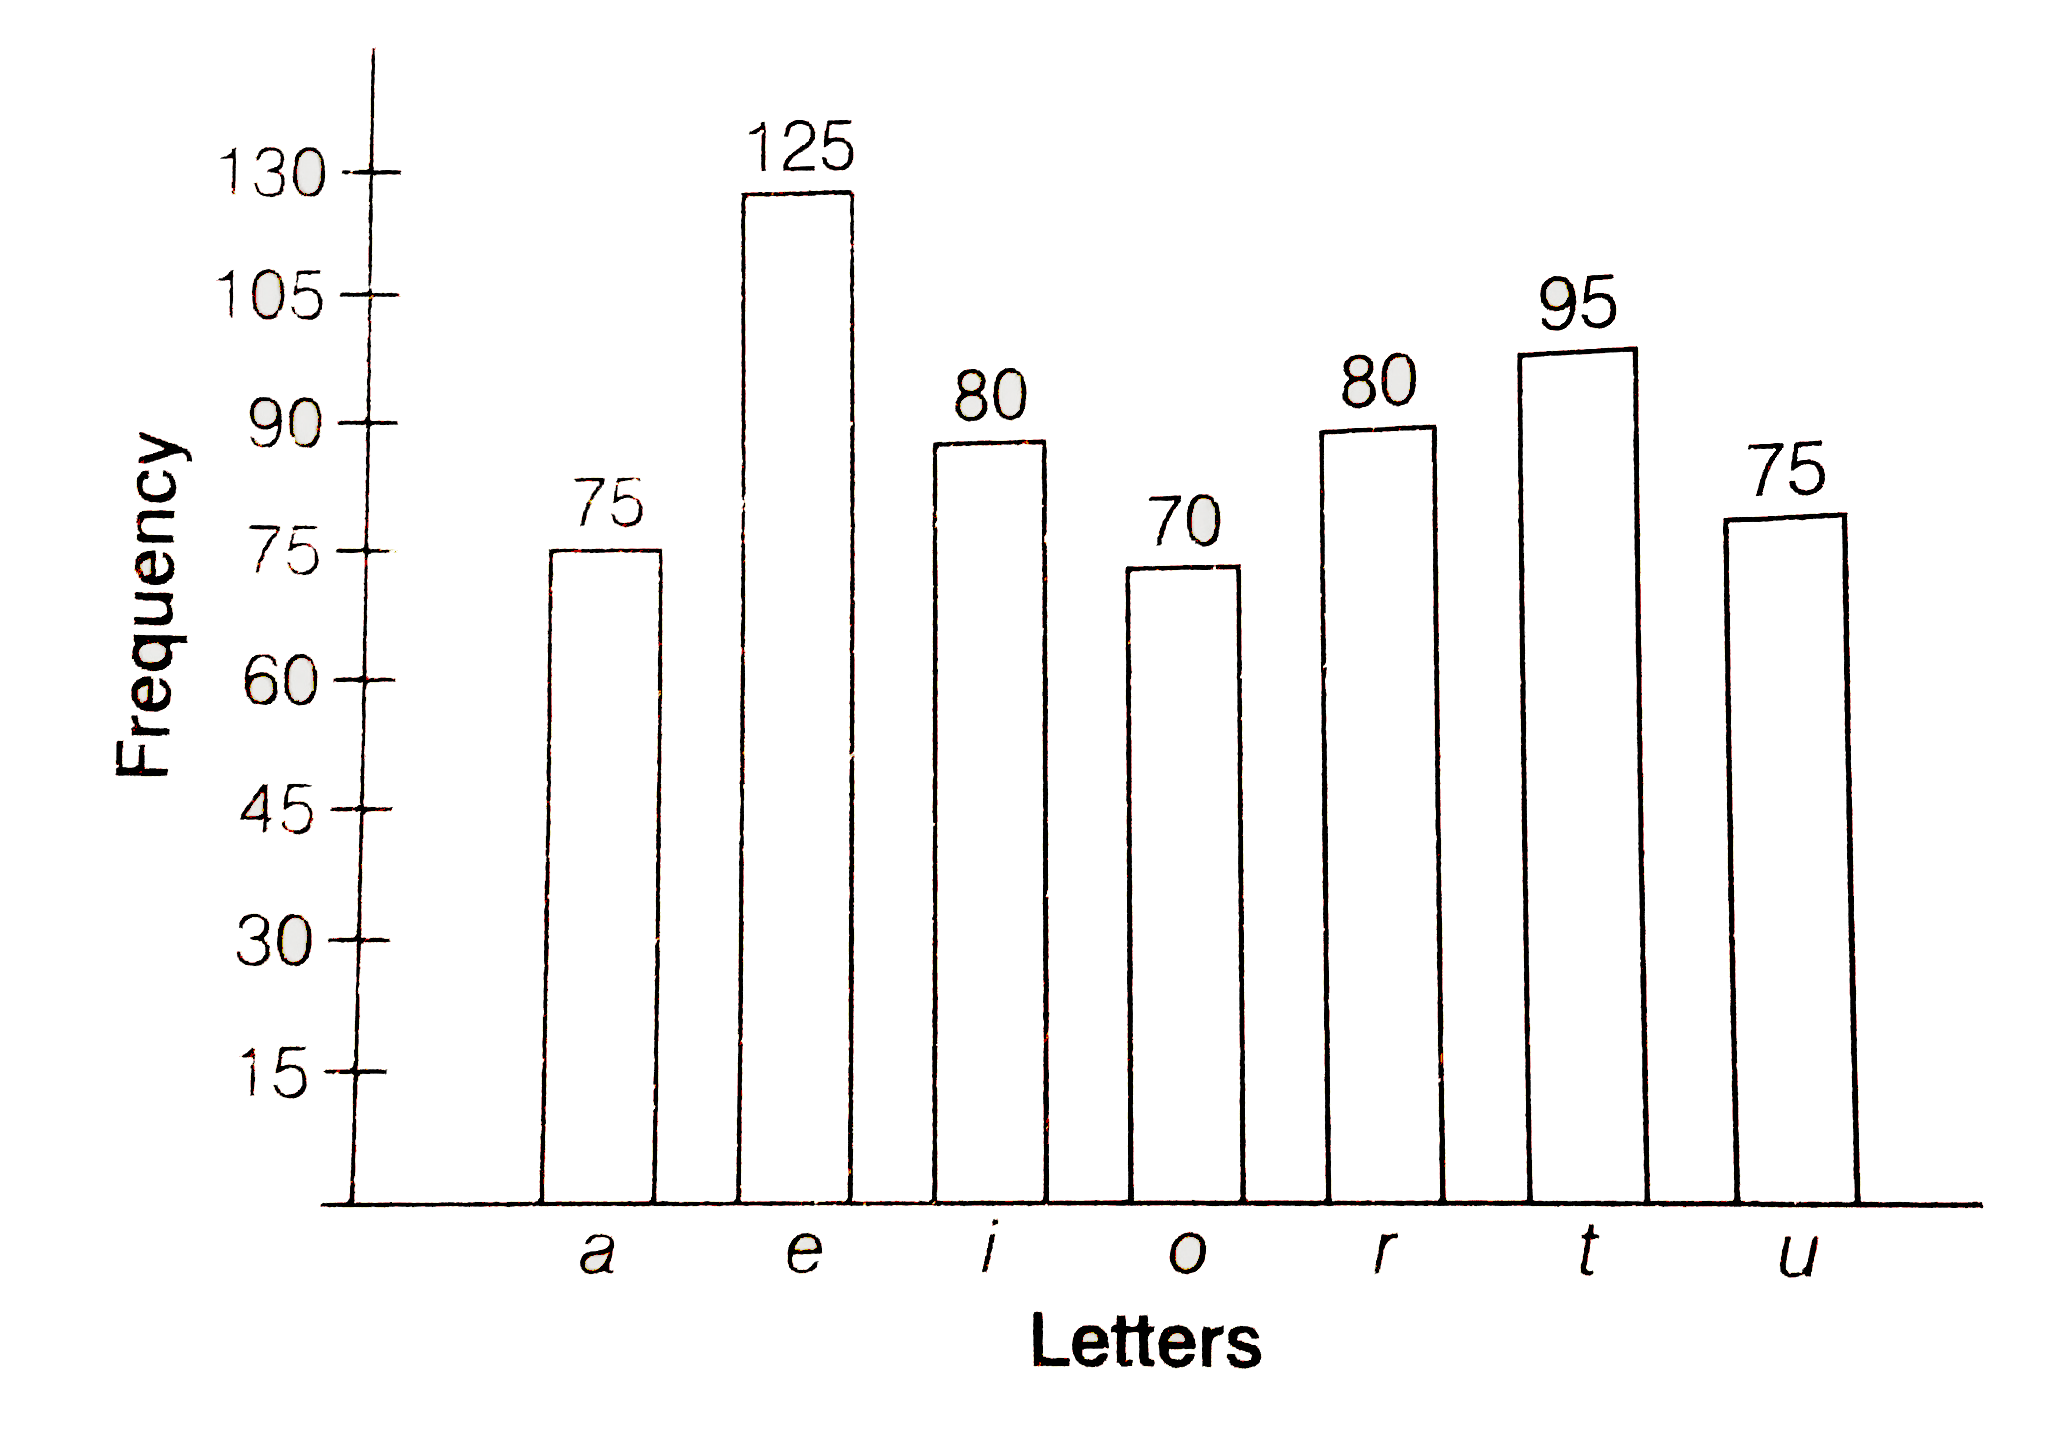
The following table gives the frequencies of most commonly used letters a,e,I,o,r,t,u, from a page of a book

Represent the information above by a bar graph.
We draw bar graph of this data in the followng steps.
Step I We represent the letters (variables) on the horizontal axis choosing any scale, as the width of the bar is not important. But for clarity, we take equal widths for all bars and maintain equal gaps in between them. Let one letter be represented by one unit.
Step II. We represent the letters on the vertical axis, Since, the maximum frequency is 125, we can choose the scale as 1 unit = 15 frequency.
Step III To represent our first letter, i.e., a, we draw a rectangular bar with width 1 unit and height 5 units.
Step IV Similarly, other heads are represented by leaving a gap of 12 unit in between two consecutive bars.

Topper's Solved these Questions
- STATISTICS AND PROBABILITYBOOK - NCERT EXEMPLAR ENGLISHCHAPTER - STATISTICS AND PROBABILITYEXERCISE - LONG ANSWER TYPE QUESTIONS
12 Videos
- STATISTICS AND PROBABILITYBOOK - NCERT EXEMPLAR ENGLISHCHAPTER - STATISTICS AND PROBABILITYEXERCISE - VERY SHORT ANSWER TYPES QUESTIONS
10 Videos
- QUADRILATERALS BOOK - NCERT EXEMPLAR ENGLISHCHAPTER - QUADRILATERALS EXERCISE - LONG ANSWER TYPE QUESTIONS
18 Videos
- TRIANGLESBOOK - NCERT EXEMPLAR ENGLISHCHAPTER - TRIANGLESEXERCISE - LONG ANSWER TYPE QUESTIONS
21 Videos
Similar Questions
The following table gives the distribution of students of two sections according to the marks obtained by them

Represent the marks of the students of both the sections on the same graph by two frquency polygons. From the two polygons compare the performance of the two sections.
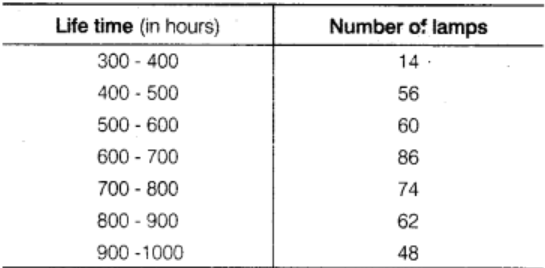
View SolutionThe following table gives the life times of 400 neon lamps:
(i) Represent the given information with the help of histogram.
(ii) How many lamps have a life time of more than 700 hours?

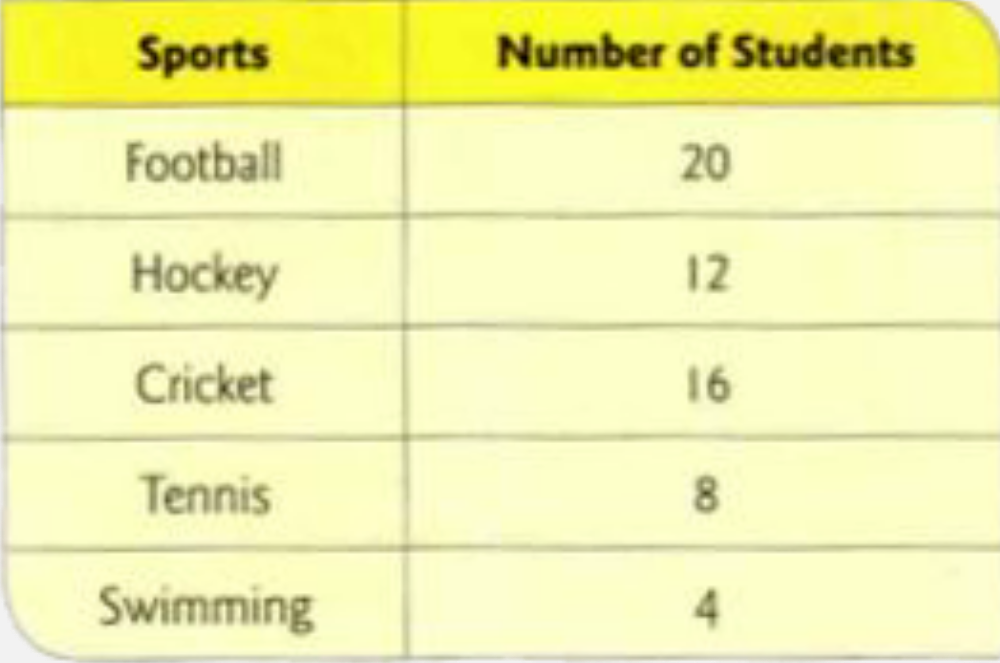
View SolutionFollowing table represents the data collected from a group of children who were asked about their favourite sports. Represent the data as a bar graph.

View SolutionThe folliwng table shows the mode of transport used by boys and girls for going to the same school.

Draw a double bar graph representing the above data.
View SolutionThe following table gives the height of five trees in a garden.

If the given data has to be represented as a bar graph, then select the most appropriate scale from the given options that can be used to draw the bar graph.
1 unit = 20 trees
View SolutionThe following table gives the height of five trees in a garden.
<
If the given data has to be represented as a bar graph, then select the most appropriate scale from the given options that can be used to draw the bar graph.
1 unit = 1 trees
View SolutionThe following table gives the height of five trees in a garden.

If the given data has to be represented as a bar graph, then select the most appropriate scale from the given options that can be used to draw the bar graph.
1 unit = 5 trees
View SolutionThe following table gives the height of five trees in a garden.

If the given data has to be represented as a bar graph, then select the most appropriate scale from the given options that can be used to draw the bar graph.
1 unit = 8 trees
View SolutionThe following data shows the average age of men in various countries in a certain year: Country India Nepal China Pakistan U.K. U.S.A. Average age (in years) 55 52 60 50 70 75 Represent the above information by a bar graph.
View SolutionThe heights of 50 students, measured to the nearest centimetres have been found to be as follows:

(i) Represent the data given above by a grouped frequency distribution table, taking class intervals as 160-165, 165-170 etc.
(ii) What can you conclude about their heights from the table ?
View Solution
