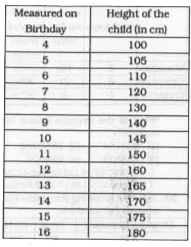
The following table gives the growth chart of a child.

Draw a line graph for the above data and answer the questions that follow :
(i) What was the height of the child at the age of 5 years ?
(ii) How much taller was the child at the age of 10 than at the age of 6 ?
(iii) Between which two consecutive periods did the child grow faster ?
Step by step video & image solution for The following table gives the growth chart of a child. Draw a line graph for the above data and answer the questions that follow : (i) What was the height of the child at the age of 5 years ? (ii) How much taller was the child at the age of 10 than at the age of 6 ? (iii) Between which two consecutive periods did the child grow faster ? by Maths experts to help you in doubts & scoring excellent marks in Class 8 exams.
Updated on:21/07/2023Topper's Solved these Questions
- LINE GRAPHS AND LINEAR GRAPHSBOOK - RS AGGARWALCHAPTER - LINE GRAPHS AND LINEAR GRAPHSEXERCISE - Exercise 23
25 Videos
- INTRODUCTION TO COORDINATE GEOMETRYBOOK - RS AGGARWALCHAPTER - INTRODUCTION TO COORDINATE GEOMETRYEXERCISE - EXERCISE B (OBJECTIVE QUESTIONS)
7 Videos
- LINEAR EQUATIONSBOOK - RS AGGARWALCHAPTER - LINEAR EQUATIONSEXERCISE - TEST PAPER-8 (D) (Write .T. for true and .F. for false for each of the following:)
1 Video
Similar Questions
The following table gives the growth chart of a child.

Draw a line graph for the table and answer the questions that follow.
(a) What is the height at the age of 5 years?
(b) How much taller was the child at the age of 10 than at the age of 6 ?
(c) Between which two consecutive periods did the child grow more faster ?
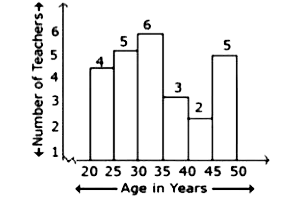
View SolutionStudy the following graph and answer the question based on the graph.

What percentage of the total number of teachers are aged less than 45 years?
View Solution
Knowledge Check
Fictional world of a child starts at the age of
A5−6B6−8C3−4D4−5Refer the following data table and answer the question.

What was the increase in the height of the child from the 10th Birthday to the 11th Birthday ?A15 cmB10 cmC5 cmD4 cmThe sum of the ages of 5 children born at intervals of 3 years each is 50 years. What is the age of the youngest child?
A4 yearsB8 yearsC10 yearsD6 years
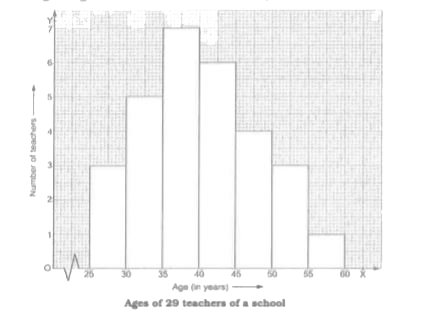
Look at the histogram given below answer the question that follow:

(i) What information in being given by the histogram?
(ii) How many teachers are of age less than 45 years?
(iii) How many teachers are of age 40 years or more but less than 55 years?
View SolutionThe sum of the ages of 4 children born at the intervals of 4 yr is 48. Find the age of the youngest child.
View SolutionFirst triple antigen vaccination is given to the child at the age of
View SolutionThe sum of the ages of 5 children born at the intervals of 3 years each is 50 years. What is the age of the youngest child ?
View SolutionThe sum of the ages of 3 children born at the intervals of 3 yr each is 50 yr. What is the age of the youngest child?
View Solution
