The following table gives the height of five trees in a garden.

If the given data has to be represented as a bar graph, then select the most appropriate scale from the given options that can be used to draw the bar graph.
1 unit = 20 trees
Step by step video & image solution for The following table gives the height of five trees in a garden. If the given data has to be represented as a bar graph, then select the most appropriate scale from the given options that can be used to draw the bar graph. 1 unit = 20 trees by Maths experts to help you in doubts & scoring excellent marks in Class 7 exams.
Topper's Solved these Questions
- BOOK - ICSECHAPTER - DATA HANDLING AND MEASURES OF CENTRAL TENDENCYEXERCISE - REVISION EXERCISE39videos
DATA HANDLING AND MEASURES OF CENTRAL TENDENCY
- BOOK - ICSECHAPTER - DATA HANDLING AND MEASURES OF CENTRAL TENDENCYEXERCISE - WARM-UP EXERCISE5videos
DATA HANDLING AND MEASURES OF CENTRAL TENDENCY
- BOOK - ICSECHAPTER - DATA HANDLING AND MEASURES OF CENTRAL TENDENCYEXERCISE - EXERCIES 18.137videos
DATA HANDLING AND MEASURES OF CENTRAL TENDENCY
- BOOK - ICSECHAPTER - CONSTRUCTIONS EXERCISE - REVISION EXERCISE12videos
CONSTRUCTIONS
- BOOK - ICSECHAPTER - DATA HANDLING EXERCISE - EXERCISE 24D13videos
DATA HANDLING
Similar Questions
The following table gives the height of five trees in a garden.
<
If the given data has to be represented as a bar graph, then select the most appropriate scale from the given options that can be used to draw the bar graph.
1 unit = 1 treesView SolutionThe following table gives the height of five trees in a garden.

If the given data has to be represented as a bar graph, then select the most appropriate scale from the given options that can be used to draw the bar graph.
1 unit = 5 treesView SolutionThe following table gives the height of five trees in a garden.

If the given data has to be represented as a bar graph, then select the most appropriate scale from the given options that can be used to draw the bar graph.
1 unit = 8 treesView SolutionFollowing table represents the lengths of six different ribbons.

f the given data has to be represented as a bar graph, then select the most appropriate scale from the given options that can be used to draw the bar graph.
1 unit = 1 cmView SolutionFollowing table represents the lengths of six different ribbons.

f the given data has to be represented as a bar graph, then select the most appropriate scale from the given options that can be used to draw the bar graph.
1 unit = 5 cmView SolutionFollowing table represents the lengths of six different ribbons.

f the given data has to be represented as a bar graph, then select the most appropriate scale from the given options that can be used to draw the bar graph.
1 unit = 3 cmView SolutionFollowing table represents the lengths of six different ribbons.

f the given data has to be represented as a bar graph, then select the most appropriate scale from the given options that can be used to draw the bar graph.
1 unit = 10 cmView SolutionDraw a bar graph from the following data:
 View Solution
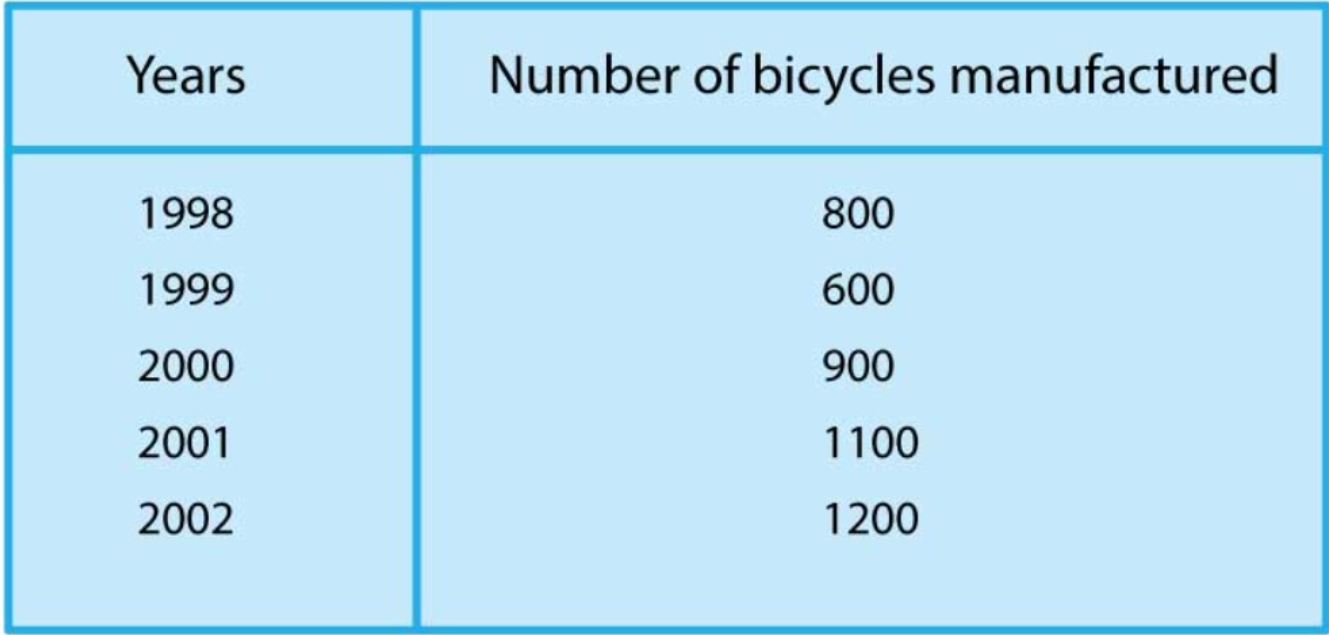
Following table shows the number of bicycles manufactured in a factory during the years 1998 to 2002. Illustrate this data using a bar graph. Choose a scale of your choice
 View Solution
The following table shows the favourite sports of 250 students of a school. Represent the data by a bar graph.
View Solution

