The given bar graph represents the sale of cars in five different states in a month.
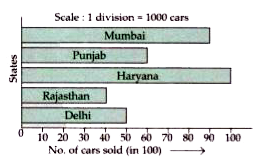
Which state sold maximum number of cars ?
The correct Answer is:Haryana
Step by step video & image solution for The given bar graph represents the sale of cars in five different states in a month. Which state sold maximum number of cars ? by Maths experts to help you in doubts & scoring excellent marks in Class 6 exams.
Updated on:21/07/2023Topper's Solved these Questions
- DATA HANDLING BOOK - MTG IIT JEE FOUNDATIONCHAPTER - DATA HANDLING EXERCISE - Solved Examples
37 Videos
- DATA HANDLING BOOK - MTG IIT JEE FOUNDATIONCHAPTER - DATA HANDLING EXERCISE - NCERT Section (Exercise 9.1)
22 Videos
- BASIC GEOMETRICAL IDEASBOOK - MTG IIT JEE FOUNDATIONCHAPTER - BASIC GEOMETRICAL IDEASEXERCISE - OLYMPIAD/HOTS CORNER
10 Videos
- DECIMALSBOOK - MTG IIT JEE FOUNDATIONCHAPTER - DECIMALSEXERCISE - OLYMPIAD/HOTS CORNER
20 Videos
Similar Questions
The given bar graph represents the sale of cars in five different states in a month.
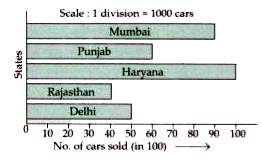
Which state sold 5000 cars ?
View SolutionThe given bar graph represents the sale of cars in five different states in a month.
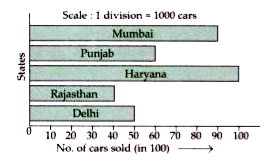 What is the difference between the numbre of cars sold in Mumbai and Punjab ?
View Solution
Knowledge Check
The given bar graph represents the number of boys and girls in five different schools. Study the graph and answer the question that follows
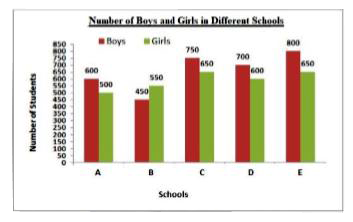
In which school is the percentage of girls the lowest ?AABBCEDCThe Bar graph given below presents the number of cars parked on ten different days in a parking area
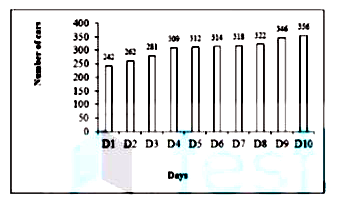
What is the total number of cars parked on all the ten days in the parking area ?AA) 3862BB) 3062CC) 3462DD) 3882The Bar graph given below presents the number of cars parked on ten different days in a parking area
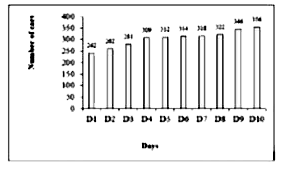
Number of cars parked on D10 how much percentage (correct up to two decimal places) more the number of cars parked on DI ?AA) 52.11%BB) 42.11%CC) 57.11%DD) 47.11%
The given bar graph shows the sale of different brands of shirts in a shop in one month.
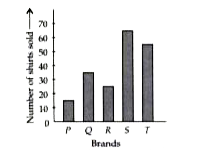
Find the ratio of number of shirts sold of brand S to the number of shirts sold or brand P and R together.
{ ((a),8:9),((b)13:8),((c )11:7),((d)13:6): }
View SolutionThe given bar graph shows the sale of different brands of shirts in a shop in one month.

(i) How many total shirts are sold in the month ?
View SolutionThe following pictograph shows the sale of cars of different colours in a showroom.
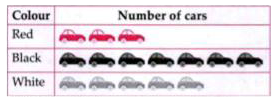

The ratio of white cars to black cars sold is
View SolutionThe given bar graph presents the sales of a particular brand of car by three showrooms, A,B and C during the months Jan,Feb ,Mar and Apr 2016
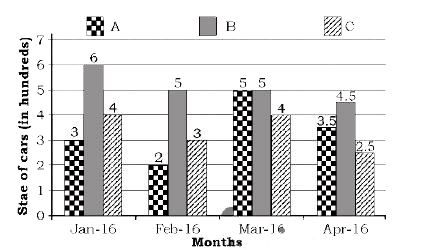
If the cars sold by A and B are all found to be in perfect order, but the cars sold by C were found to be defective to the extent of 15%,10% and 8% and 6% respectively in Jan,Mar and Apr 2016 What is the percentage of defective cars sold by all showrooms during Apr 2016?
View SolutionThe Bar graph given below presentes the number of cars parked on ten different days in a parking area.
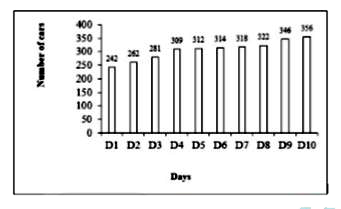
What is the difference in the number of cars parked on D3 and D8 ?
View Solution
