The given bar graph shows the number of cars sold from Jan to Dec.
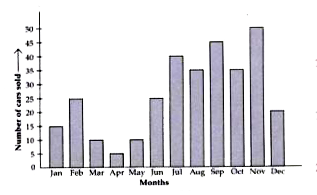
How many cars were sold in the last quarter of the year?
280
130
140
105
The correct Answer is:D
Step by step video & image solution for The given bar graph shows the number of cars sold from Jan to Dec. How many cars were sold in the last quarter of the year? by Maths experts to help you in doubts & scoring excellent marks in Class 6 exams.
Topper's Solved these Questions
- BOOK - MTG IIT JEE FOUNDATIONCHAPTER - DATA HANDLING EXERCISE - Exercise (Multiple Choice Questions) Level -216videos
DATA HANDLING
- BOOK - MTG IIT JEE FOUNDATIONCHAPTER - DATA HANDLING EXERCISE - Exercise (Match the following)2videos
DATA HANDLING
- BOOK - MTG IIT JEE FOUNDATIONCHAPTER - DATA HANDLING EXERCISE - NCERT Section (Exercise 9.4)4videos
DATA HANDLING
- BOOK - MTG IIT JEE FOUNDATIONCHAPTER - BASIC GEOMETRICAL IDEASEXERCISE - OLYMPIAD/HOTS CORNER10videos
BASIC GEOMETRICAL IDEAS
- BOOK - MTG IIT JEE FOUNDATIONCHAPTER - DECIMALSEXERCISE - OLYMPIAD/HOTS CORNER20videos
DECIMALS
Similar Questions
Direction: The given bar graph shows the number of pens sold by two shops A & B in four consecutive months. Study the following data and answer the following questions:
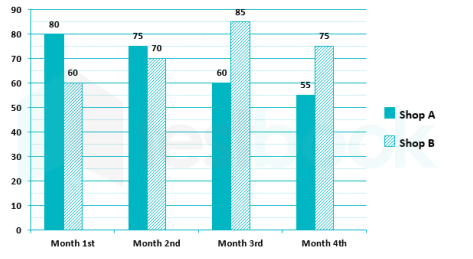
Find that the number of pens sold by shop A in 1st month is how much percent more than the number of pens sold by shop A in 3rd month.View SolutionThe following pictograph shows the sale of cars of different colours in a showroom.
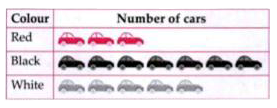

How many less blue cars were sold than red and gray cars together?View Solution
Knowledge Check
- Question 1 - Select One
If the number of cars sold of model D is 40500, then how many more cars of model E are sold than that of A?
A8100B16200C24300D13500 - Question 2 - Select One
The pie chart given below shows sale of different types of cars in a city for a given year. The total sale of cars in the city is 600000.
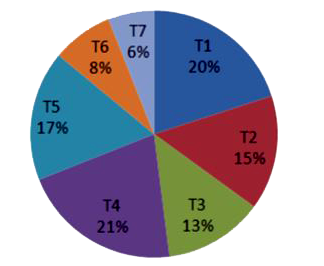
How many T4 cars are sold in the city for the given year?A144000B138000C126000D128000 - Question 3 - Select One
The bar chart given below shows the number of cars sold by brand A and B for the year for 2008 to 2016
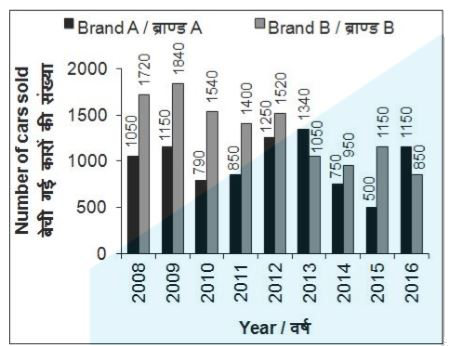
In how many years, the number of cars sold by brand A is more than the number of cars sold by brand B?A1B2C3D5
The bar graph shows the number of cycles sold by a distributor in each month from January to June. Whatis the increase in the number of cycles sold in April as compared to March?
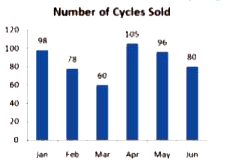 View Solution
The bar graph shows the number of cycles sold by a distributor in each month from January to June. Whatis the increase in the number of cycles sold in April as compared to March ?
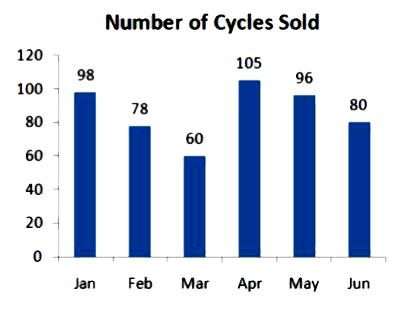 View Solution
The bar graph shows the number of cycles sold by a distributor in each month from January to June. Whatis the increase in the number of cycles sold in April as compared to March ?
 View Solution
The bar graph shows the number of paintings sold by an art gallery in each month from January to June. How many paintings does it need to sell in July for the 7 month average to be 90?
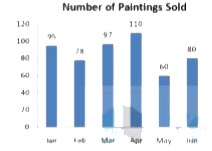 View Solution
The bar chart given below shows the number of cars sold by brand A and B for the year for 2008 to 2016
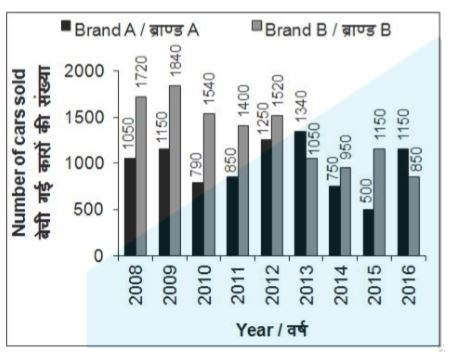
The total sales of the two brands in year 2015 is what percent of the total sales in 2016?View Solution
