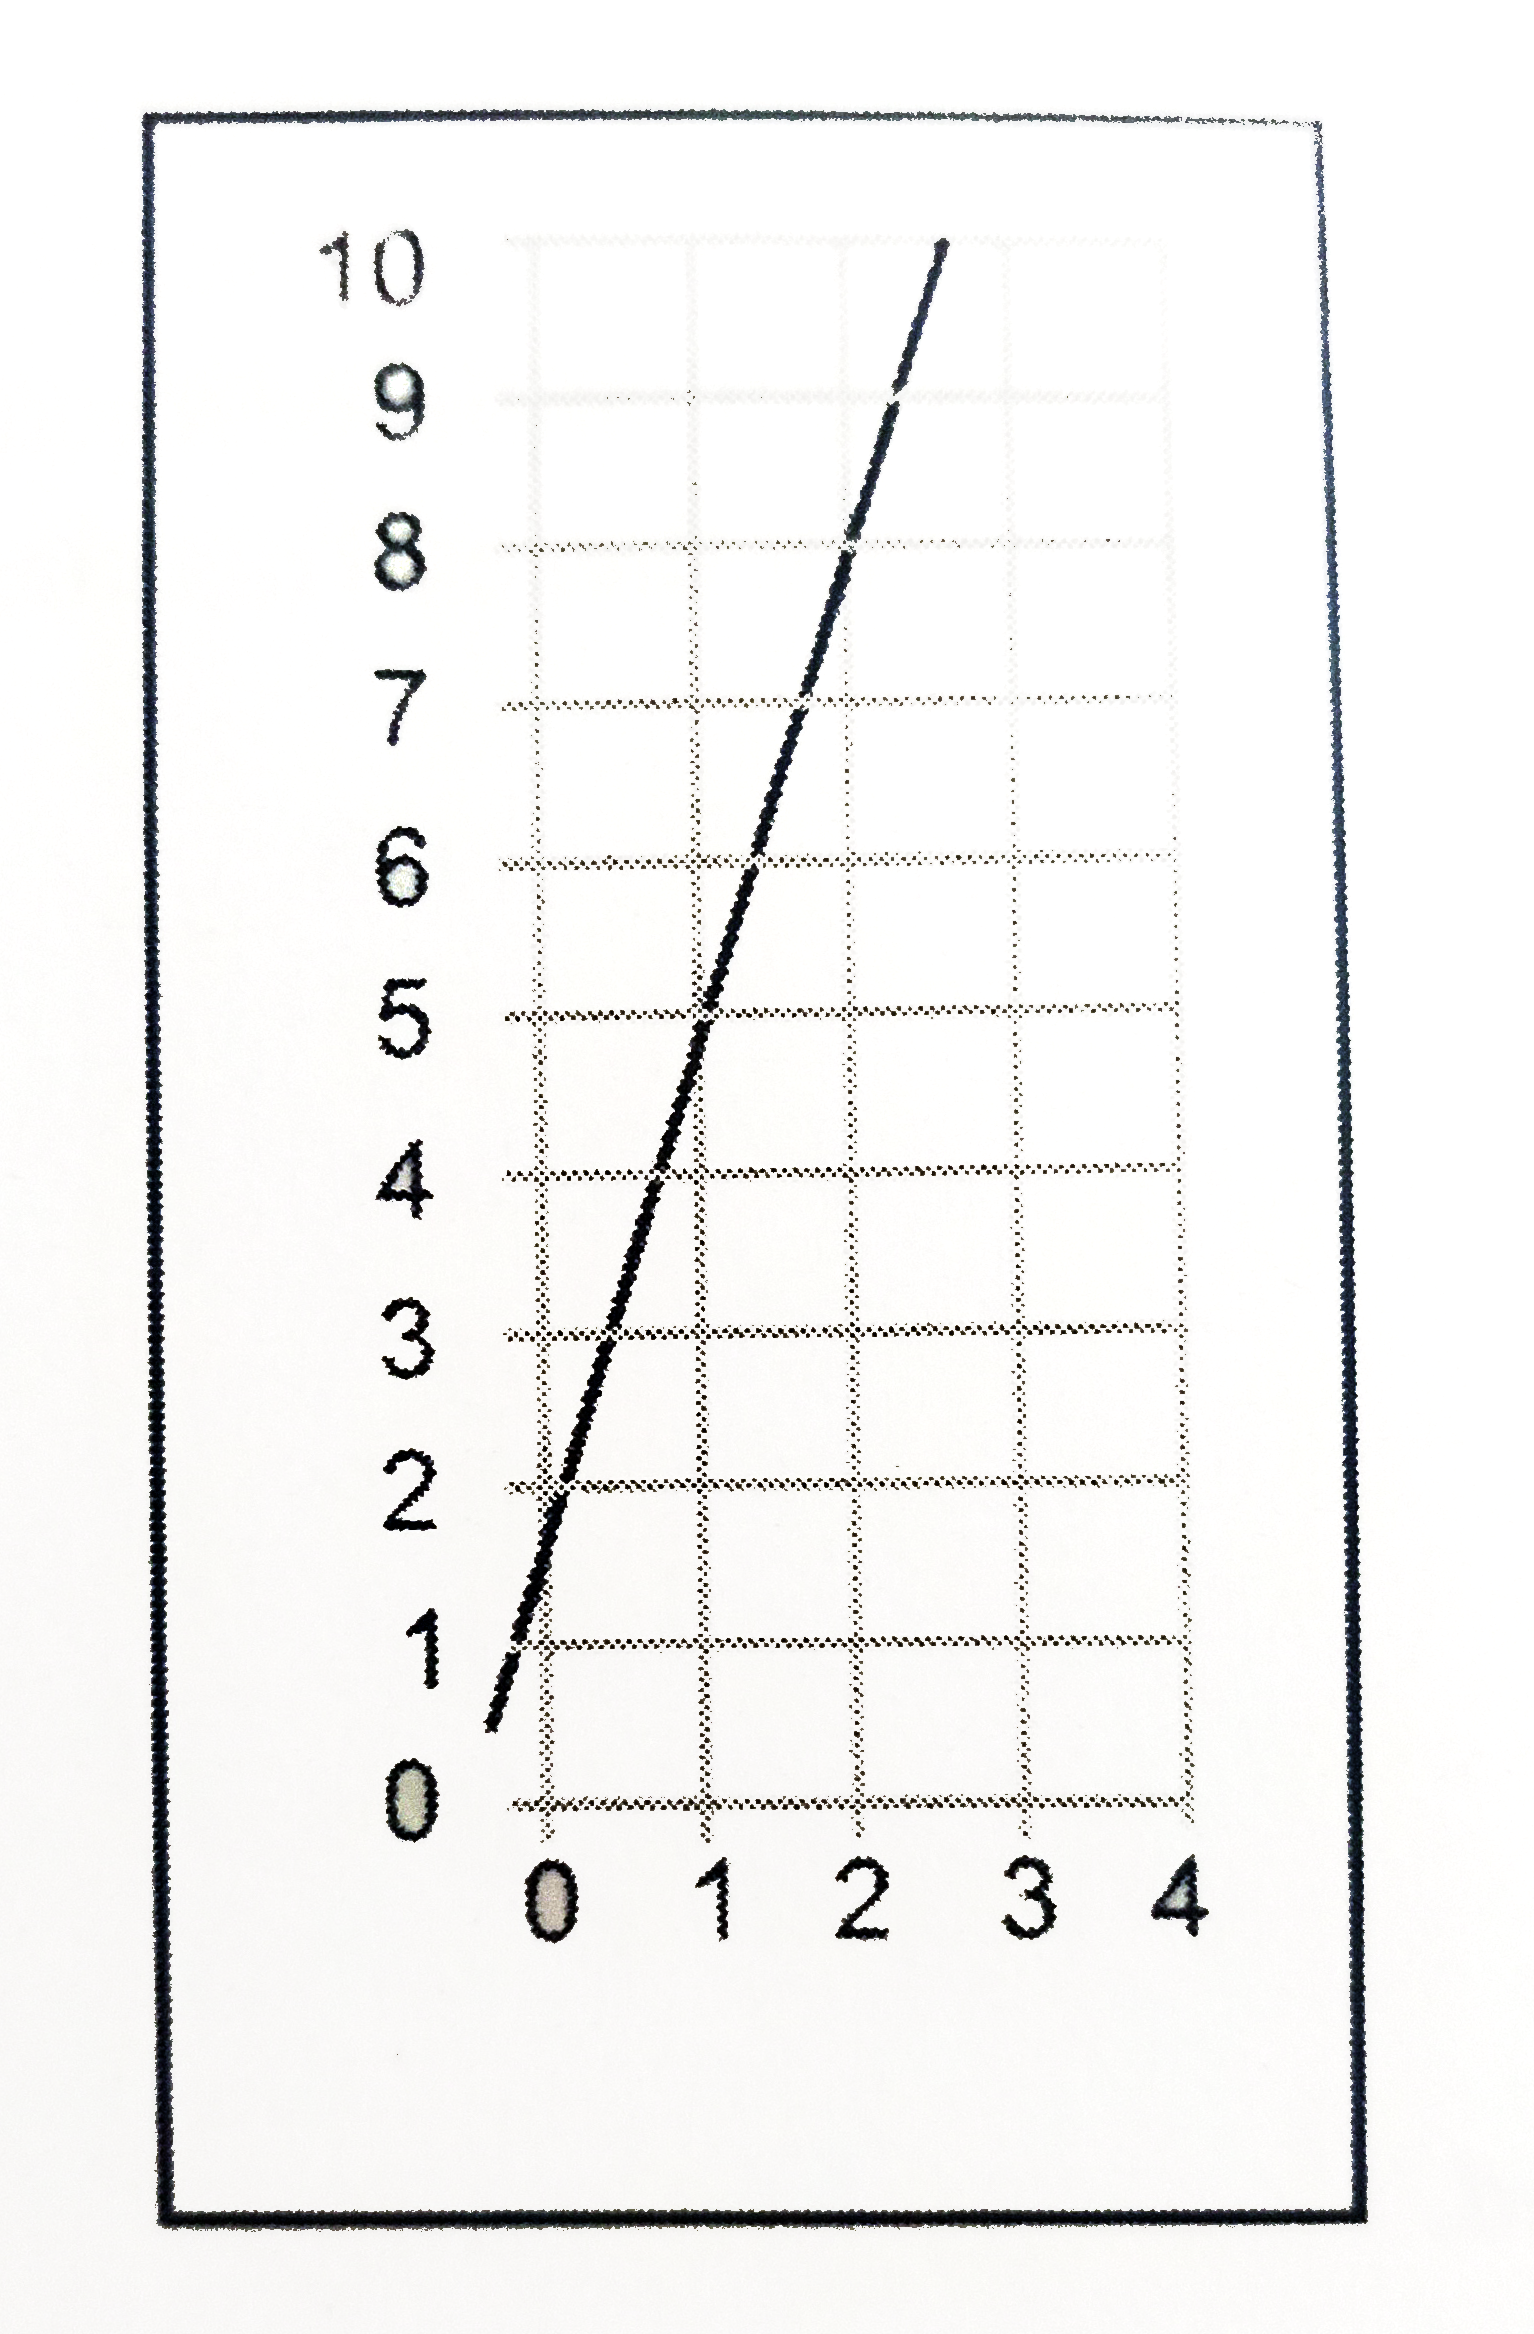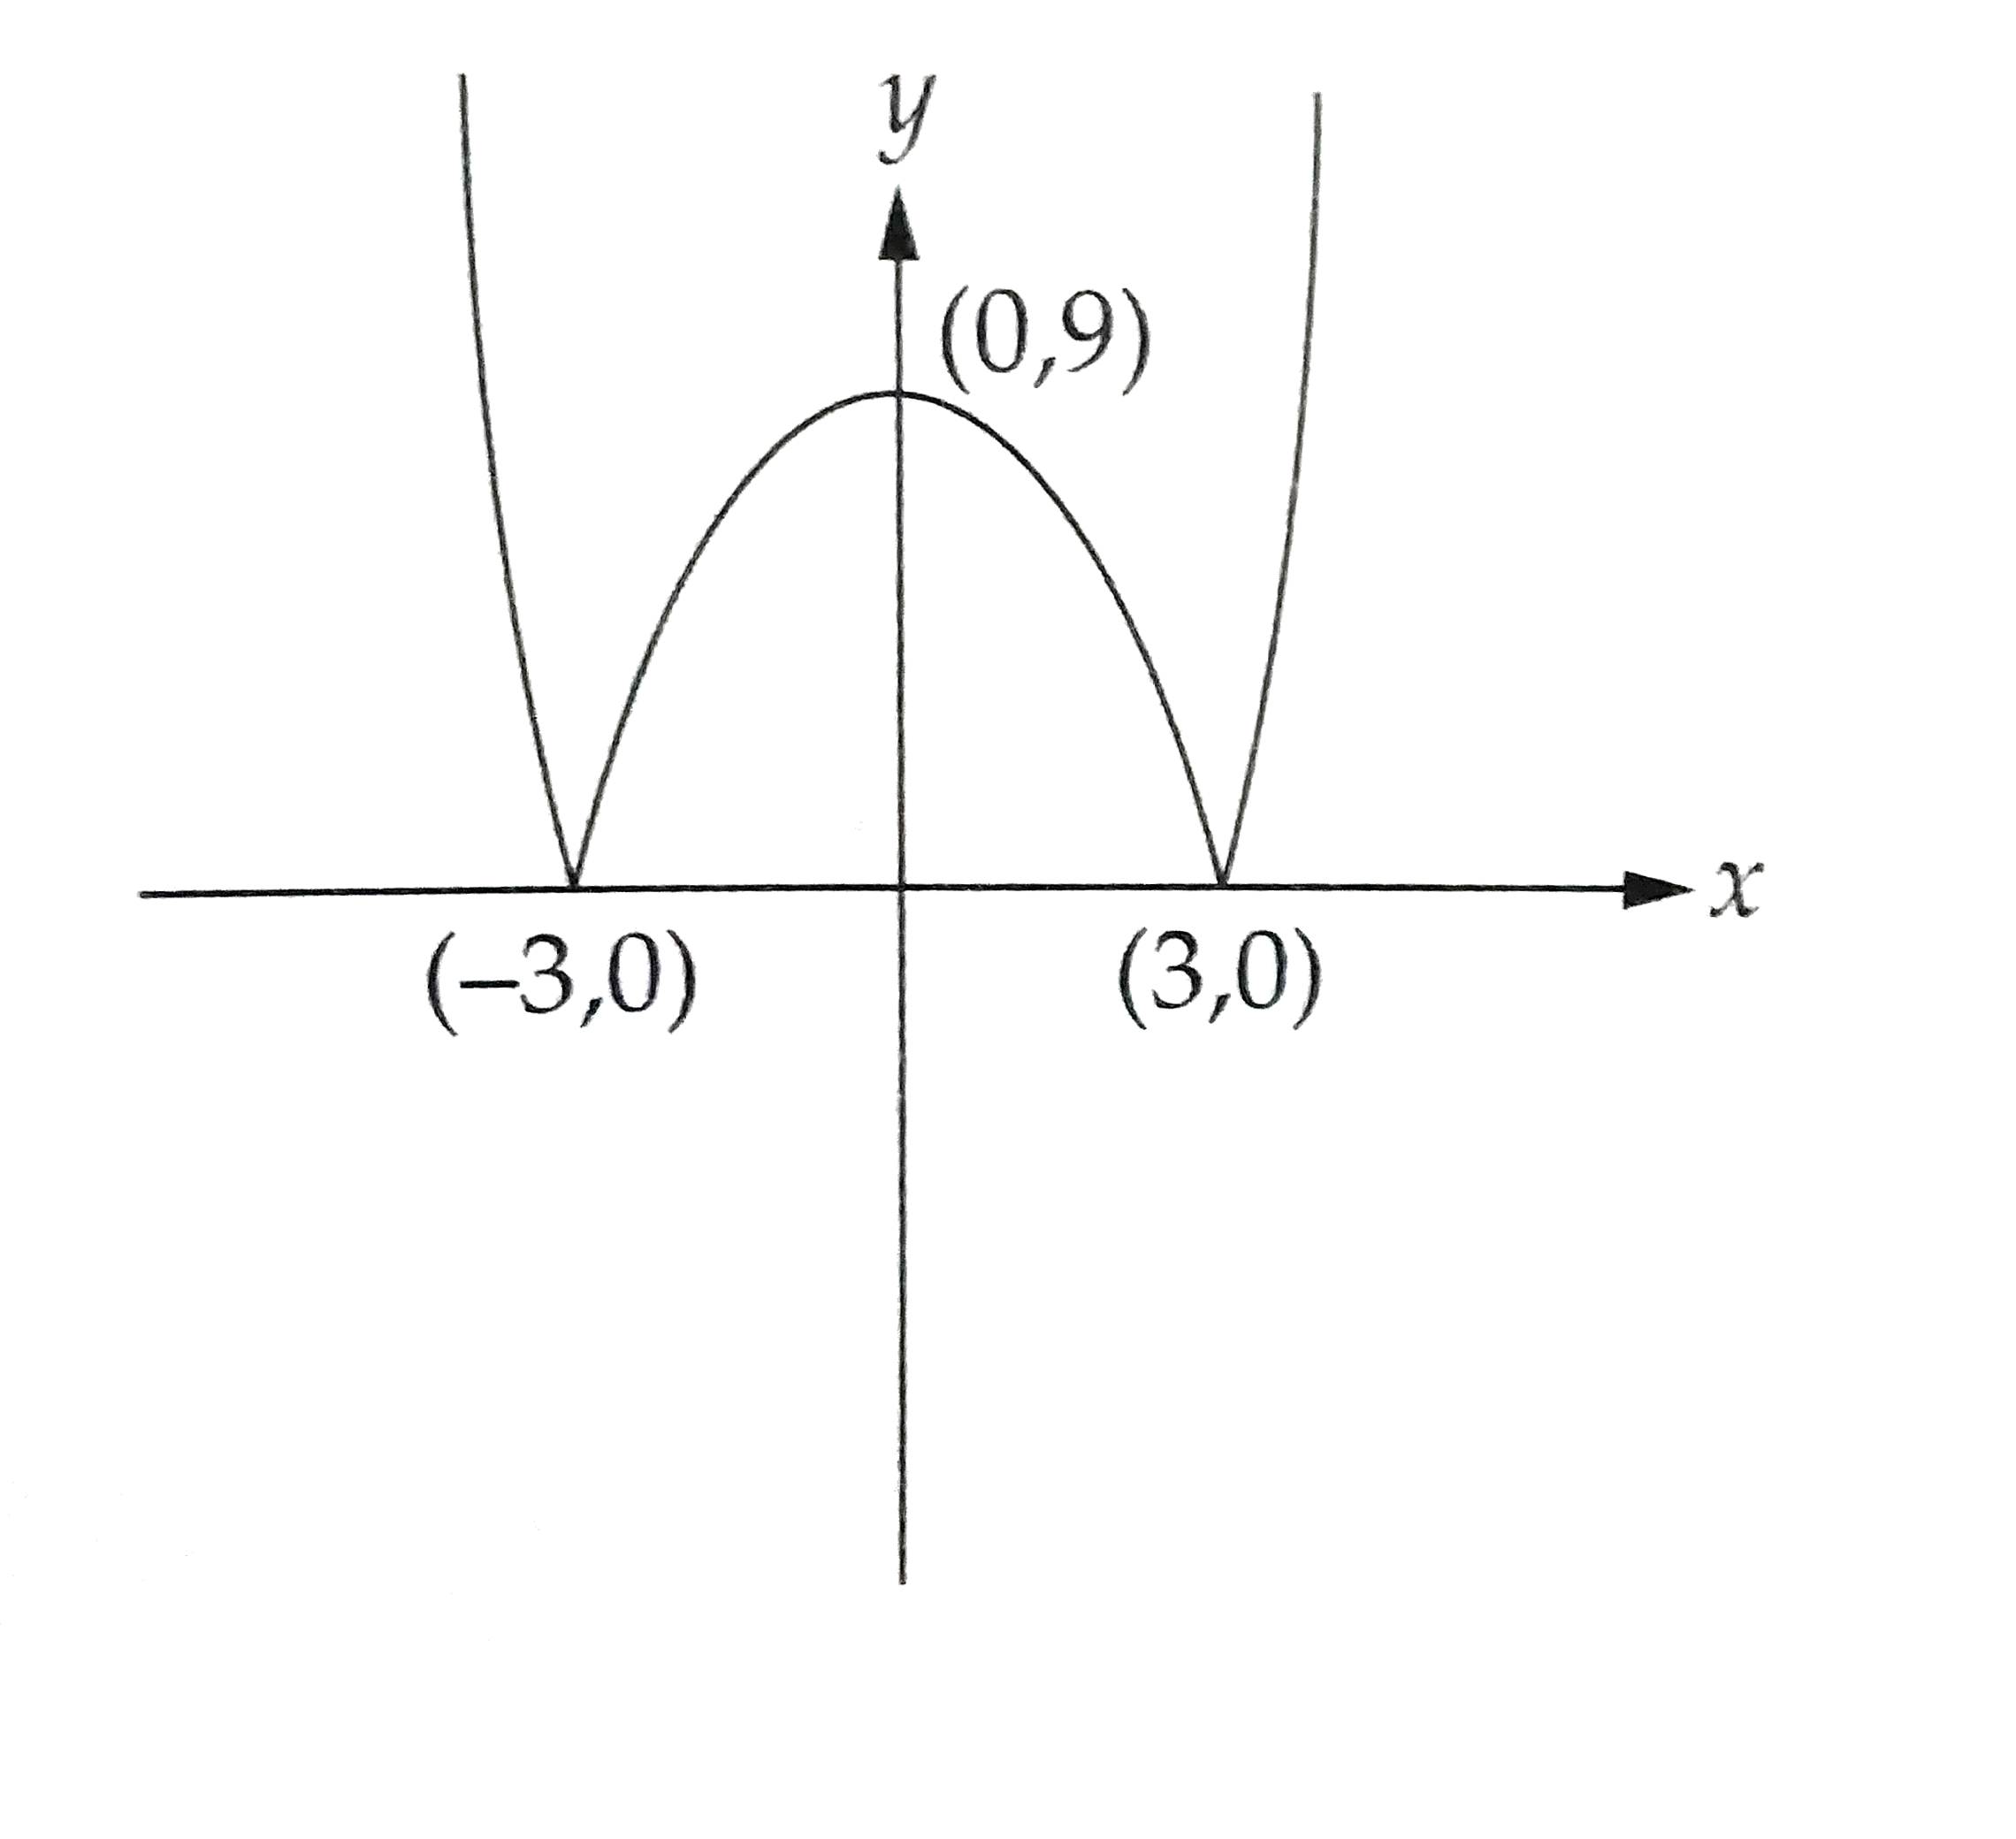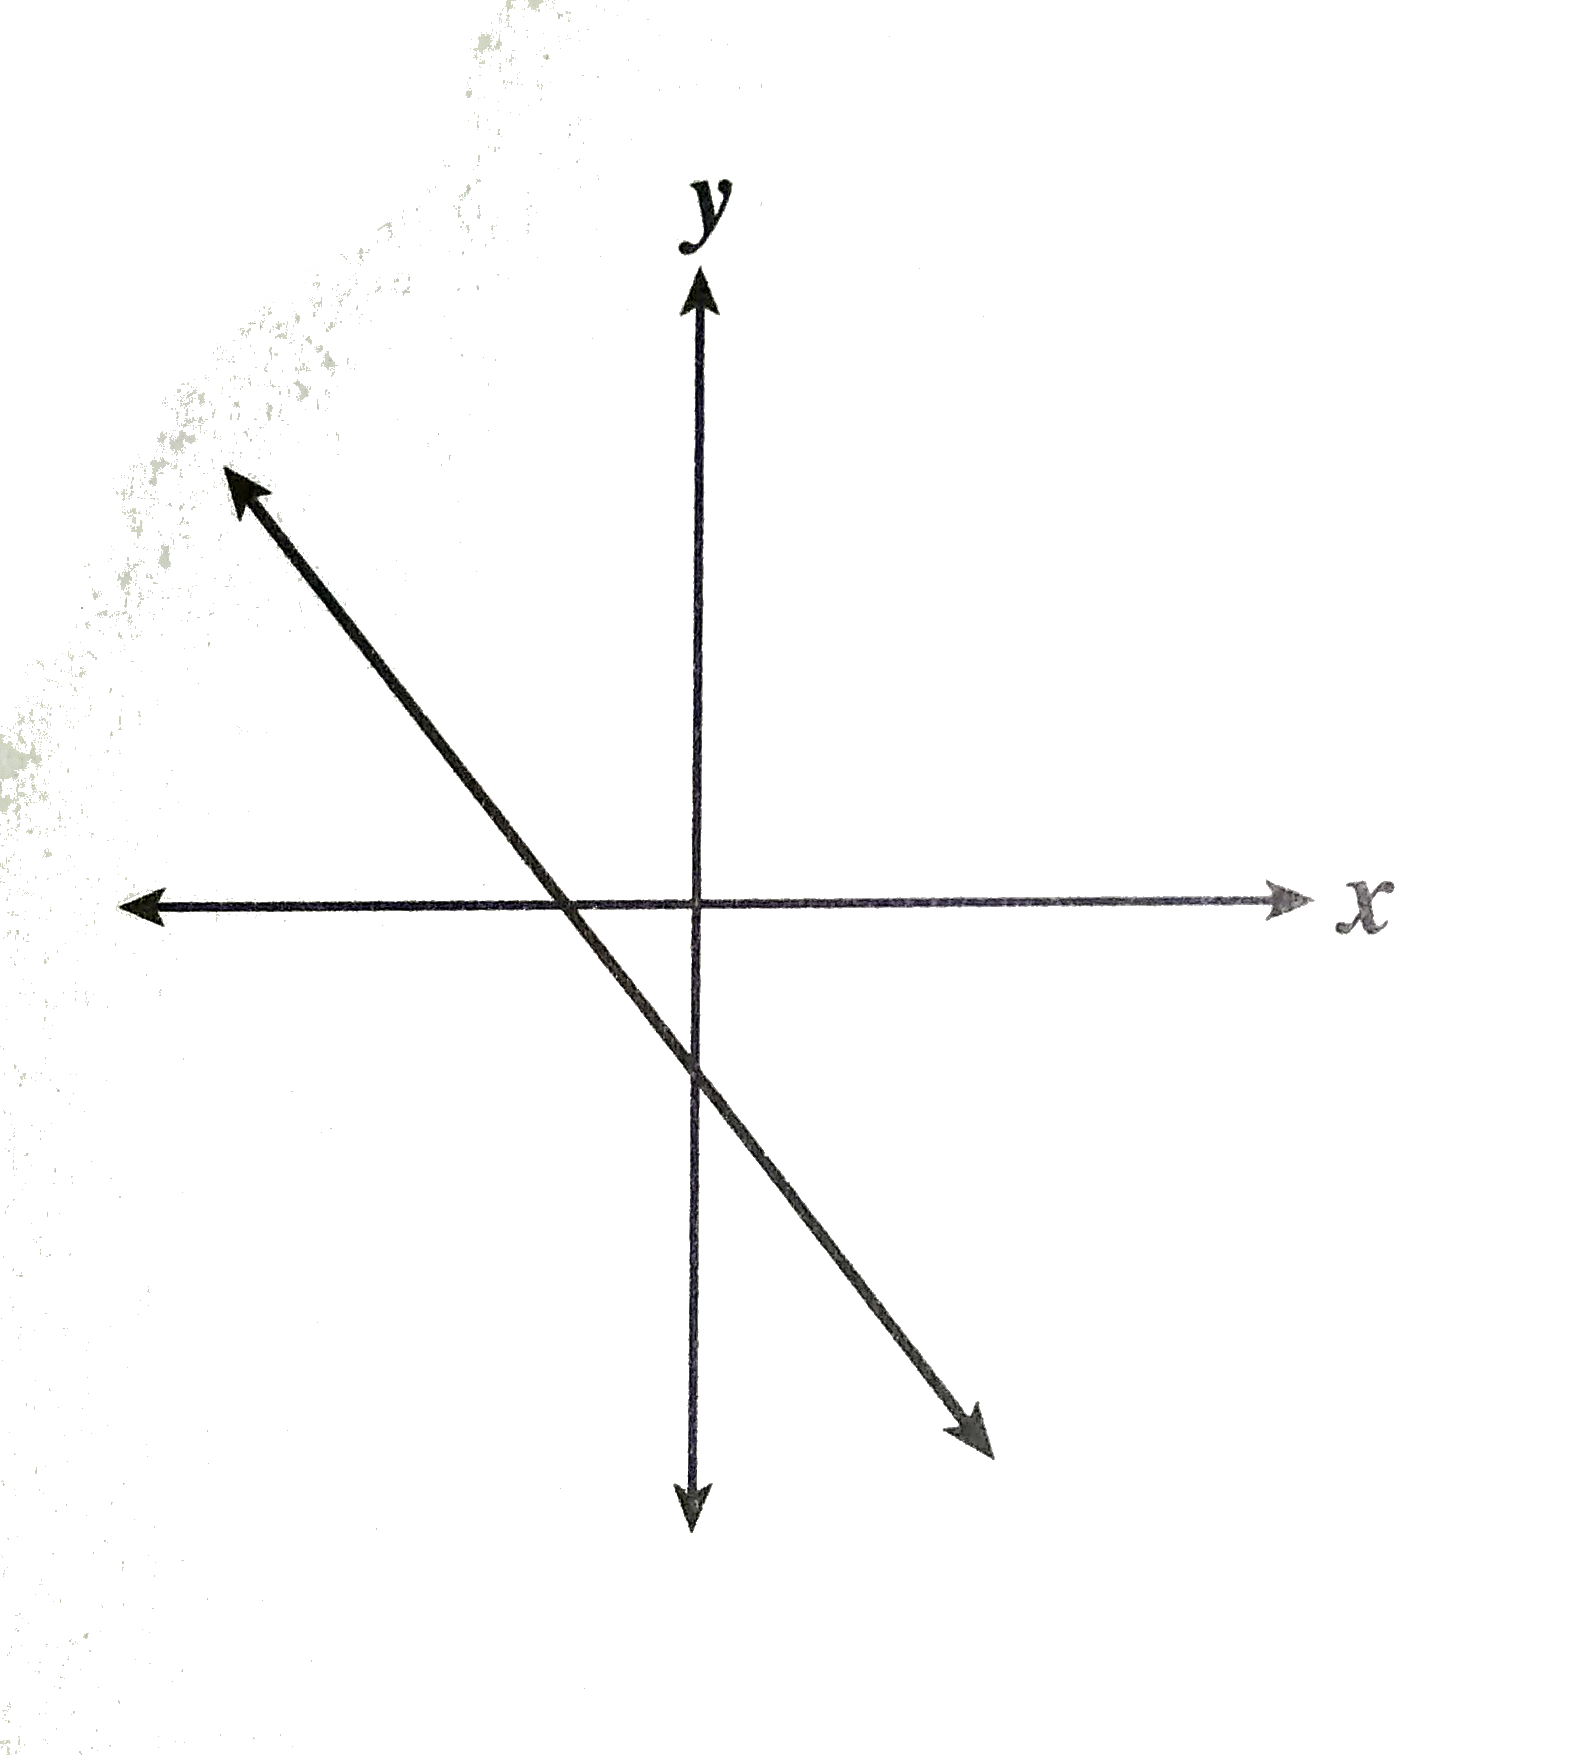
The graph above could represent which of the following equations?
−6x−4y=5
−6x−4y=−5
−6x+4y=5
−6x+4y=−5
The correct Answer is:A
Step by step video & image solution for The graph above could represent which of the following equations? by Maths experts to help you in doubts & scoring excellent marks in Class 10 exams.
Updated on:21/07/2023Topper's Solved these Questions
Similar Questions
Knowledge Check
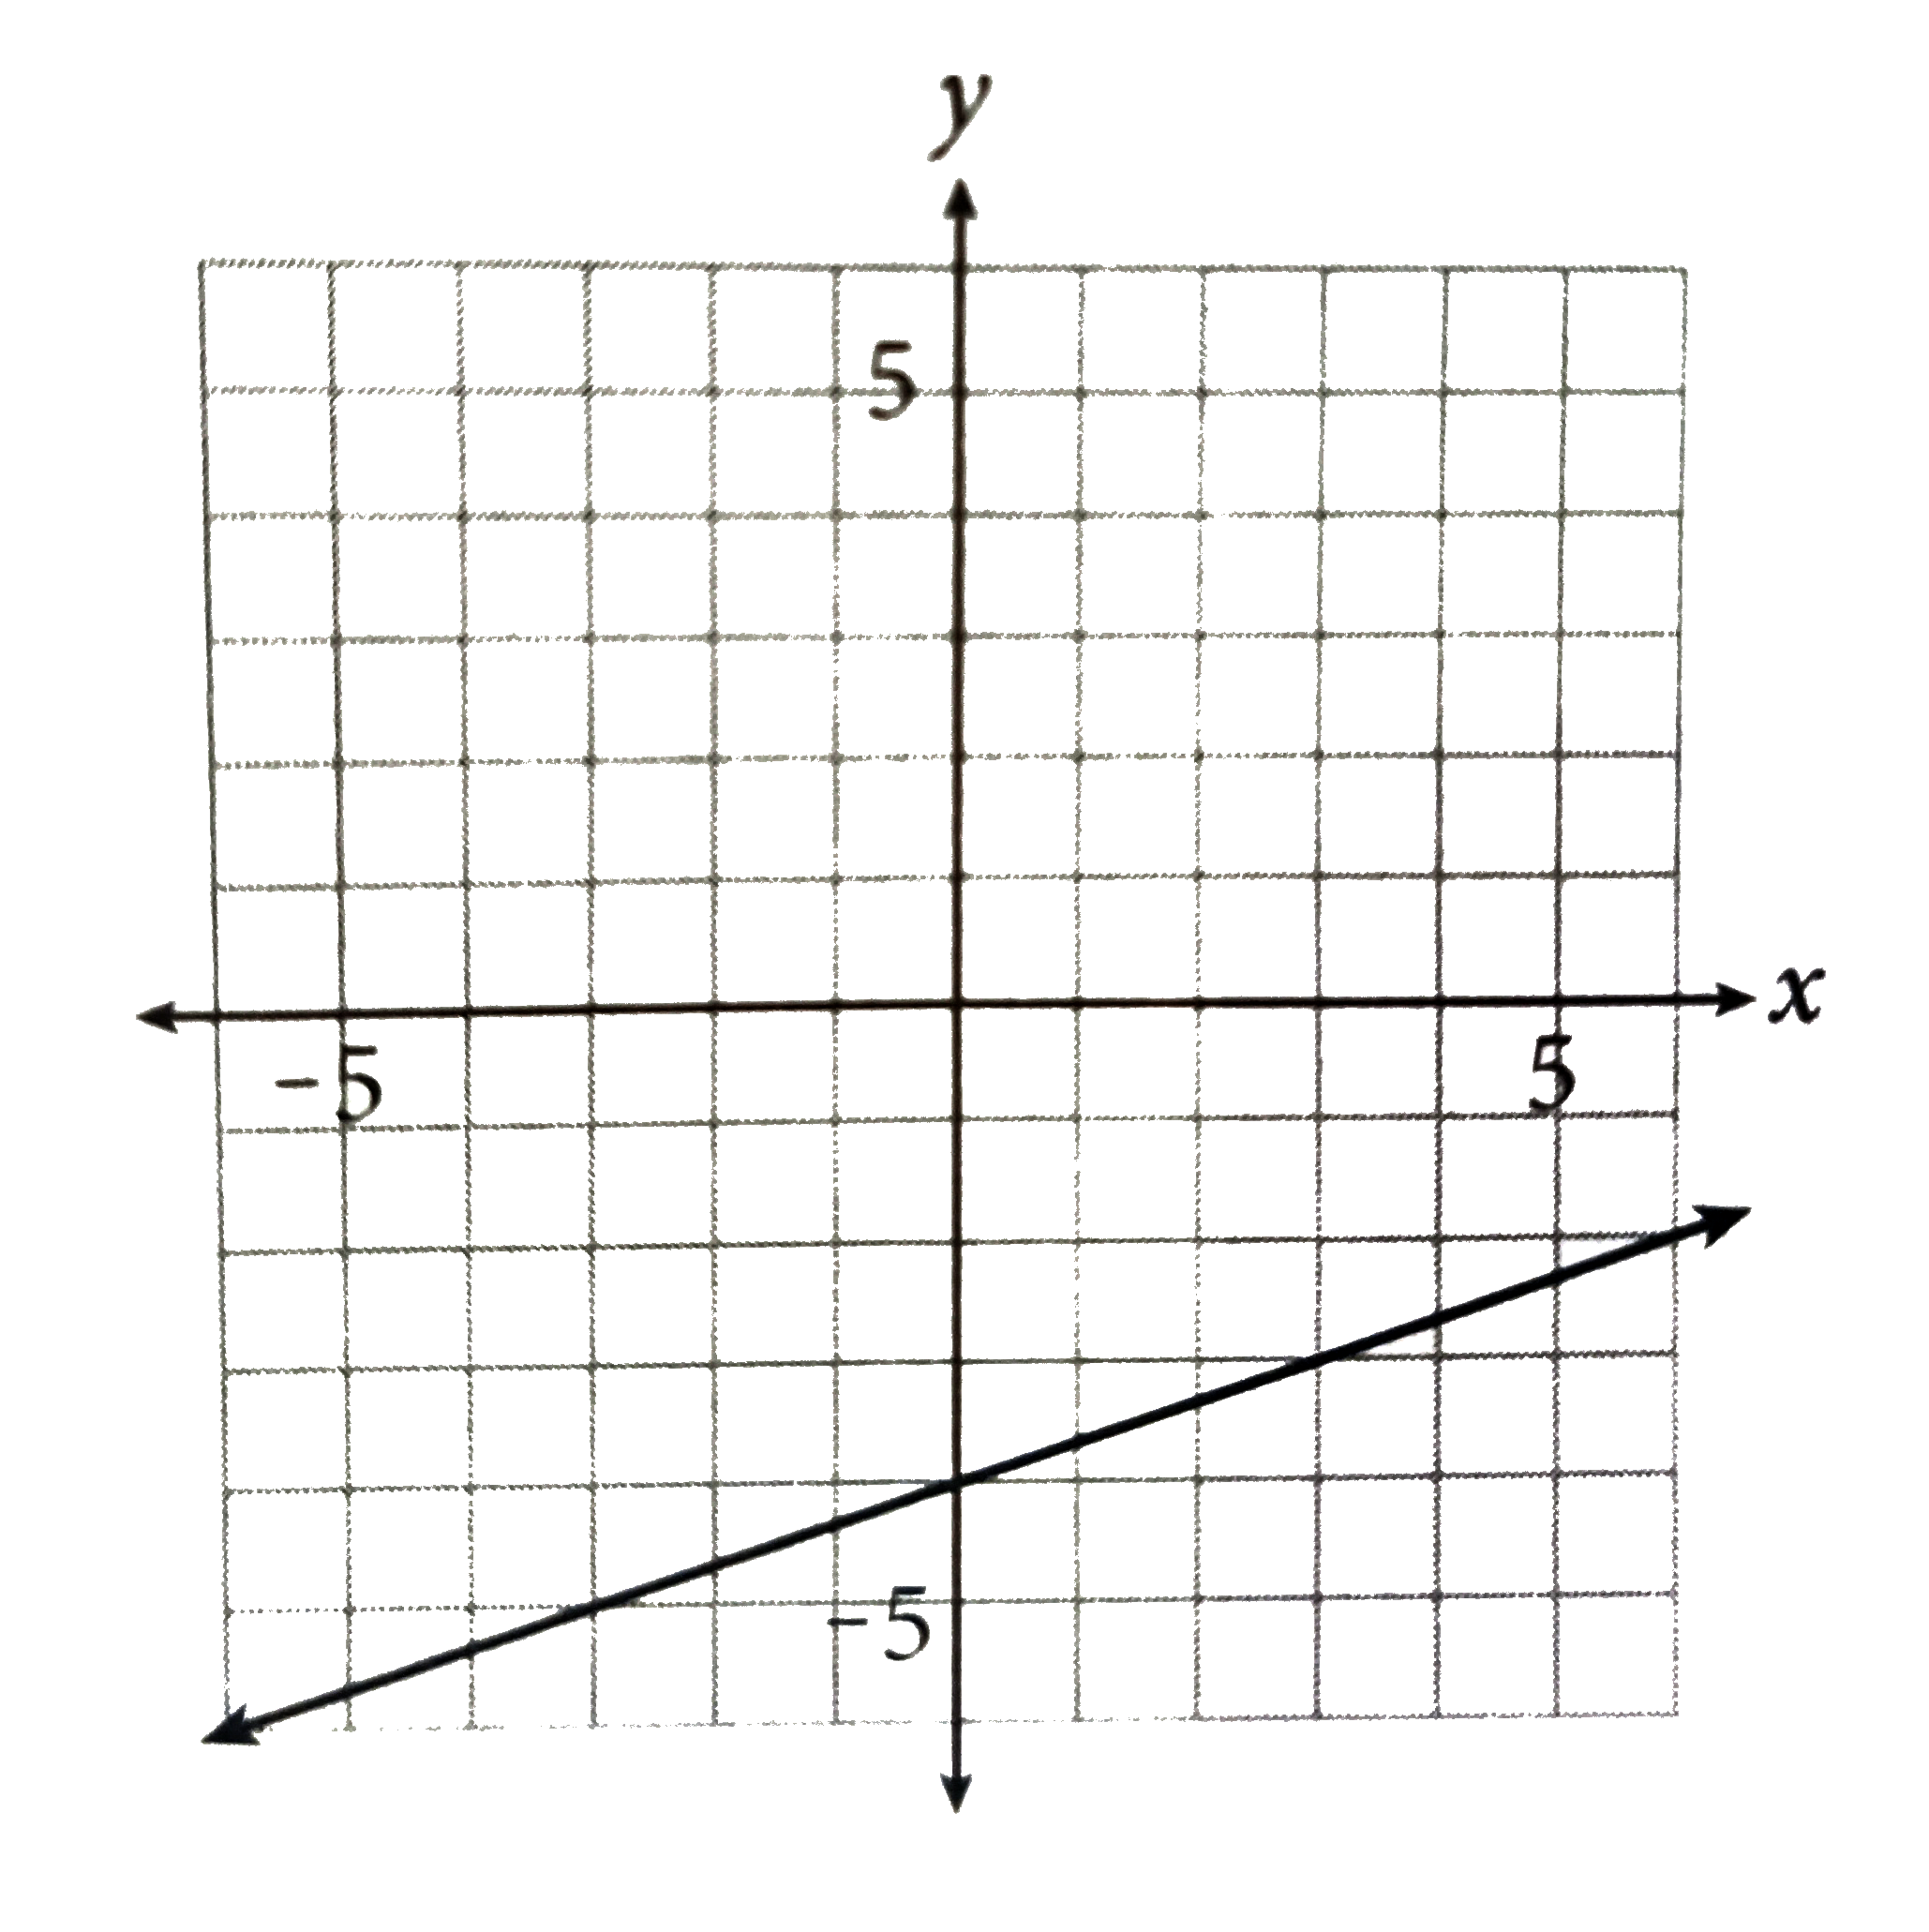
The graph shown represents which of the following equations ?Ay=−3x+4By=−13x+4Cy=13x−4Dy=3x−4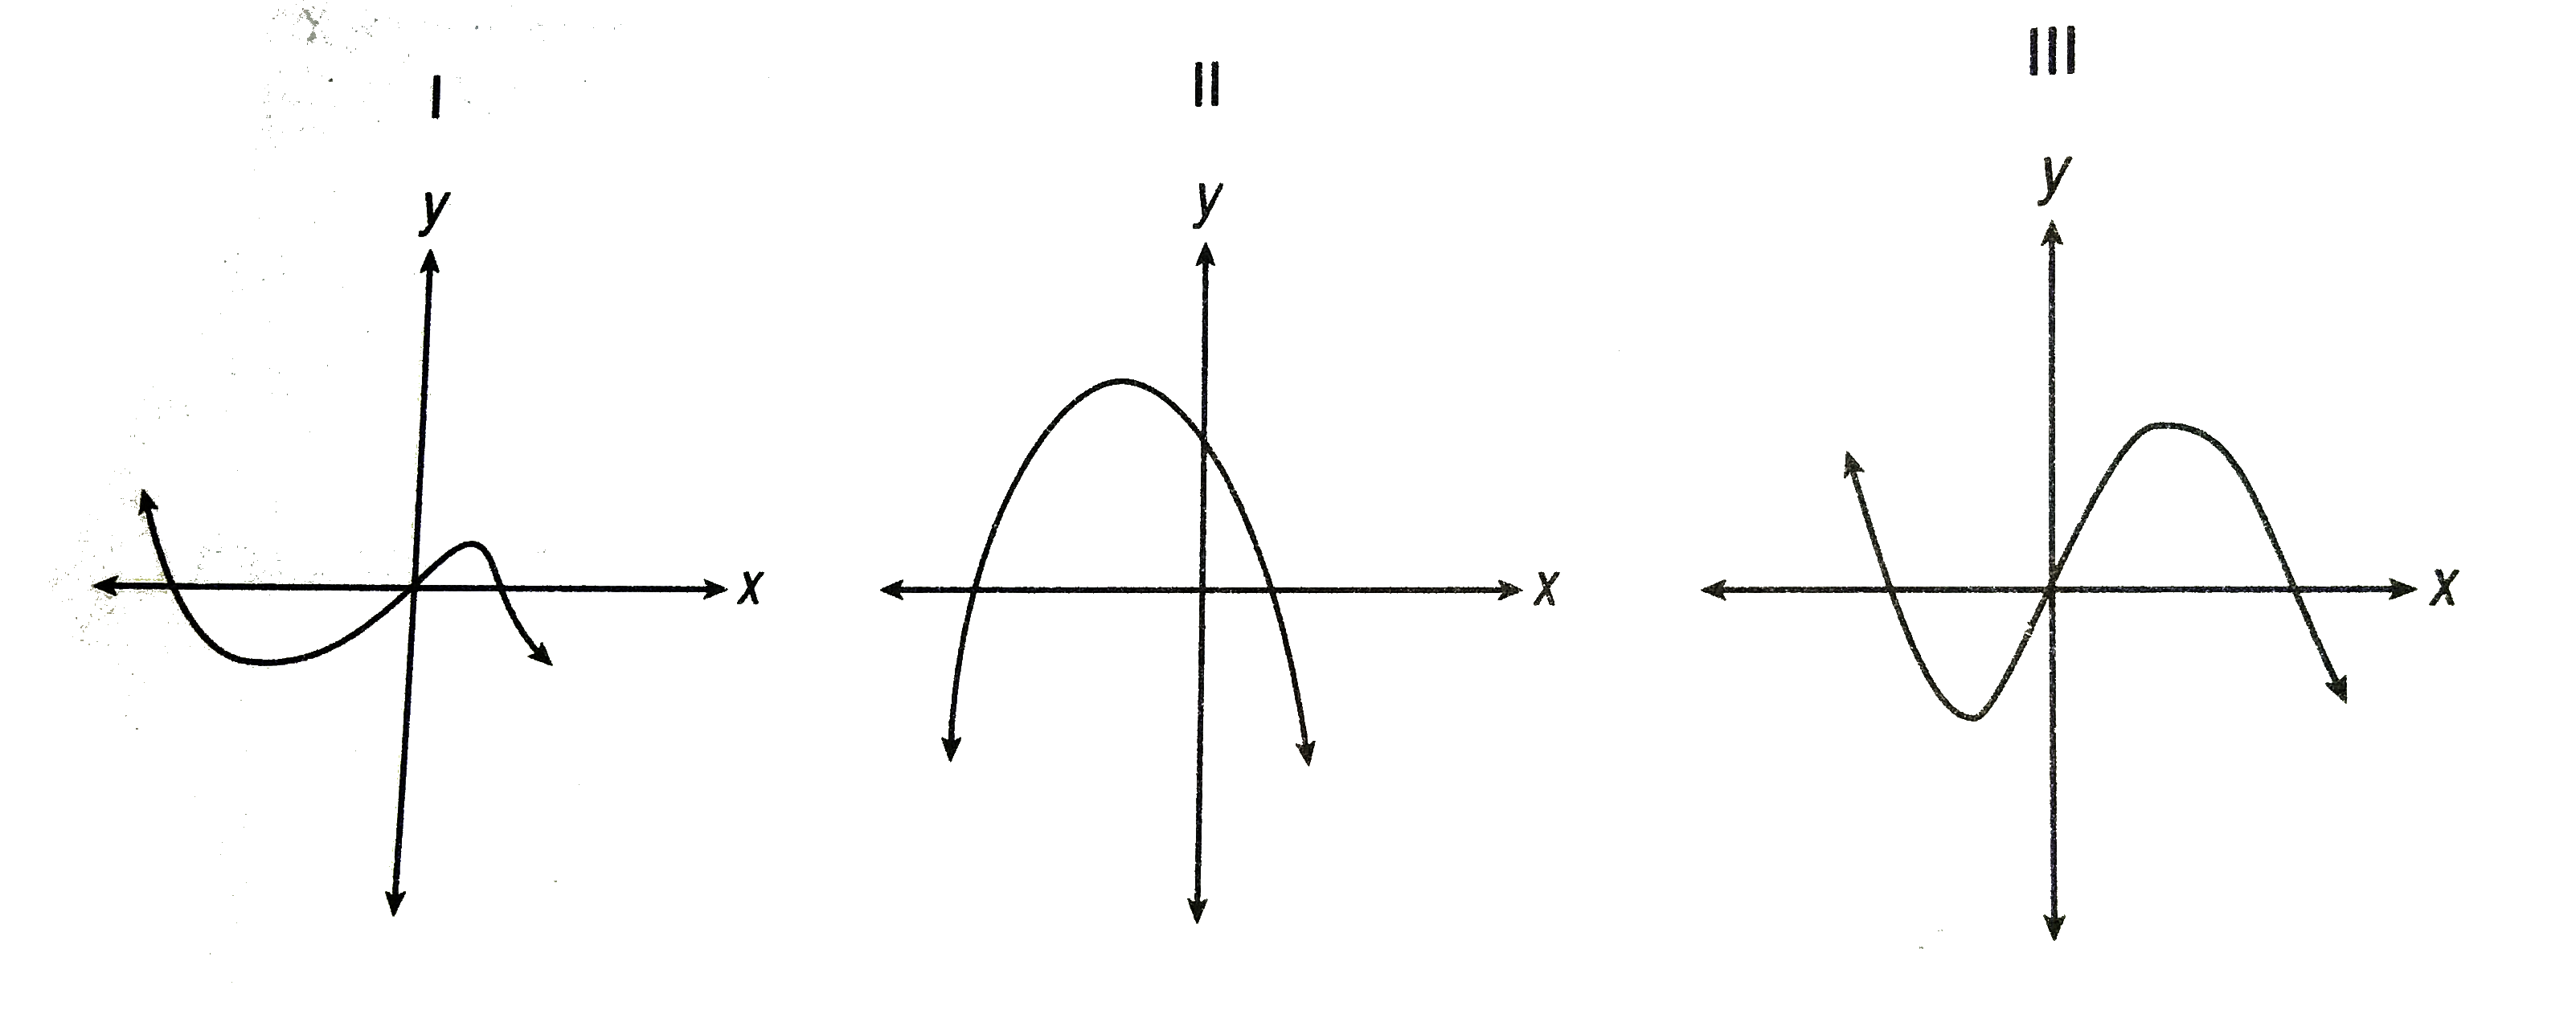
A polynomial function contains the factors x,x−2,andx+5. Which of the graph(x) above could represents the graph of this function?AI onlyBII onlyCII onlyDI and IIIWhen 6 is subtracted from 10p, the result is t. which of the following equation represent the statement above?
At=6(p−10)Bt=6p−10Ct=10(6−p)D10p−6=t
−2x+3y=6
In the xy-plane the graph of which of the following equations is perpendicular to the graph of the equation above?
View Solution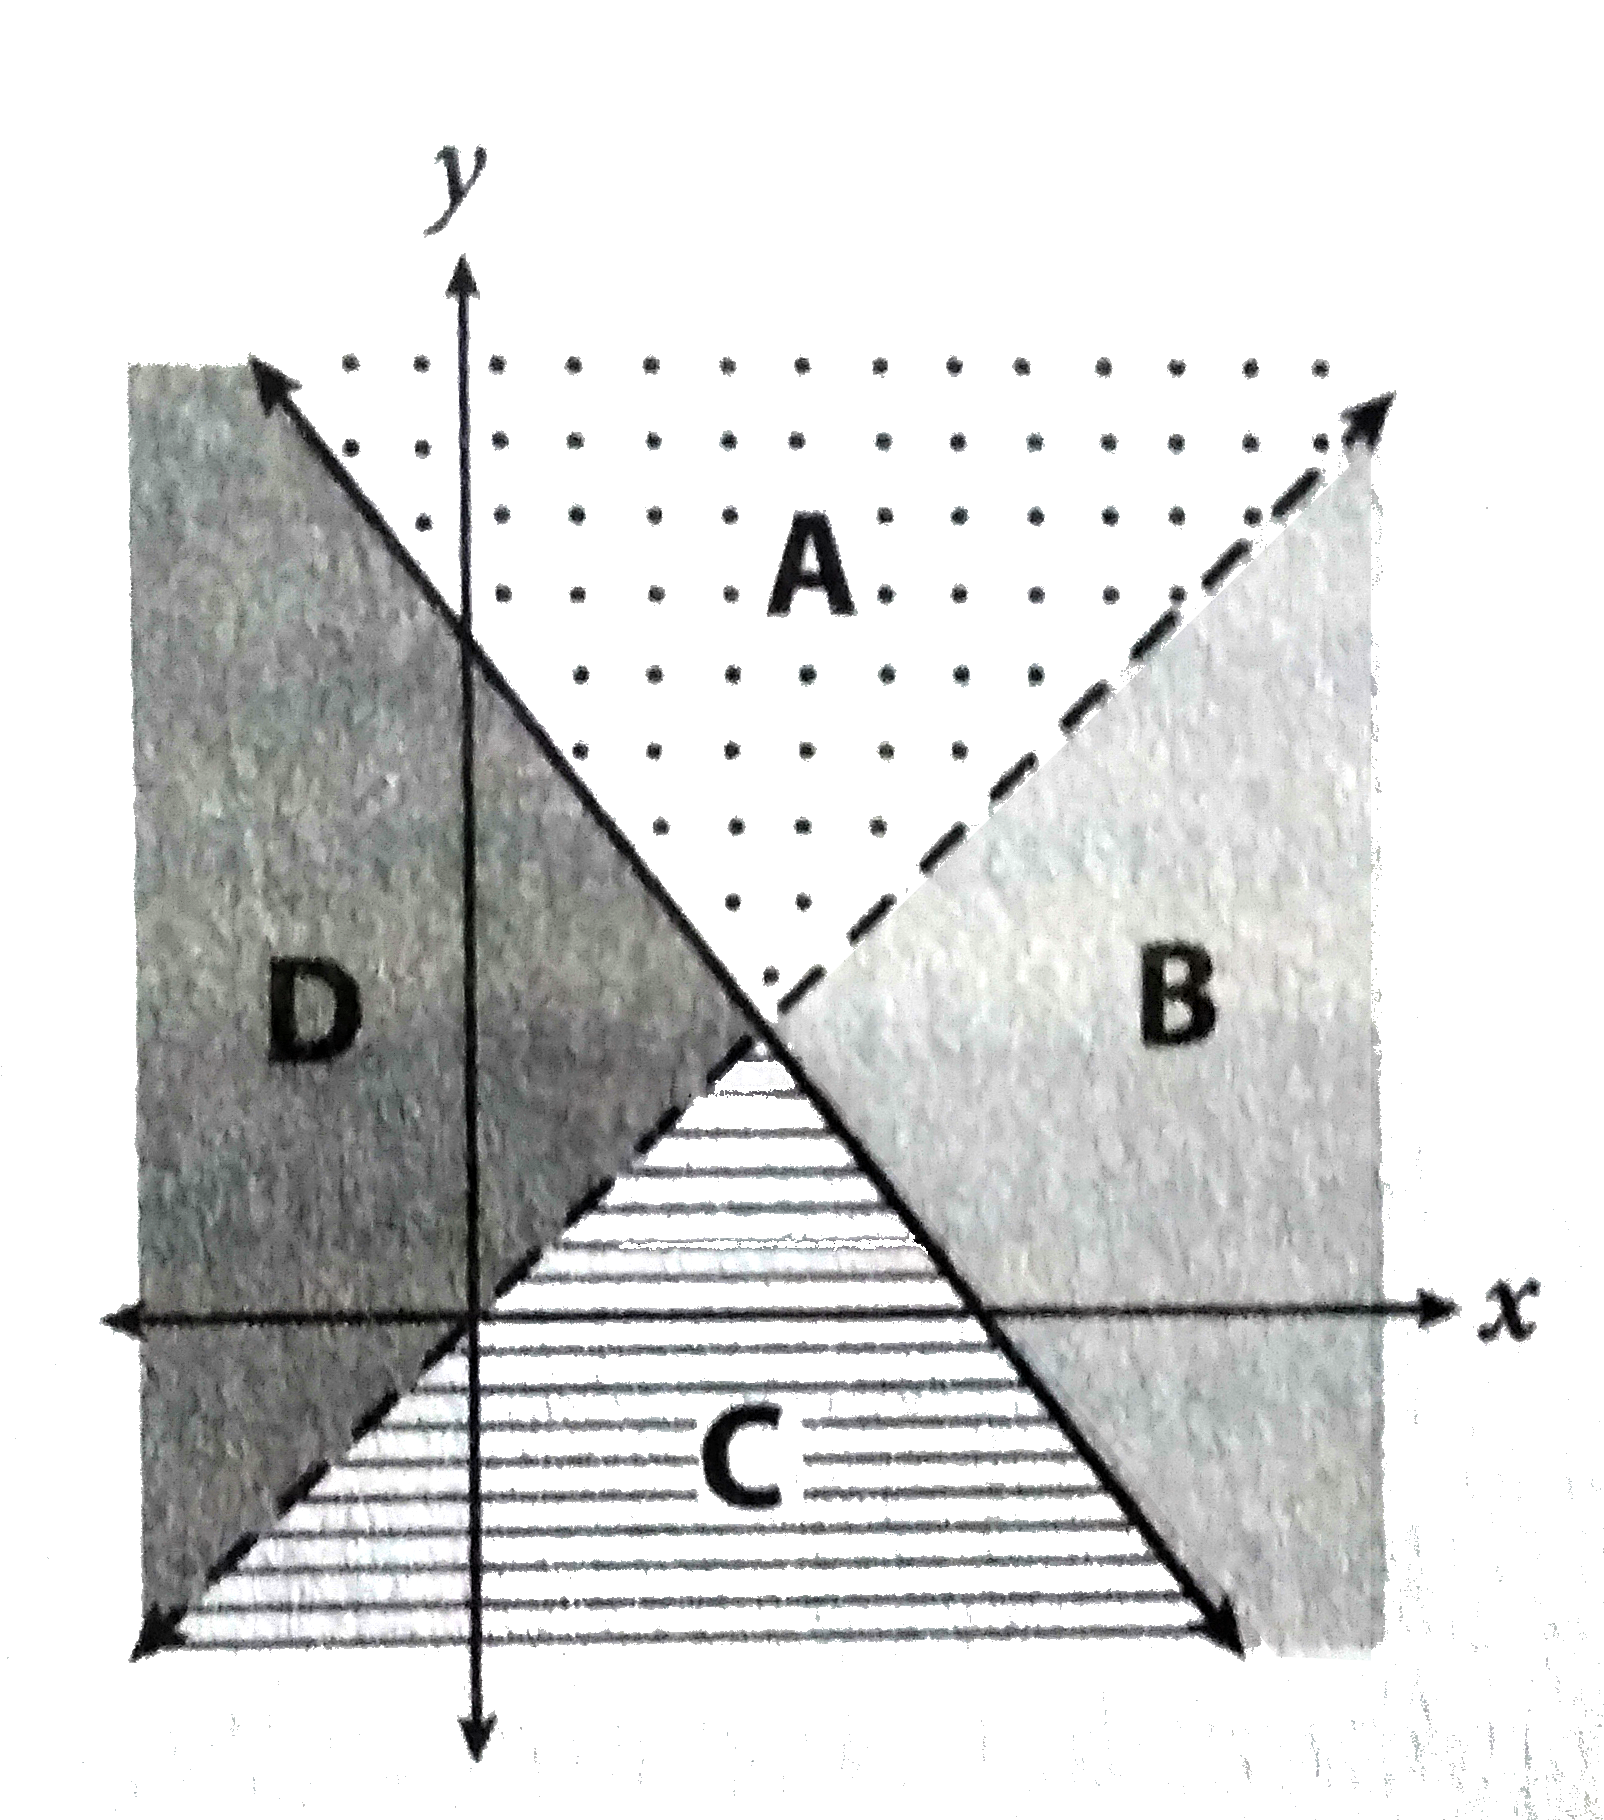
A system of inequalities and the corresponding graph are shown above. Which part of the graph could represent all of the solutions to the system?
View Solution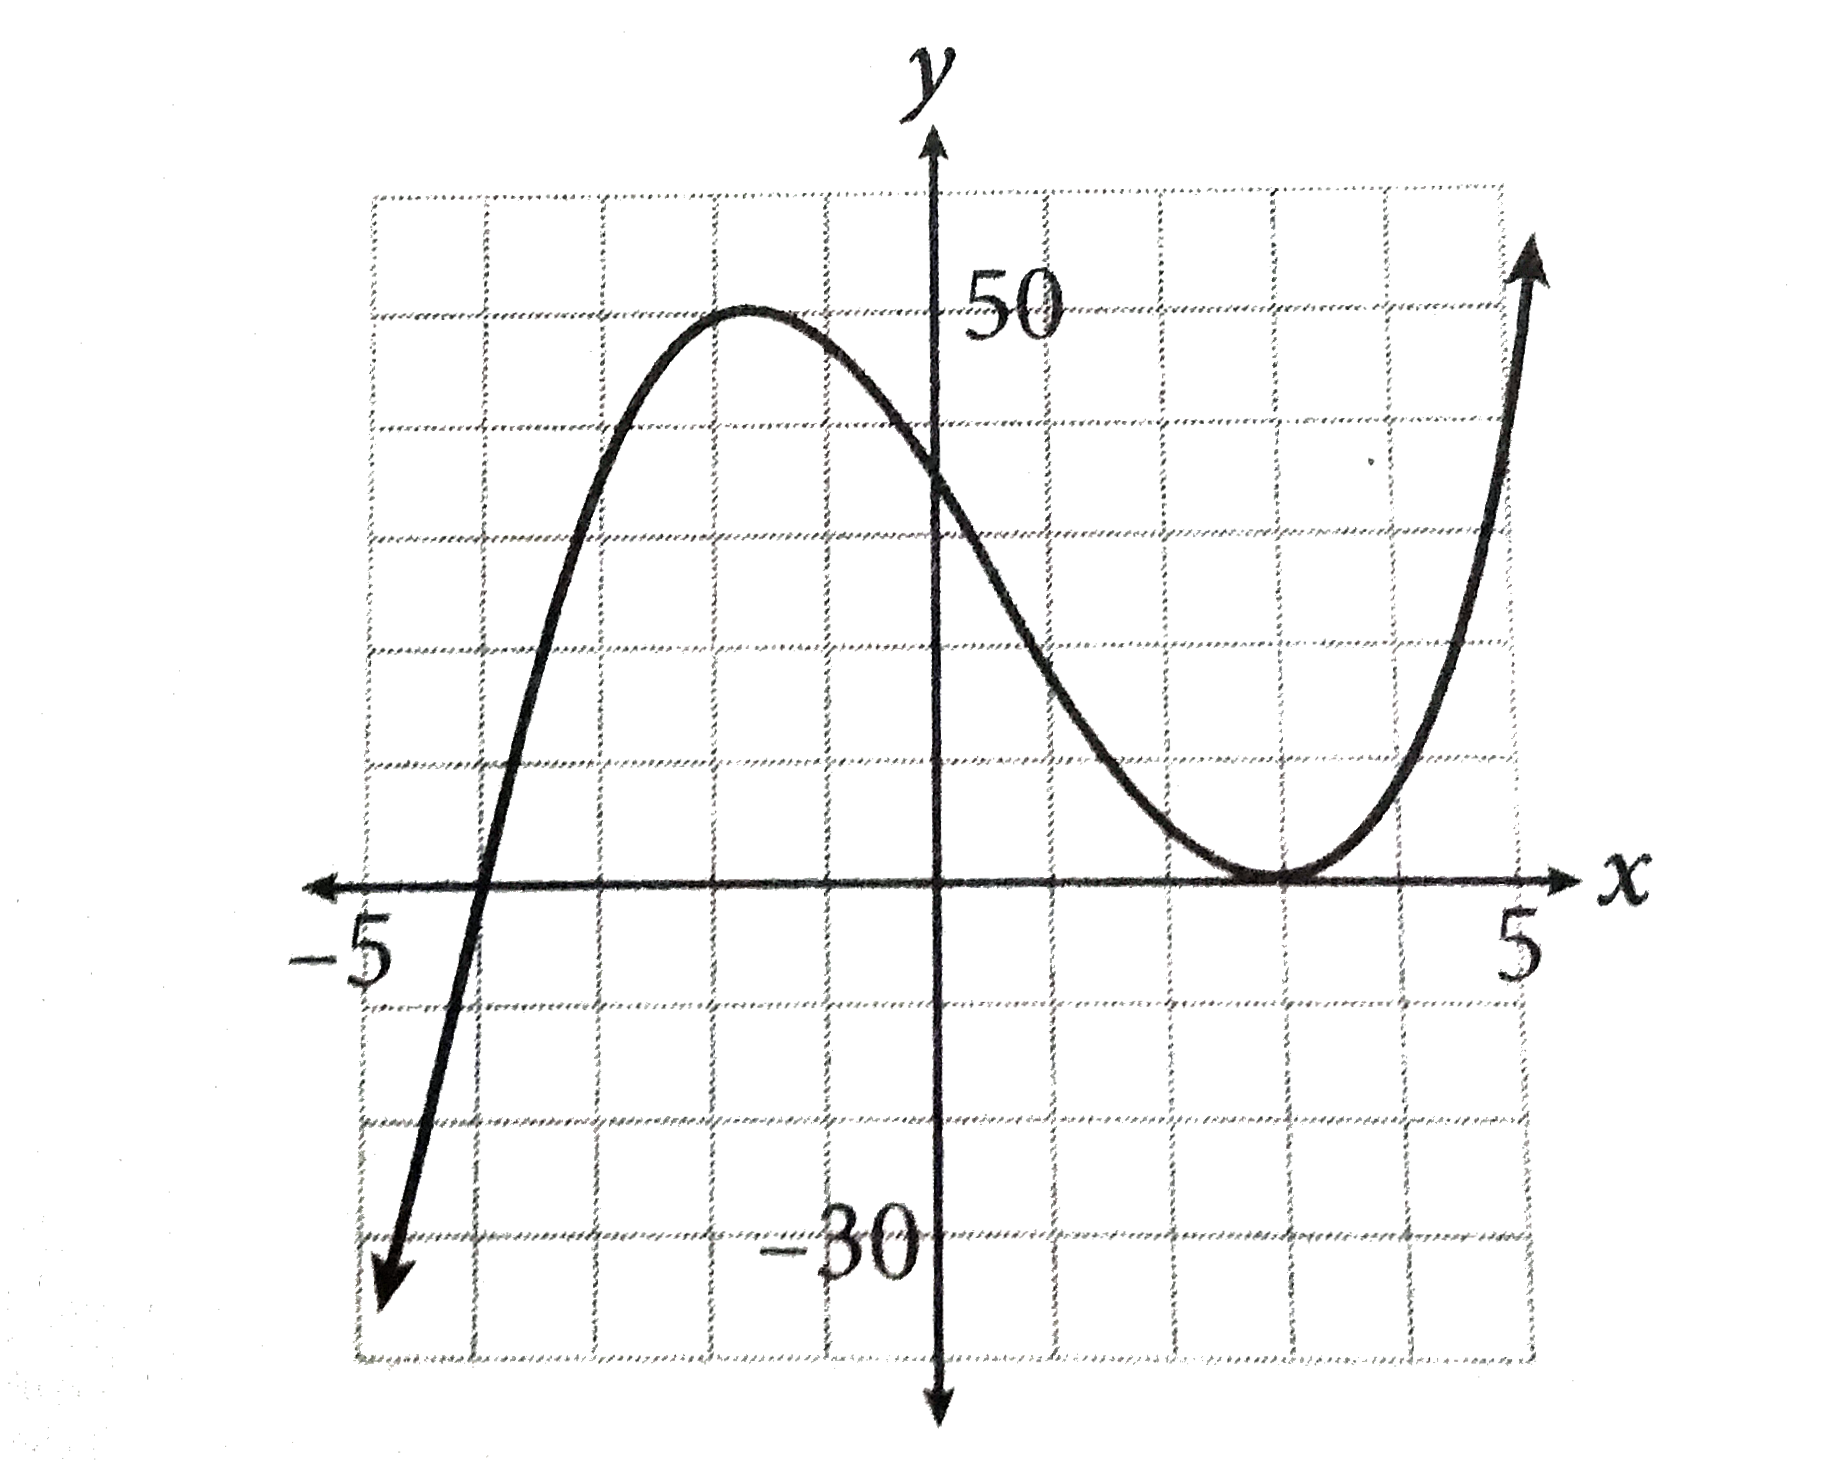
If p(x) is the polynomial functions shown in the graph above, which of the following could be fractored form of p(x)?
View Solution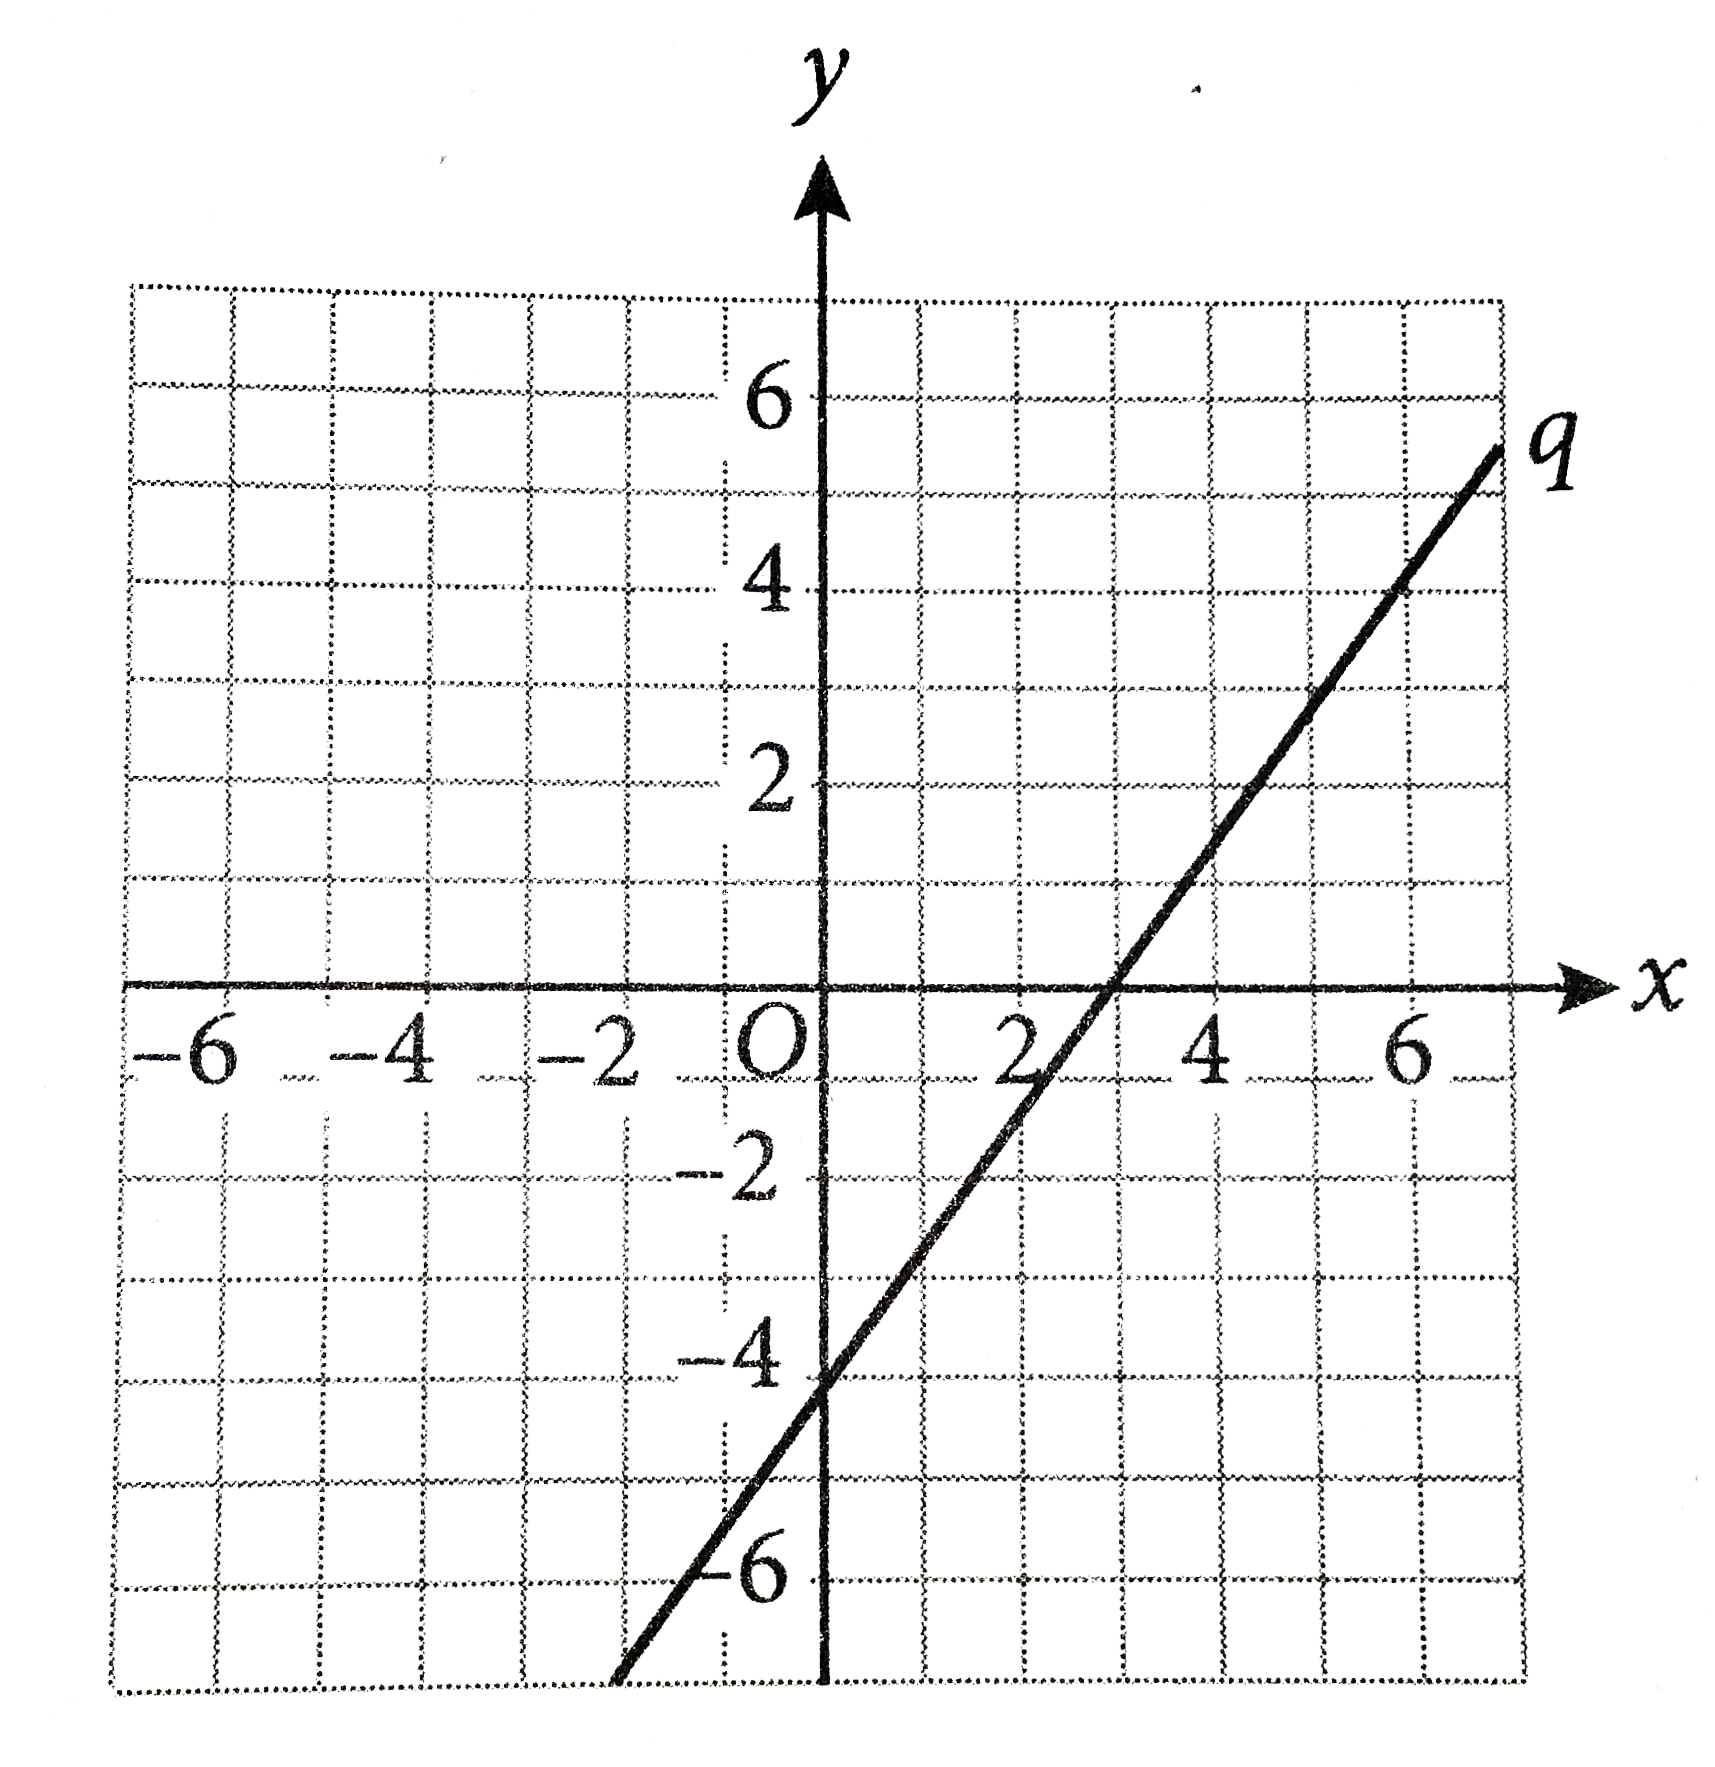
Line p (not shown) is perpendicular to line q shown above and passes through the point (0,4). Which of the following equations could represent line p?
View Solution{y>2x−35y≤3x
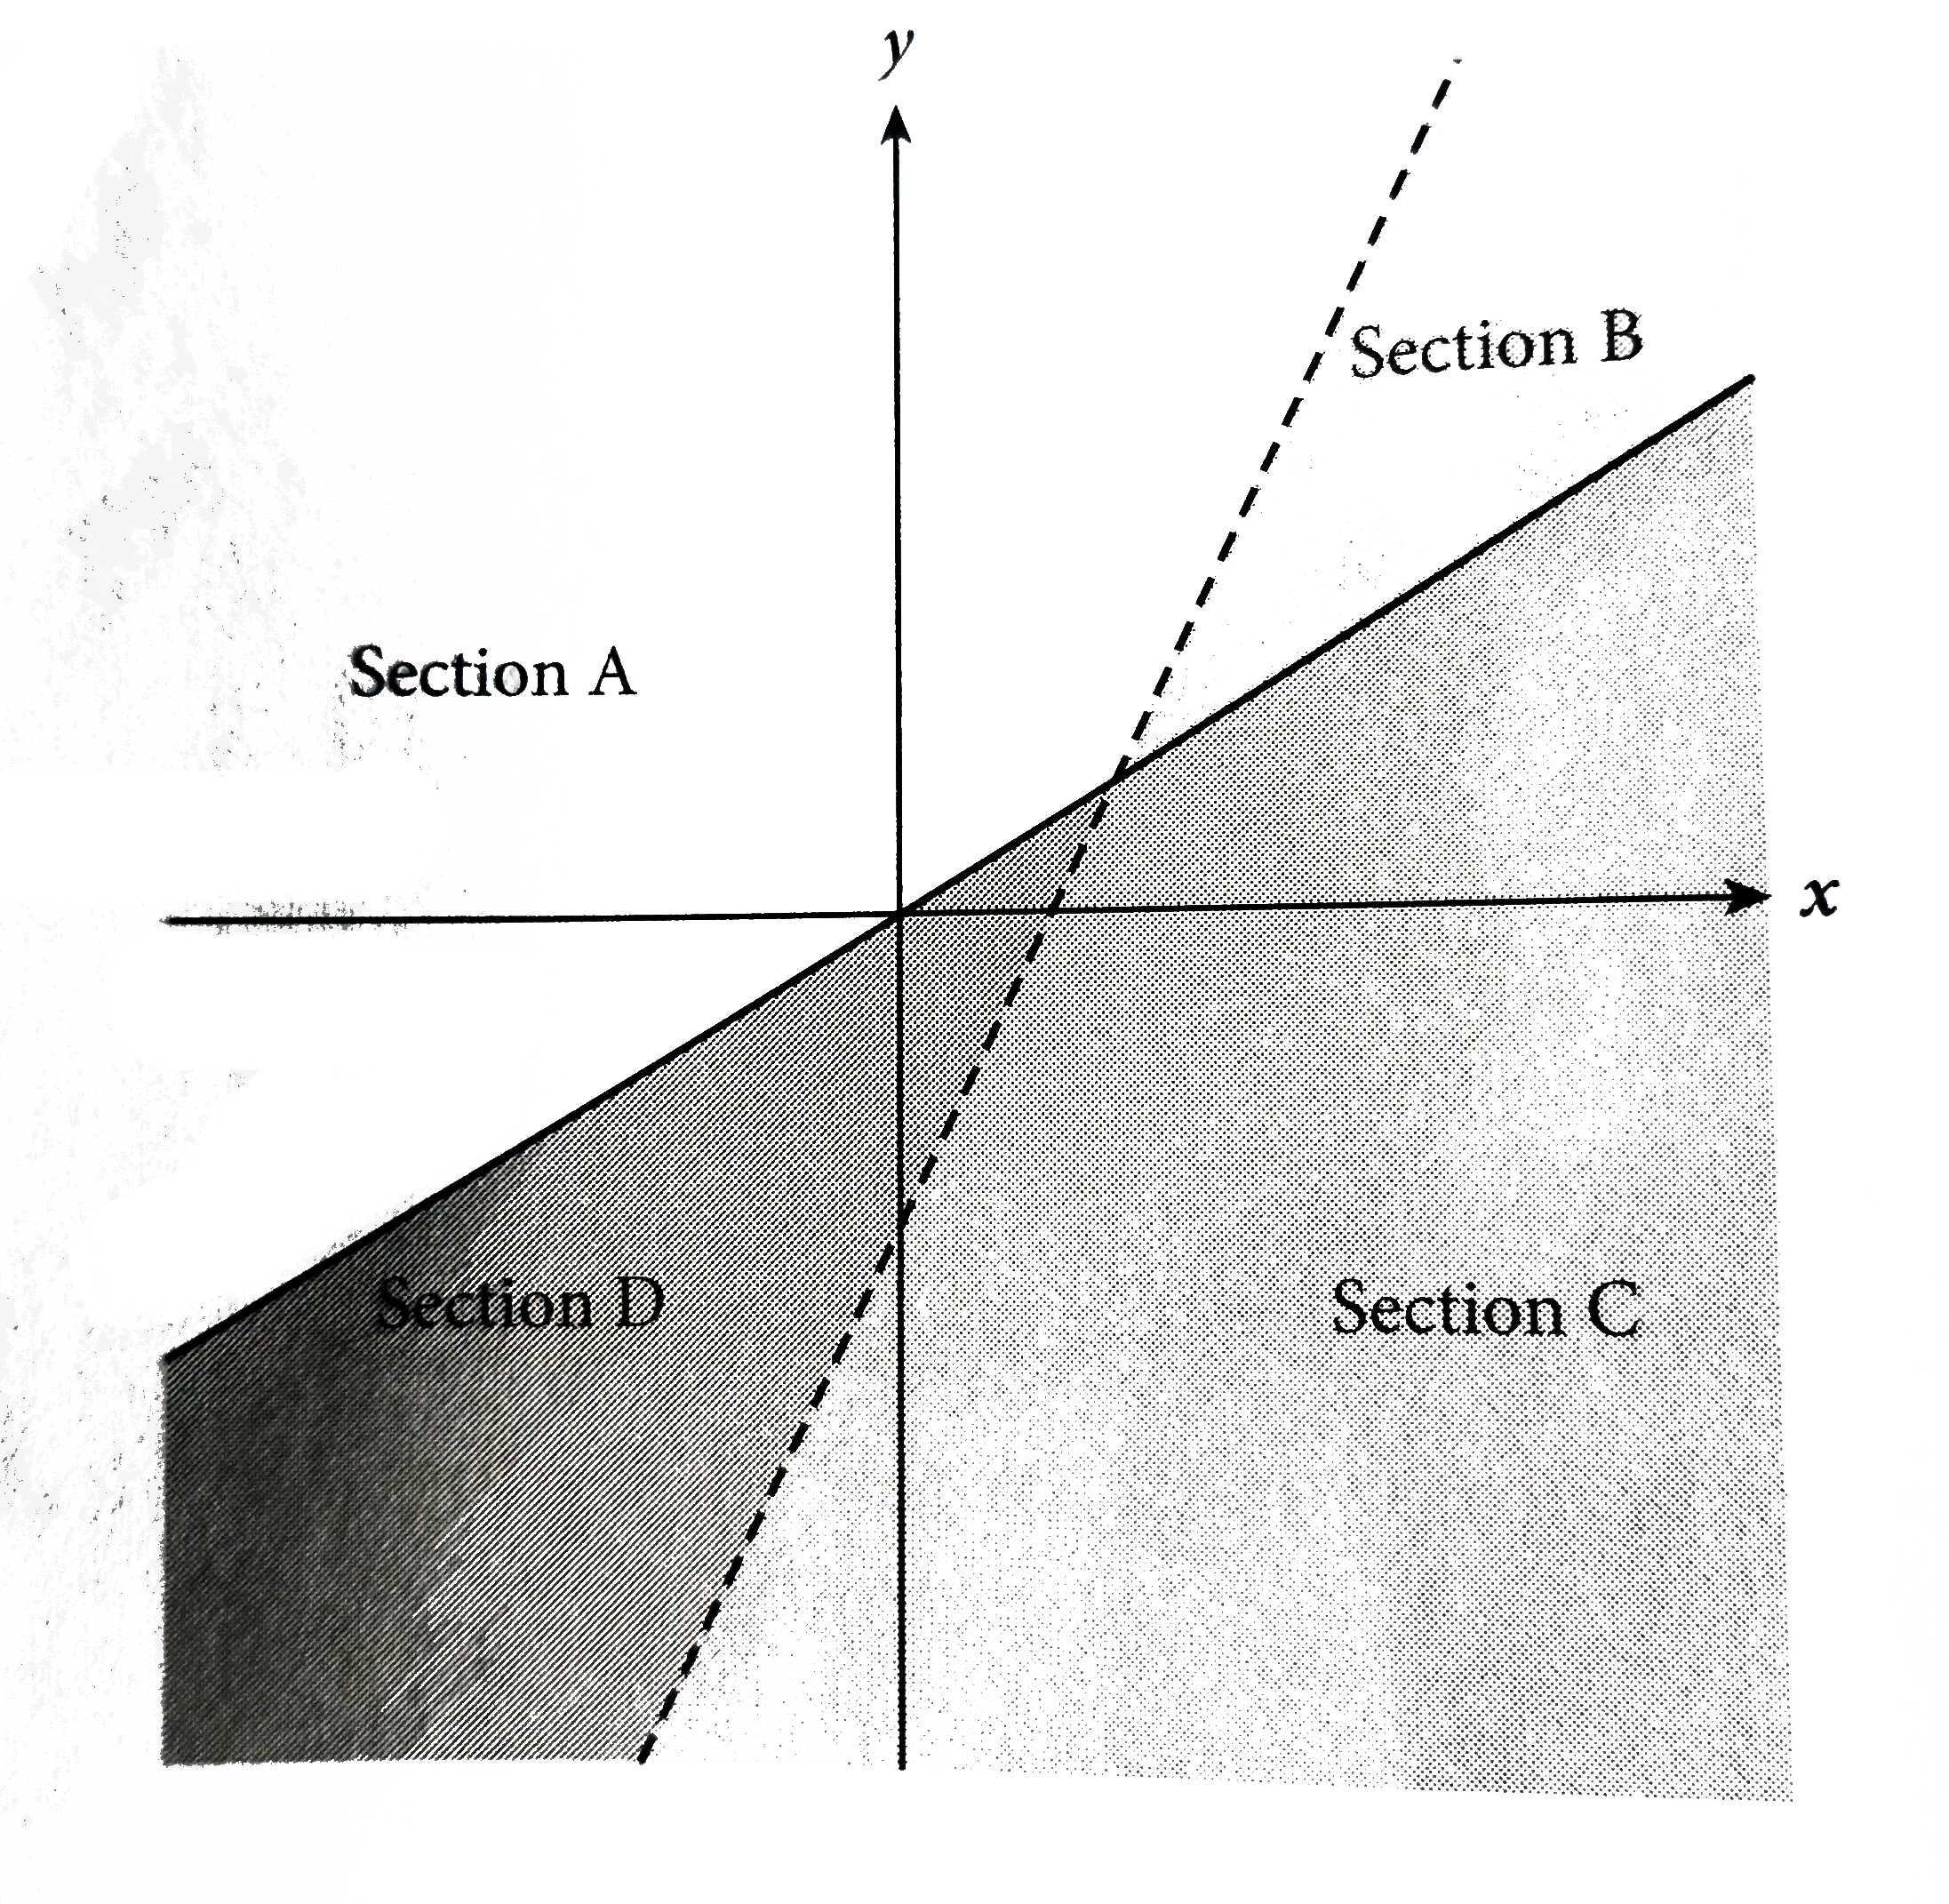
The graph above depicts the system of inequalities shown Which of the labeled section or sections of the graph could represent all of the solutions of the system ?
View Solution

