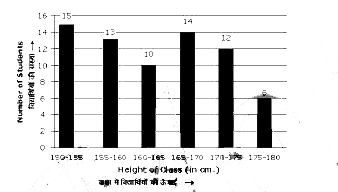
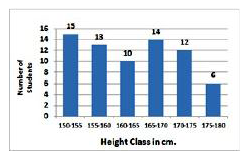
The heights of 50 students, measured to the nearest centimetres have been found to be as follows:

(i) Represent the data given above by a grouped frequency distribution table, taking class intervals as 160-165, 165-170 etc.
(ii) What can you conclude about their heights from the table ?
(i) We condense the given data into group like (150-155), (155-160)…..
Now, the given data can be taken as under

(ii) From the table, our conclusion is that more than 50% of students (i.e., ) are shorter than 165 cm.
Topper's Solved these Questions
- STATISTICSBOOK - NAGEEN PRAKASHANCHAPTER - STATISTICSEXERCISE - Exercise 14a
10 Videos
- STATISTICSBOOK - NAGEEN PRAKASHANCHAPTER - STATISTICSEXERCISE - Exercise 14c
20 Videos
- STATISTICSBOOK - NAGEEN PRAKASHANCHAPTER - STATISTICSEXERCISE - Revision Exercise
10 Videos
- QUADRILATERALSBOOK - NAGEEN PRAKASHANCHAPTER - QUADRILATERALSEXERCISE - Revision Exercise (long Answer Questions)
5 Videos
- SURFACE AREA AND VOLUMEBOOK - NAGEEN PRAKASHANCHAPTER - SURFACE AREA AND VOLUMEEXERCISE - Revision Exercise (long Answer Questions)
10 Videos
Similar Questions
The heights of 50 students, measured to the nearest centimetres, have been found to be as follows: 161 150 154 165 168 161 154 162 150 151162 164 171 165 158 154 156 172 160 170153 159 161 170 162 165 166 168 165 164154 152 153 156 158 162 160 161 173 166161 159 162 167 168 159 158 153 154 159 (i) Represent the data given above by a grouped frequency distribution table, taking the class intervals as 160 - 165, 165 - 170, etc.(ii) What can you conclude about their heights from the table?
View SolutionThe heights of 50 students, measured to the nearest centimetres, have been found to be as follows: 161,150,154,165,168,161,154,162,150,151,162,164,171,165,158,154,156,172,160,170,153,159,161,170,162,165,166,168,165,164,154,152,153,156,158,162,160,161,173,166,161,159,162,167,168,159,158,153,154,159,
(i) Represent the data given above by a grouped frequency distribution table, taking the class intervals as 160−165,165−170, etc.
(ii) What can you conclude about their heights from the table?
View SolutionThe distance (in km) of 40 engineers from their residence to their place of work were found as follows.

Construct a grouped frequency distribution table with calss- size 5 for the data given above taking the first interval as 0-5 (5 not included). What main features do you observe from this tabular representation?
View SolutionThe distance (in km) of 40 engineers from their residence to their place of work were found as follows.

Construct a grouped frequency distribution table with calss- size 5 for the data given above taking the first interval as 0-5 (5 not included).
View SolutionIn the given histogram what is the percentage of students whose height is in the class interval 165-170

View Solution
In the given histogram, what is the percentage of students whose height is in the class interval 165 - 170?
View SolutionGiven below is a cumulative frequency distribution showing the mars secured by 50 students of a class

From the frequency distribution table for the data.
View SolutionGiven below is a cumulative frequency distribution showing the mars secured by 50 students of a class

From the frequency distribution table for the data.
View SolutionThe heights of 50 students, measured to the nearest centimetres, have been found to be as follows: 161 150 154 165 168 161 154 162 150 151
162 164 171 165 158 154 156 172 160 170
153 159 161 170 162 165 166 168 165 164
154 152 153 156 158 162 160 161 173 166
161 159 162 167 168 159 158 153 154 159
Represent the data given above by a grouped frequency distribution table, taking the class intervals as 160-165, 165-170, etc.
View SolutionThe heights of 50 students, measured to the nearest centimetres, have been found to be as follows: 161 150 154 165 168 161 154 162 150 151
162 164 171 165 158 154 156 172 160 170
153 159 161 170 162 165 166 168 165 164
154 152 153 156 158 162 160 161 173 166
161 159 162 167 168 159 158 153 154 159
What can you conclude about their heights from the table?
View Solution
