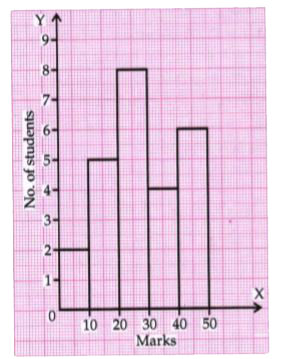
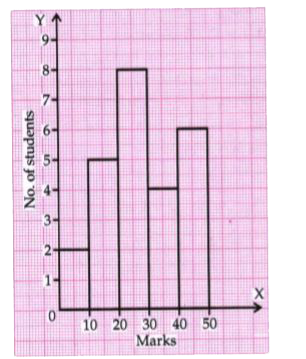
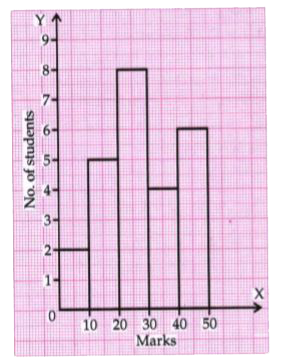
The histogram below represents the scores obtained by 25 students in a Mathematics mental test. Use the data to,
(i) Frame a frequency distribution table
(ii) To calculate mean
The correct Answer is:(i) Required frequency distribution table is
(##SELRKBICSEMATX_C24E06023_A01##)
(ii) 27.8
To solve the problem step by step, we will first create a frequency distribution table based on the histogram data provided, and then we will calculate the mean of the scores.
Step 1: Frame a Frequency Distribution Table
1. Identify the Class Intervals: From the histogram, we can identify the class intervals as follows:
- 0 to 10
- 10 to 20
- 20 to 30
- 30 to 40
- 40 to 50
2. Count the Frequencies: We will count the number of students (frequency) for each class interval:
- For 0 to 10: 2 students
- For 10 to 20: 5 students
- For 20 to 30: 8 students
- For 30 to 40: 4 students
- For 40 to 50: 6 students
3. Create the Table:
| Class Interval | Frequency (f) |
|----------------|----------------|
| 0 - 10 | 2 |
| 10 - 20 | 5 |
| 20 - 30 | 8 |
| 30 - 40 | 4 |
| 40 - 50 | 6 |
| Total | 25 |
Step 2: Calculate the Mean
1. Find the Midpoint (x) for Each Class Interval:
- For 0 to 10: Midpoint = (0 + 10)/2 = 5
- For 10 to 20: Midpoint = (10 + 20)/2 = 15
- For 20 to 30: Midpoint = (20 + 30)/2 = 25
- For 30 to 40: Midpoint = (30 + 40)/2 = 35
- For 40 to 50: Midpoint = (40 + 50)/2 = 45
2. Calculate the Product of Midpoint and Frequency (fx):
- For 0 to 10: fx = 5 * 2 = 10
- For 10 to 20: fx = 15 * 5 = 75
- For 20 to 30: fx = 25 * 8 = 200
- For 30 to 40: fx = 35 * 4 = 140
- For 40 to 50: fx = 45 * 6 = 270
3. Create a New Table with fx:
| Class Interval | Frequency (f) | Midpoint (x) | fx |
|----------------|----------------|---------------|------|
| 0 - 10 | 2 | 5 | 10 |
| 10 - 20 | 5 | 15 | 75 |
| 20 - 30 | 8 | 25 | 200 |
| 30 - 40 | 4 | 35 | 140 |
| 40 - 50 | 6 | 45 | 270 |
| Total | 25 | | 695 |
4. Calculate the Mean:
- Use the formula for mean:
Mean=∑(fx)∑(f)=69525=27.8
Final Result
The mean of the scores obtained by the students is 27.8.
---
- 0 to 10
- 10 to 20
- 20 to 30
- 30 to 40
- 40 to 50
- For 0 to 10: 2 students
- For 10 to 20: 5 students
- For 20 to 30: 8 students
- For 30 to 40: 4 students
- For 40 to 50: 6 students
| Class Interval | Frequency (f) |
|----------------|----------------|
| 0 - 10 | 2 |
| 10 - 20 | 5 |
| 20 - 30 | 8 |
| 30 - 40 | 4 |
| 40 - 50 | 6 |
| Total | 25 |
- For 0 to 10: Midpoint = (0 + 10)/2 = 5
- For 10 to 20: Midpoint = (10 + 20)/2 = 15
- For 20 to 30: Midpoint = (20 + 30)/2 = 25
- For 30 to 40: Midpoint = (30 + 40)/2 = 35
- For 40 to 50: Midpoint = (40 + 50)/2 = 45
- For 0 to 10: fx = 5 * 2 = 10
- For 10 to 20: fx = 15 * 5 = 75
- For 20 to 30: fx = 25 * 8 = 200
- For 30 to 40: fx = 35 * 4 = 140
- For 40 to 50: fx = 45 * 6 = 270
| Class Interval | Frequency (f) | Midpoint (x) | fx |
|----------------|----------------|---------------|------|
| 0 - 10 | 2 | 5 | 10 |
| 10 - 20 | 5 | 15 | 75 |
| 20 - 30 | 8 | 25 | 200 |
| 30 - 40 | 4 | 35 | 140 |
| 40 - 50 | 6 | 45 | 270 |
| Total | 25 | | 695 |
- Use the formula for mean:
Mean=∑(fx)∑(f)=69525=27.8
The mean of the scores obtained by the students is 27.8.
Topper's Solved these Questions
- MEASURES OF CENTRAL TENDENCY (MEAN, MEDIAN, QUARTILES AND MODE)BOOK - ICSECHAPTER - MEASURES OF CENTRAL TENDENCY (MEAN, MEDIAN, QUARTILES AND MODE)EXERCISE - EXERCISE 24 (D)
8 Videos
- MATRICESBOOK - ICSECHAPTER - MATRICESEXERCISE - Exercise 9D
25 Videos
- MIXED PRACTICE BOOK - ICSECHAPTER - MIXED PRACTICE EXERCISE - SET B
52 Videos
Similar Questions
The historgam below represents the scores obtained by 25 students in a Mathematics mental test. Use the data to :
(i) Frame a frequency distribution table.

View SolutionThe historgam below represents the scores obtained by 25 students in a Mathematics mental test. Use the data to :
(ii) to calculate mean.

View SolutionThe historgam below represents the scores obtained by 25 students in a Mathematics mental test. Use the data to :
(iii) To determine the Modal class.

View SolutionCalculate the mean of the scores of 20 students in a mathematics test

View SolutionThe table shows the marks obtained by 25 students in a class test. Find the mean of the marks obtained

View SolutionThe distribution given below, shows the marks obtained by 25 students in an aptitude test. Find the median and mode of the distribution.
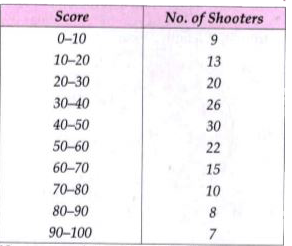
View SolutionThe table shows the distribution of the scores obtained by 160 shooters in a shooting competition. Use a graph sheet and draw an ogive for the distribution. (Take 2 cm = 10 scores on the X-axis and 2 cm = 20 shooters on the Y-axis)

Use your graph to estimate the following :
(i) The median.
(ii) The interquartile range.
(iii) The number of shooters who obtained a score of more than 85%.
View SolutionGiven below is a cumulative frequency distribution showing the mars secured by 50 students of a class

From the frequency distribution table for the data.
View SolutionThe marks obtained by 100 students in a Mathematics test are given below :

Draw an ogive for the given distribution on a graph sheet.
(Use a scale of 2 cm = 10 units on both axis).
Use the ogive to estimate the :
(ii) lower quartile.
View SolutionThe marks obtained by 100 students in a Mathematics test are given below :

Draw an ogive for the given distribution on a graph sheet.
(Use a scale of 2 cm = 10 units on both axis).
Use the ogive to estimate the :
(i) median.
View Solution
