The marks distribution of 30 students m a mathematics examination are given in Table of Example 1. Find the mode of this data. Also compare and interpret the mode and the mean.
Here, Maximum frequency is 7.
So, Modal class will be corresponding class to 7 that is , 40−55.
Now, Mode can be given by formula,
Mode=l+f1−f02f1−f0−f2∗h
Here, l= Lower limit of modal class =40
f1= Frequency of Modal class =7
f2= Frequency of Pre Modal class =3
f3= Frequency of Succeeding Modal class =6
h= Class interval =15
Putting these values in Mode formula,
Mode=40+7−314−3−6∗15=40+45∗15=40+12=52
Mean,(¯¯¯X)=∑fixi∑fi=186030=62
So, Mode=52, indicates maximum students obtained 52 marks.
Mean=62, indicates average marks obtained by student is 62.
Topper's Solved these Questions
- BOOK - NCERTCHAPTER - STATISTICSEXERCISE - EXERCISE 14.43videos
STATISTICS
- BOOK - NCERTCHAPTER - STATISTICSEXERCISE - EXERCISE 14.26videos
STATISTICS
- BOOK - NCERTCHAPTER - STATISTICSEXERCISE - EXERCISE 14.19videos
STATISTICS
- BOOK - NCERTCHAPTER - SOME APPLICATIONS OF TRIGONOMETRYEXERCISE - SOLVED EXAMPLES7videos
SOME APPLICATIONS OF TRIGONOMETRY
- BOOK - NCERTCHAPTER - SURFACE AREAS AND VOLUMESEXERCISE - EXERCISE 13.28videos
SURFACE AREAS AND VOLUMES
Similar Questions
Knowledge Check
- Question 1 - Select One
_2019_CBT6_E01_019_Q01.png)
The marks of 20 students in an examination are given in the following table. Average marks of these student is:A2.6B2.7C2.8D2.9 - Question 2 - Select One
Given data shows marks of 32 students in an examination. Mean of the marks will be
 A18.125B21.875C22.425D22.545
The marks scored by students in Mathematics in a certain examinations are given below:

Draw histogram for the above data.View SolutionIf the mean and mode of a discrete data is 6 and 9, find the median of the data.
View SolutionIf the mean and mode of a discrete data is 6 and 9 , find the median of the data .
View SolutionThe marks out of 40 scored by 7 students in Mathematics are given below :
40,39,40,37,35,39,40.
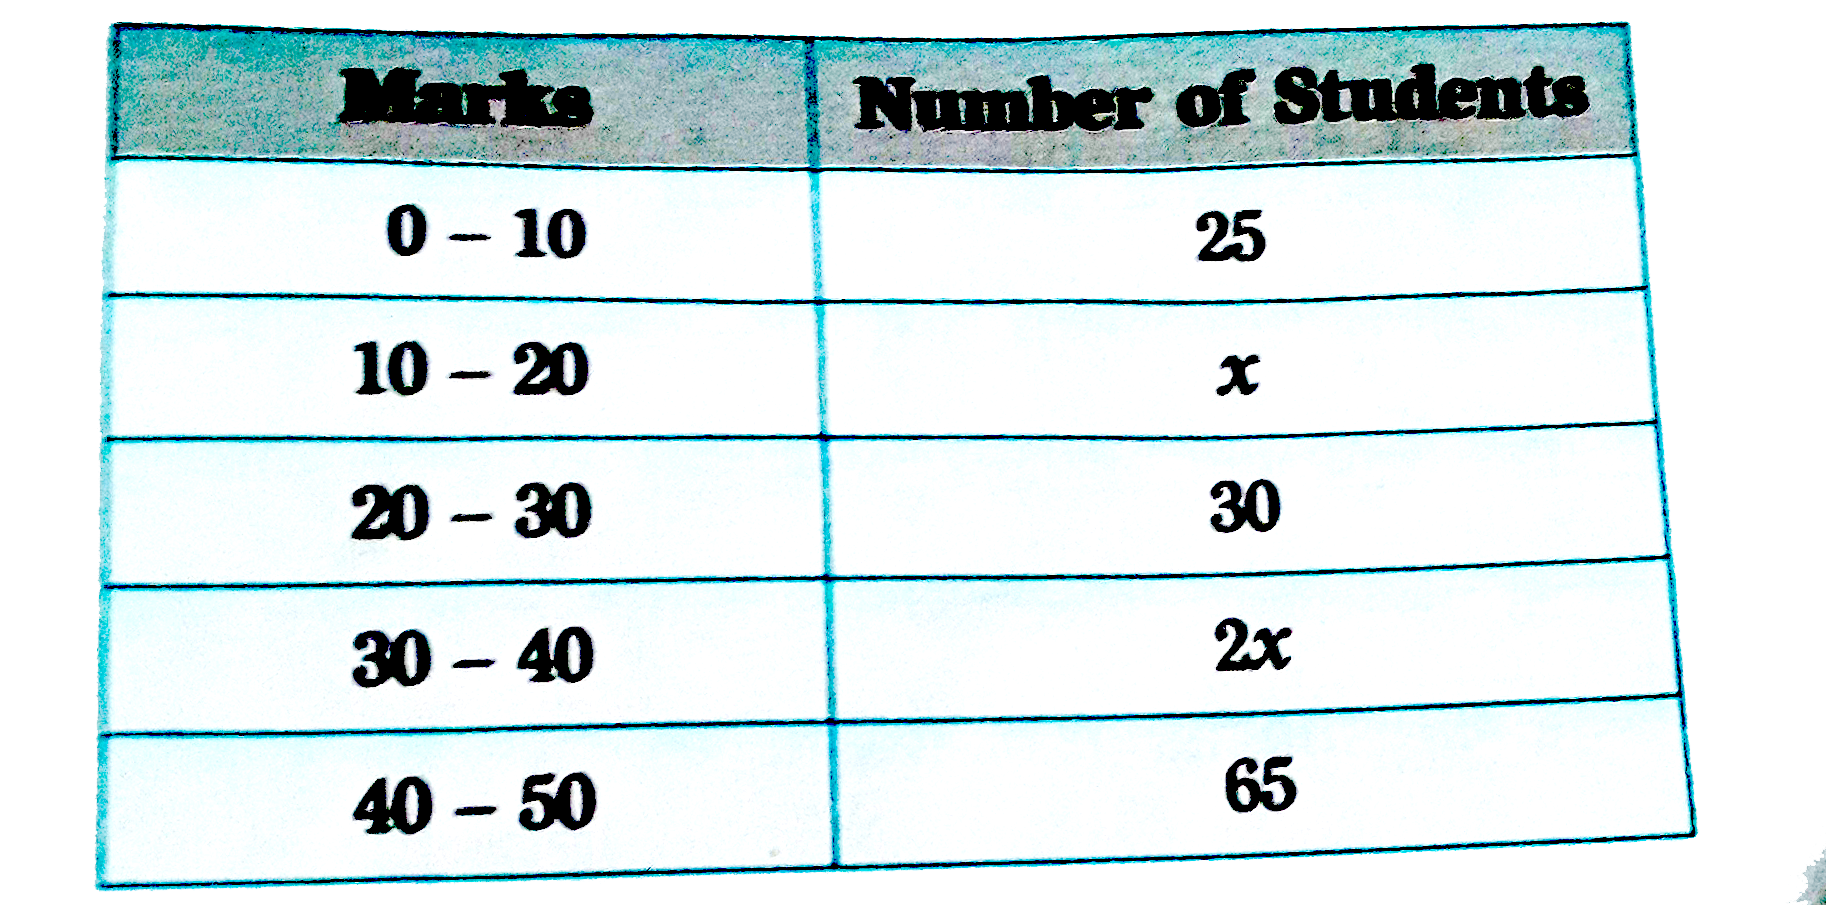
Find the medium and the mode of these marks.View SolutionThe following frequency distribution table shows marks obtained by 180 students in Mathematics examination :

Find the value of x.
Also draw a histogram representing the above informations.View SolutionThe following distribution gives the state-wise teacher-student ratio in higher secondary schools of India. Find the mode and mean of this data. Interpret the two measures.
View Solution


